Abstract
Purpose: The authors’ laboratory is developing a dual-panel, breast-dedicated PET system. The detector panels are built from dual-LSO-position-sensitive avalanche photodiode (PSAPD) modules—units holding two 8×8 arrays of 1 mm3 LSO crystals, where each array is coupled to a PSAPD. When stacked to form an imaging volume, these modules are capable of recording the 3-D coordinates of individual interactions of a multiple-interaction photon event (MIPE). The small size of the scintillation crystal elements used increases the likelihood of photon scattering between crystal arrays. In this article, the authors investigate how MIPEs impact the system photon sensitivity, the data acquisition scheme, and the quality and quantitative accuracy of reconstructed PET images.
Methods: A Monte Carlo simulated PET scan using the dual-panel system was performed on a uniformly radioactive phantom for the photon sensitivity study. To establish the impact of MIPEs on a proposed PSAPD multiplexing scheme, experimental data were collected from a dual-LSO-PSAPD module edge-irradiated with a 22Na point source, the data were compared against simulation data based on an identical setup. To assess the impact of MIPEs on the dual-panel PET images, a simulated PET of a phantom comprising a matrix of hot spherical radiation sources of varying diameters immersed in a warm background was performed. The list-mode output data were used for image reconstruction, where various methods were used for estimating the location of the first photon interaction in MIPEs for more accurate line of response positioning. The contrast recovery coefficient (CRC), contrast to noise ratio (CNR), and the full width at half maximum spatial resolution of the spheres in the reconstructed images were used as figures of merit to facilitate comparison.
Results: Compared to image reconstruction employing only events with interactions confined to one LSO array, a potential single photon sensitivity gain of >46.9% (>115.7% for coincidence) was noted for a uniform phantom when MIPEs with summed-energy falling within a ±12% window around the photopeak were also included. Both experimental and simulation data demonstrate that <0.4% of the events whose summed-energy deposition falling within that energy window interacted with both crystal arrays within the same dual-LSO-PSAPD module. This result establishes the feasibility of a proposed multiplexed readout of analog output signals of the two PSAPDs within each module. Using MIPEs with summed-energy deposition within the 511 keV±12% photopeak window and a new method for estimating the location of the first photon interaction in MIPEs, the corresponding reconstructed image exhibited a peak CNR of 7.23 for the 8 mm diameter phantom spheres versus a CNR of 6.69 from images based solely on single LSO array interaction events. The improved system photon sensitivity could be exploited to reduce the scan time by up to approximately 10%, while still maintaining image quality comparable to that achieved if MIPEs were excluded.
Conclusions: MIPE distribution in the detectors allows the proposed photodetector multiplexing arrangement without significant information loss. Furthermore, acquiring MIPEs can enhance system photon sensitivity and improve PET image CNR and CRC. The system under development can therefore competently acquire and analyze MIPEs and produce high-resolution PET images.
Keywords: high resolution PET, 3-D positioning detectors, intercrystal scatter, scintillation detectors, breast imaging, iterative image reconstruction
INTRODUCTION
Our laboratory is developing dedicated high-resolution PET systems for the breast as well as small animal imaging.1, 2, 3, 4, 5, 6 Due to the small size of the scintillation crystal arrays used, the systems have a high likelihood of having photon scattering among the arrays, yielding multiple-interaction photon events (MIPEs). Consequently, acquisition and analysis of MIPEs to collect the full energy of an incoming annihilation photon will play an important role in maintaining high system photon sensitivity and sufficient image statistics in such systems.
A number of studies have quantified the effects of MIPEs on system photon sensitivity and the quality of high-resolution PET images,7, 8, 9, 10, 11, 12 based on either crystal configurations with the ability to record only a MIPE’s center-of-mass coordinates in 2-D,7 systems that can record individual MIPE interactions, but using crystal elements larger 1 mm×1 mm×1 mm, or systems with limited ability to process MIPEs for image reconstruction.8, 9, 10, 11, 12 Different approaches have been studied in Refs. 7, 8, 9, 10, 11, 12 for identifying the first interaction in MIPEs, these include positioning MIPEs (i) at the energy-weighted spatial mean, (ii) at the interaction with the highest or second highest energy, (iii) at the interaction closest or farthest from the scintillator-photodetector interface, (iv) at the interaction most likely to be the first according to Compton kinematics or Klein–Nishina differential cross section (as well as hybrids thereof), and (v) using a maximum likelihood Bayesian estimator based on photon interaction kinematics. This study is based on a system (i) that is capable of recording individual MIPE interactions using 1 mm×1 mm×1 mm scintillation crystal elements and (ii) that applies no constraints on the types of MIPEs included for image reconstruction. We will quantify the effects of MIPEs specifically in the context of a high-resolution dual-panel PET system using a Bayesian estimator (based on Compton Kinematics and Klein–Nishina differential cross section) for identifying a MIPE’s first interaction within interaction sequences of arbitrary number of interactions.
The breast-dedicated PET system will employ a proposed multiplexed position sensitive avalanche photodiode (PSAPD)13, 14, 15 signal readout scheme to reduce readout circuit density and complexity. However, positioning of photon interactions would be ambiguous with certain patterns of photon scatter for the proposed multiplexing scheme; therefore, the efficacy thereof is dependent on the distribution of MIPEs.
In view of the above, the study includes simulated PET scans with the dual-panel breast imaging geometry with aims to (i) investigate the energy and spatial distribution characteristics of MIPEs to assess their impact on system photon sensitivity, (ii) determine the feasibility of the proposed multiplexed PSAPD signal readout scheme15 by evaluating the frequency with which positioning ambiguity arises, and (iii) assess the impact of inclusion of MIPEs in image reconstruction on the quality and quantitative accuracy of reconstructed PET images.
BREAST-DEDICATED IMAGING SYSTEM
Detector geometry
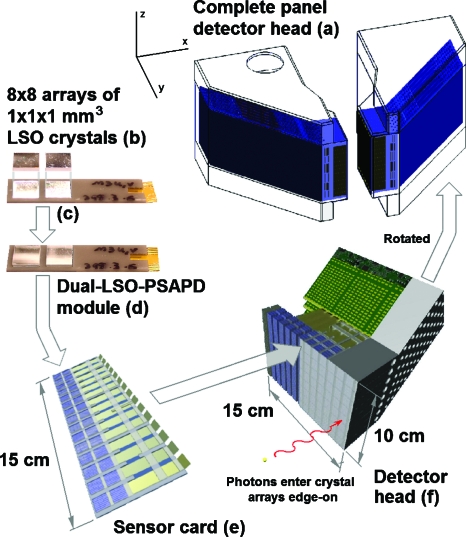
Figure 1 depicts the detector configuration of the high-resolution breast-dedicated PET imaging system. It comprises two opposing and parallel 2 cm×10 cm×15 cm (x×y×z) detector panels [Fig. 1a]. Each detector panel is built from 2190 pixelated LSO crystal arrays [Fig. 1b]. The arrays each measure 8 mm×8 mm×1 mm and are formed from 64 1 mm×1 mm×1 mm individual LSO crystals. Two crystal arrays are individually coupled to two PSAPDs mounted on a common Kapton flex cable substrate [Fig. 1c], forming a dual-LSO-PSAPD module [Fig. 1d].2 These modules are assembled side-by-side into layers [Fig. 1e] that are, in turn, stacked to form each panel (f).1 Note that in contrast to standard PET system designs, the photodetectors are coupled sideways to crystal arrays and arranged edge-on with respect to incoming photons to (i) enable direct measurement of photon interaction depth, (ii) enable 3-D positioning of individual coordinates of multiple interactions, and (iii) provide high light collection efficiency that is independent of the interaction location within any crystal element.6, 16
Figure 1.
Detector system overview; shown are (a) the fully assembled system comprising two opposing and parallel detector panels, (b) individual 8×8 arrays of 1 mm×1 mm×1 mm LSO crystals covered with a reflecting polymer, (c) coupling of the arrays to PSAPDs, (d) a dual-LSO-PSAPD module, (e) a sensor card assembling many adjacent modules, and (f) a detector head/panel assembled by stacked sensor cards, which, in turn, are coupled to readout boards. In this manner, incoming photons encounter a minimum of ∼2 cm thick LSO crystal.
The proposed data readout system has an acquisition threshold of as low as 100 keV, set by the noise floor of the system. Since individual photon interactions in MIPEs can deposit energy much less than 511 keV, the system is capable of recording the 3-D coordinates of individual interactions within a MIPE. If a MIPE’s initial photon interaction can be identified and is a part of a coincident pair, then a line of response (LOR) can be drawn from the location of the MIPE’s first interaction. This gives rise to the opportunity and necessity to investigate the significance of MIPEs in maintaining system photon sensitivity.
PSAPD readout configuration
The proposed front-end readout scheme employs multiplexing of the PSAPD analog output signals in order to reduce the circuitry’s wire density and complexity.15 The analog multiplexed signal readout connection is shown in Fig. 2. In particular, the corresponding spatial channels of the two PSAPDs within each dual-LSO-PSAPD module are joined and connected to a single preamplifier input. The common 1 and common 2 terminals are not multiplexed in order to preserve the highest energy and time resolution performance.
Figure 2.
Proposed analog signal multiplexing scheme (right) for the dual-LSO-PSAPD module (left) (Ref. 14).
For this configuration, when an event signal is output from either PSAPD 1 or 2, all signals observed on channels A–D are attributable to that PSAPD alone. However, if event signals are simultaneously produced in both PSAPDs in the same dual-LSO-PSAPD module, e.g., due to Compton scattering from one LSO array into another, then positioning ambiguities arise as there would be only six measurements to solve for eight unknowns. The feasibility of this design therefore assumes that such photon scatter rarely occurs—a supposition validated through this study.
METHODS
Photon sensitivity
For the photon sensitivity study, Monte Carlo simulations were performed using GRAY—a Monte Carlo high energy photon ray tracer for PET applications developed by our group.17GRAY was developed with the objective of simulating systems containing intricate geometries more efficiently than GATE and has been validated to produce statistically equivalent results. The speedup is achieved by storing object geometry in data structures optimized for ray tracing, which greatly accelerates the task of intersection detection of photon trajectories with material interfaces, the most time-consuming operation in standard Monte Carlo simulation methods. GRAY models physics mechanisms important in the context of PET imaging, in particular, the effects of tissue scattering and random coincidences are incorporated.
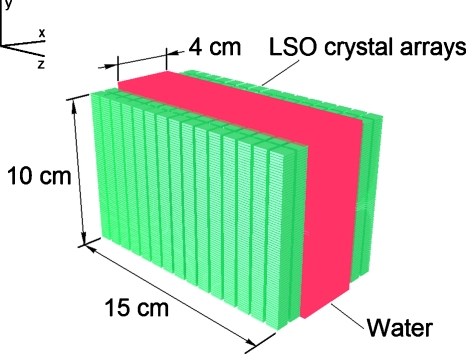
The simulated geometry used is shown in Fig. 3, where breast tissue is modeled as a uniformly radioactive slab of water with activity concentration of 100 μCi and occupying the entire 4 cm×10 cm×15 cm (x×y×z) field of view (FOV) between the two panels. Dual-LSO-PSAPD modules at the detector panel’s center and corner were studied for their multiple photon interaction characteristics. Specifically, note was taken of the fraction of all events in the simulation data where the sum energy across all of an event’s individual interactions fell within the 511 keV±12% energy window, and this was done at a range of different acquisition trigger threshold values, enabling the system photon sensitivity to be observed as a function of the acquisition threshold. When a MIPE’s sum energy falls within the 511 keV±12% energy window, it becomes possible to infer which in a MIPE’s sequence of photon interactions the initial interaction is. An energy window of ±12% was used since that is the designed energy resolution of the system.1, 2
Figure 3.
Simulation breast slab phantom geometry with 4 cm panel separation.
Effect of PSAPD multiplexed readout scheme on effective photon sensitivity
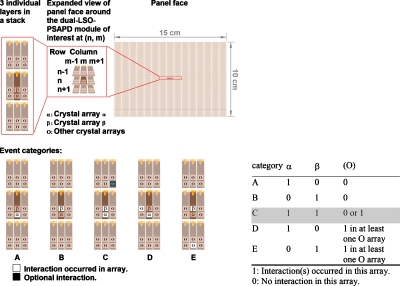
Two separate studies were performed. The first was based on the same data set as used for the photon sensitivity study using a uniform slab of radioactivity; here, however, the events were categorized according to the set of LSO arrays with which the incoming annihilation photons interacted. Figure 4 shows the categorization scheme.
Figure 4.
Photon interaction category definitions. Note that specific “O” arrays, designating “Other crystal arrays” involved in the event, are highlighted for illustration only in defining the categories.
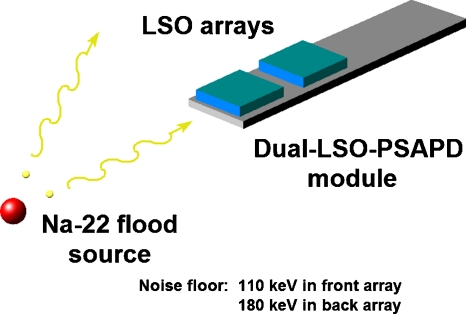
The second study was based on the geometry shown in Fig. 5. A 10 μCi 22Na isotropically radiating point source of 250 μm diameter was placed coplanar to a single dual-LSO-PSAPD module and collinear to the center line of the two LSO crystal arrays within the module. In this setup the dual-LSO-PSAPD module is freestanding and not embedded in the detector panel. The array near and far to the source is denoted the “front array” and the “back array,” respectively. Experimental measurements were taken using data acquisition system based on the RENA-3 application specific integrated circuit (Readout Electronics for Nuclear Applications version 3 by NOVA R&D, Inc., Riverside, CA).15 The acquisition energy thresholds for the dual-LSO-PSAPD module’s two PSAPDs were set above the noise floor, at 110 and 180 keV for the front and back arrays, respectively.
Figure 5.
Edge-on 22Na irradiation of a one dual-LSO-PSAPD module. Each LSO array comprises an 8×8 matrix of 1 mm×1 mm×1 mm crystal elements.
Simulation data were gathered for the same setup using GRAY based on a 511 keV±20% energy window. Here, ±20% was used for the energy window since the actual energy resolution measured using the experimental setup was 20%. Events were categorized as having interacted with (i) A: Only the front array, (ii) B: Only the back array, or (iii) C: Both arrays.
These two studies allow one to determine the frequency with which a positioning ambiguity would arise as a result of the PSAPD multiplexing scheme used, and hence assess its effect on photon sensitivity and feasibility in turn.
Reconstructed image quality and quantification
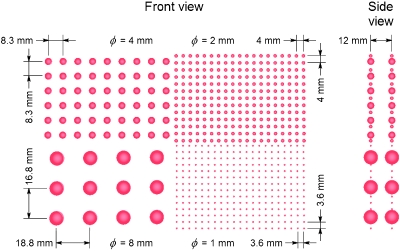
List-mode data were generated from GRAY Monte Carlo simulation using a Gaussian distributed time blur of 2 ns full width at half maximum (FWHM) and a coincidence time window of 4 ns for rejecting random coincidences. The energy resolution used was 12% at 511 keV with a window setting of 511 keV±12% to reject photon scatter in water in the simulation. The phantom used consists of a matrix of spherical annihilation photon sources arranged in two identical planes parallel to the detector panel faces (Fig. 6). The spherical sources are immersed in water, which occupies the entire 4 cm×10 cm×15 cm (x×y×z in Fig. 3) FOV between panels. Each plane contains spheres with diameters of 1, 2, 4, and 8 mm arranged in a grid pattern, with similarly sized spheres each occupying one quadrant of the plane. The ratio of the activity concentration in the hot spheres to that in the warm water background was 10:1, and the total activity was 800 μCi. The row and column separation between the sphere centers were at least twice the sphere diameters, and the two planes were placed 2 and 0.8 cm from the face of one of the panels, respectively. A simulated PET acquisition of the phantom was performed for an equivalent simulated scan time of 15 s and the data were accumulated in list mode.
Figure 6.
Phantom used for reconstructed image quality and quantification study. The ratio of the activity concentration in the spheres to that of the surrounding water is 10:1, and the total activity is 800 μCi.
A model for the LSO-PSAPD response to multiple photon interaction within a single LSO array was included in the simulation. In such intra-array scattering events, the multiple photon interactions would be detected as a single interaction whose location is given by the energy-weighted mean of the locations of the individual interactions within the LSO array.14 The simulation applied an acquisition energy threshold of 100 keV to all LSO array-PSAPD subunits.
The “sphere grid” phantom data set was reconstructed from list-mode data using the 3-D maximum likelihood expectation-maximization (MLEM) algorithm over 100 iterations running on a graphics processing unit.18 The system response was modeled by a shift-invariant 1 mm FWHM Gaussian kernel, centered on the LOR axis. The spatial discretization used 0.5 mm×0.5 mm×0.5 mm voxels.
Geometric variations in the system’s photon sensitivity over different LORs are included in the computation of the sensitivity map since these scalar coefficients cancel out in the reconstruction.19 The geometrical sensitivity, including photon attenuation, was measured by simulating a normalization phantom, consisting of a uniformly radioactive slab of water occupying the entire FOV with 50 μCi of total activity. Backprojecting all the LORs in the system for computing the sensitivity map would be a daunting task since the breast PET system has more than 19.6 billion LORs. Instead, a Monte Carlo-based backprojection approach is used to backproject a portion of all the LORs.20
MLEM was performed using each of the following three methods of LOR positioning in turn (LOR positioning refers to the estimation of the spatial location of the ends of an LOR):
-
(i)
Using only events with interactions confined to one LSO array-PSAPD subunit on a dual-module and with sum energy within the 511 keV±12% photopeak. Recall that single or multiple interaction events localized to within a single LSO array are readout as one interaction by the PSAPD; therefore, these will be referred to as “single LSO array” events. Since the crystals elements are small, it is more likely that given an interaction in one crystal array, subsequent interactions due to scattering will occur in a different crystal array, thus most (>75%) of the single LSO array events are simply “photoelectric” events. The remaining ∼25% involve intra-array scattering.
-
(ii)
Using both single LSO array events as well as MIPEs that sum to within the 511 keV±12% photopeak and using the energy-weighted spatial mean method for localizing photons for LOR positioning. Here the multiple photon interactions occur across different LSO crystal arrays. Event positioning in systems that use standard PET detectors comprising a block of scintillation crystals coupled to one PSAPD essentially corresponds to this method. This is because when all interactions of an MIPE occur within the same block detector, the event would appear as a single interaction whose position would be perceived to be at the energy-weighted spatial mean of the actual individual interaction sites. Hence, typically it is not possible to position individual interactions and only the weighted mean position over interactions is available. This is similar to intra-array scattering mentioned above.
-
(iii)
Using both single LSO array events as well as MIPEs, but using a maximum likelihood (ML) algorithm for LOR positioning. This method calculates likelihoods based on Compton kinematics and Klein–Nishina differential cross section and will be referred to as “MIPEs-ML.”21 Coincident photon events admitted for image reconstruction by this method are only those for which the confidence of having correctly identified the MIPE’s initial photon interactions is high. Specifically, this means that (i) the absolute likelihood (as calculated by the ML algorithm) of the most likely interaction sequence, as well as (ii) the ratio between the likelihood of the most likely and the second most likely sequences must both be above some preset threshold for a MIPE to be deemed useful. Intuitively, if the absolute likelihood of the most likely sequence is large and the ratio indicates a large separation thereof from the other sequences, then the algorithm is likely to have made a correct estimate, and hence the event would be admitted, otherwise it would be rejected. The algorithm was tuned to yield an overall success rate of approximately 80%, corresponding to a 78.6% success rate for two-interaction MIPEs and an 81.3% success rate for three-interaction MIPEs.
Note that for methods (ii) and (iii) above, a time coincident event pair may have either or both of its individual photon events being a MIPE.
In addition to the MIPEs-ML method described above, two MIPEs-ML variations were also implemented for comparison. The first variation is one in which the confidence threshold criterion was removed so that all MIPEs were used for image reconstruction irrespective of the confidence in ML’s estimation accuracy. This method is referred to as “MIPEs-ML without threshold.” The second variation is called “MIPEs-hybrid” because it used a hybrid of the ML and the “minimum distance” LOR positioning methods. Here the ML confidence threshold was retained, but instead of discarding the subthreshold MIPEs, the locations of their first interactions were re-estimated using the minimum distance algorithm, where the MIPE end of a LOR is placed at the location of the MIPE’s interaction that is the closest to the location of its time coincident counterpart event. The rationale behind the MIPEs-hybrid method is that while MIPEs-ML has a higher overall success rate in correctly estimating the first interaction of MIPEs, neither it nor the minimum distance algorithm can achieve 100% success rate; however, one algorithm may tend to succeed where the other tends to fail, thus we used MIPEs-hybrid method to explore the possibility of using one algorithm to complement the shortcomings of the other. Results corresponding to the two MIPEs-ML variations are not presented in full in Sec. 4 for brevity since they did not outperform the MIPEs-ML results in terms of the chosen figures of merits presented in this section.
To facilitate unbiased comparison, when reconstructing the sphere grid phantom using a particular method for LOR positioning, the same LOR positioning method was applied in calculating the sensitivity image. Likewise, to maintain equal statistics across the different methods, the same number of coincidence events (99.1 million) was used in the sensitivity map for each positioning method, which resulted in variable normalization scan duration.
Since the dual-panel detector geometry has lower photon sensitivity along the FOV periphery than at its center, voxels along the FOV periphery in the sensitivity image have very low intensity values. Arithmetic manipulations involving these minute values would introduce image artifacts into the reconstructed volume through the MLEM algorithm. To minimize their impact, voxel intensity values in the normalization volumes with less than 5% of the overall mean photon sensitivity were set to have photon sensitivity of exactly 5% of the mean.
Two related figures of merit used to facilitate comparison among the various LOR positioning methods were the contrast recovery coefficient (CRC) and the contrast to noise ratio (CNR), calculated for each sphere size after every MLEM iteration. The calculations were based on spheres at the center 75% of the FOV in the y and z directions only (100% in the x direction, refer to Fig. 3 for coordinate reference), i.e., within the useful FOV of the dual-panel system where there is sufficient photon sensitivity. Definition of CRC and CNR used are as follows:
| (1) |
| (2) |
In Eqs. 1, 2, contrast is measured from the reconstructed image. C denotes the actual simulation input ratio of the sphere activity concentration to the background. Signal and background are defined as the average intensity of voxels in the reconstructed volume, whose geometric centers lie inside and outside of the spheres in the phantom, respectively. σBackground is the spatial root-mean-square (RMS) variation of background, the ratio of which we assume is a measure of “noise.”
A third figure of merit was the FWHM size of spheres in the reconstructed image in the x, y, and z directions. Since the CNR of the reconstructed volume and hence the FWHM of spheres vary with the number of MLEM iterations, for each LOR positioning method, FWHM size calculations were performed at the iteration for which the highest CNR was achieved for the smallest detectable spheres in the reconstructed phantom.
In the FWHM calculation, the half-maximum value was computed as (signal−background)÷2+background. The FWHM values were then computed by counting how many effective consecutive voxels have intensities greater than half-maximum across a given sphere; for fractional voxels at the sphere edges, linear interpolation was performed between a boundary voxel with intensity above half-maximum and its neighboring voxel with intensity below half-maximum. The FWHM sizes are presented with error bars derived from the RMS deviation from the mean FWHM value computed over all spheres with the same diameter.
RESULTS
Photon sensitivity
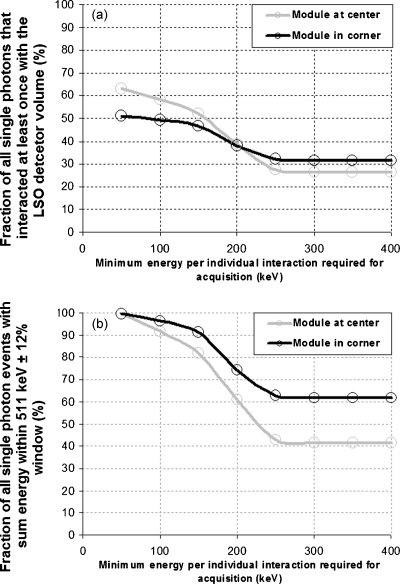
388 858 and 131 669 events were simulated for the dual-LSO-PSAPD modules located at the panel center and panel corner, respectively. These simulated events were used to create the graphs in Fig. 7, which show how the number of acquired single photon events with sum energy within the 511 keV±12% window changes as a function of the acquisition trigger threshold.
Figure 7.
Percentage of single photon events interacting with a dual-LSO-PSAPD module at the panel corner and center (see Fig. 4) with the interaction energies summing to a 24% window about 511 keV acquired as a function of minimum energy per interaction needed to trigger an acquisition. Data plotted as a fraction of (a) all single photons that interacted at least once with the LSO detector volume and (b) events with sum of energy depositions falling within the 511 keV photopeak.
In Fig. 7a 100% (the denominator) corresponds to all single 511 keV photons in the simulation that interacted at least once with a crystal array in the dual-LSO-PSAPD module at the center (grey line) or corner (black line) of the panel. The denominator here is referred to as the set of “unwindowed” events (also in Table 1 and Sec. 5A). The line in Fig. 7a corresponding to the module located at the panel center passes through 58.2% at an acquisition triggering threshold of 100 keV, 38.8% at 200 keV, and 26.4% at 300 keV. In Fig. 7b 100% corresponds to the set of all single photons that interacted with the dual-LSO-PSAPD module at the panel center (grey line) or corner (black line) with sum energy within the 511 keV±12% energy window. The denominator in this case will be referred to as the set of “windowed” events. The line corresponding to the center module passes through 91.7% at 100 keV, 61.1% at 200 keV, and 41.6% at 300 and 400 keV.
Table 1.
Frequency of occurrence of MIPEs by category.
| Categorya | % of unwindowed events | % of sum energy windowed events | ||
|---|---|---|---|---|
| Panel centerb | Panel cornerc | Panel centerd | Panel cornere | |
| A | 16.09±0.08 | 21.09±0.14 | 25.34±0.11 | 41.17±0.24 |
| B | 7.00±0.05 | 8.09±0.10 | 11.02±0.08 | 16.37±0.18 |
| C | 0.24±0.01 | 0.19±0.02 | 0.38±0.02 | 0.36±0.03 |
| D | 26.15±0.09 | 13.77±0.12 | 41.18±0.13 | 26.83±0.22 |
| E | 12.89±0.07 | 6.89±0.09 | 20.30±0.10 | 13.43±0.17 |
See Fig. 4 for definitions of categories A–E. The tolerances represent the 90% confidence interval of the percentage estimates.
100%=388 858 events.
100%=131 669 events.
100%=246 917 events.
100%=67 413 events.
Simulation also showed that less than 25% of single LSO array events suffered from intra-array scattering, but of those that did, the RMS distance between intra-array scattering interactions is 0.136 mm at an acquisition threshold of 100 keV. The presence of intra-array scatter will therefore slightly degrade the system’s spatial resolution.
Effect of PSAPD multiplexing on effective photon sensitivity
Using the data from the first simulation study with the geometry of Fig. 3, the results of Table 1 were obtained according to the event categorization scheme in Fig. 4. Note that no acquisition energy threshold was applied for this part of the study. This is because in the presence of a threshold of any arbitrary value, a below-threshold interaction in one LSO array of a dual-LSO-PSAPD module would nevertheless corrupt signals produced by a concurrent above-threshold photon interaction in the second LSO array of the same module. Table 1 should be interpreted with this in mind.
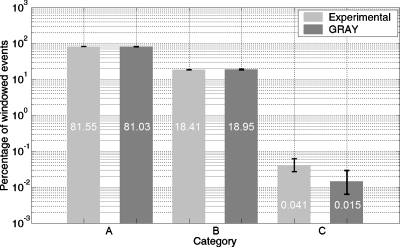
The second study involved both experiment and simulation for the geometry shown in Fig. 5. Here 100% (the denominator) corresponds to the set of all events that interacted at least once with the dual-LSO-PSAPD module and with interaction energy depositions summing to within an energy window of 511 keV±20% (the selected size of the energy window was explained in Sec. 3B). The experimental and simulated probabilities of occurrence of the three categories of events are compared in Fig. 8, which uses a logarithmic vertical axis. For both studies, only category C events give rise to positioning ambiguity under the proposed multiplexed readout scheme, as discussed in Sec. 2B.
Figure 8.
Experimental vs GRAY simulation result comparison of photon interaction categories (see Fig. 4 for the definitions, categories E and D are not applicable here for the case of edge-on irradiation of one dual-LSO-PSAPD module). Note that the vertical axis is in logarithmic scale, and 100% corresponds to all events with sum energy within a 511 keV±20% window. The statistical uncertainty in the results is shown as error bars on each bar, indicating the 90% confidence interval.
Reconstructed image quality and quantification
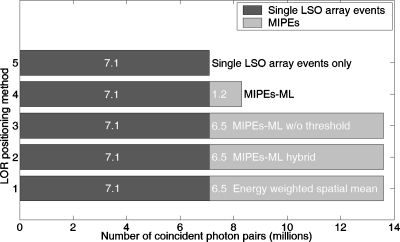
Figure 9 shows the population makeup of the coincident events used by the various LOR positioning methods in image reconstruction; Table 2 shows the corresponding scatter and random coincidence fractions. The eventwise success rates S of the MIPEs-ML algorithm in correctly identifying the first interaction were 59.2% (Srandom) and 78.9% (Strue) for MIPEs that happen to be either random and true coincidences, respectively (this excludes single LSO array events, for which no sequencing is needed).
Figure 9.
Population makeup of coincident events used in image reconstruction. The numbers inside the bars represent counts of that event type in millions. The lighter patches represent coincident photons pairs where either or both individual photon events are a MIPE.
Table 2.
Scatter and random fractions for the three LOR positioning algorithms.
| LOR positioning based on | Scatter fraction (%) | Random fraction (coincident pairs) |
|---|---|---|
| Single LSO array events only | 9.8 | 28.9% (2.05 million) |
| Single LSO array and MIPEs (weighted mean) | 10.5 | 21.1% (2.86 million) |
| Single LSO array and MIPEs (max. likelihood) | 10.2 | 19.4% (1.61 million) |
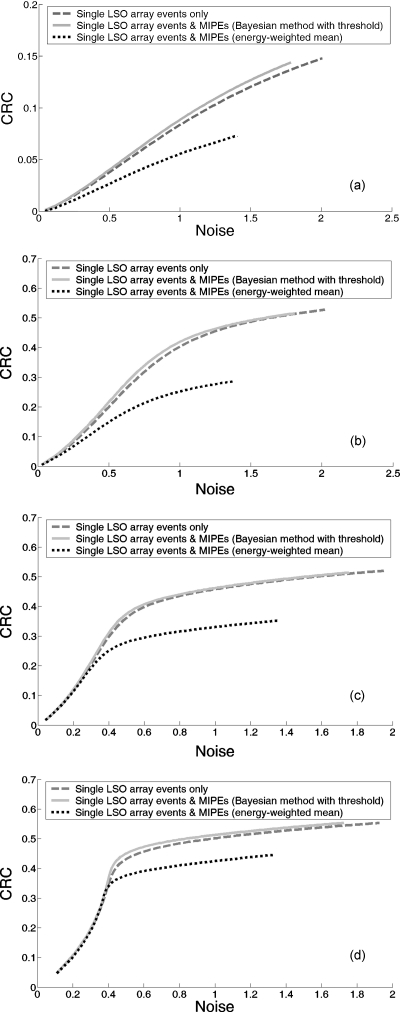
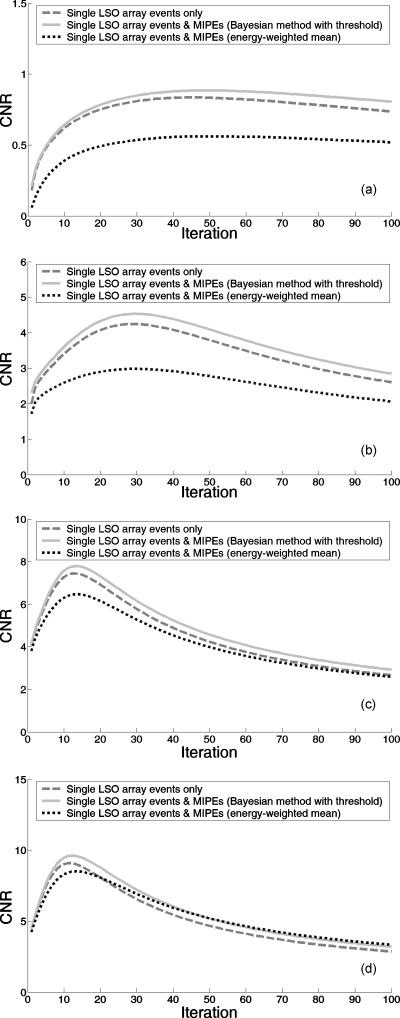
Figure 10 are the CRC vs noise curves of the reconstructed volume over successive MLEM iterations for all four sphere diameters within the phantom and based on all three LOR positioning methods. Figure 11 shows the corresponding CNR as a function of the number of MLEM iterations grouped by sphere sizes and plotted for three LOR positioning methods.
Figure 10.
Contrast recovery coefficient and noise of reconstructed volume over successive MLEM iterations up to a maximum of 100 iterations. Subplots (a), (b), (c), and (d) correspond to 1, 2, 4, and 8 mm diameter spheres in the phantom, respectively.
Figure 11.
Contrast to noise ratio as a function of number of MLEM iterations. Subplots (a), (b), (c), and (d) correspond to CNR derived from 1, 2, 4, and 8 mm diameter spheres in the phantom, respectively.
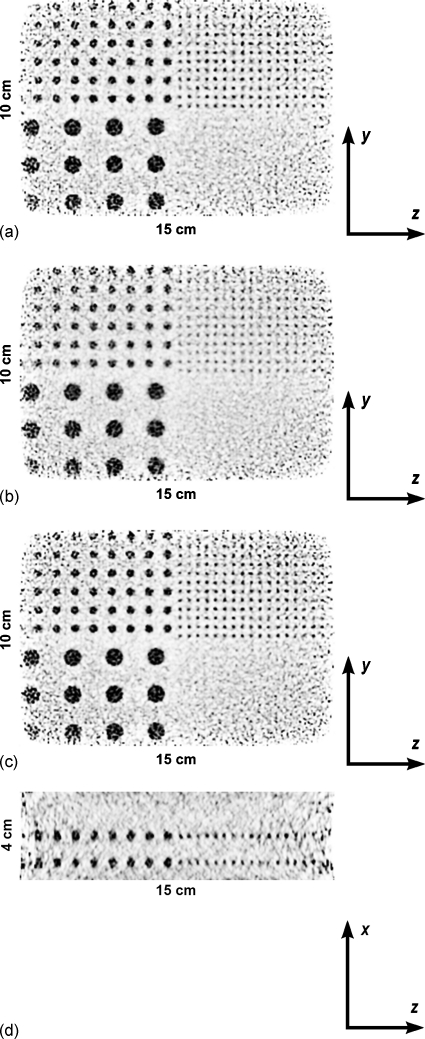
Figure 11 indicates, as Fig. 12 verifies, that given the 0.5 mm×0.5 mm×0.5 mm voxel size used in the reconstructed volume and a sphere to background activity concentration ratio of 10:1, the CNR of the 1 mm diameter spheres falls far below the Rose criterion of detectability, i.e., a minimum CNR of ∼3–∼5.22 The smallest observable phantom features for the given space discretization are therefore the 2 mm diameter spheres. In order to probe the system performance where the high-resolution capability of the system is the most enhanced, for each LOR positioning method, the FWHM sphere size measurements of the 2, 4, and 8 mm diameter spheres were made from the same image, and in particular, the image corresponding to the MLEM iteration for which the CNR for the 2 mm diameter spheres (smallest detectable feature) is maximized. The actual image slices from which the reconstructed sphere sizes were measured are shown in Fig. 12. The slice bisects the FOV along the y-z plane—it coincides with the plane of spherical sources 2 cm from one of the detector panel faces. High noise is evident along the FOV periphery due to low photon sensitivity there, but recall that only the center 75% of the images shown constitutes the useful FOV. The CNR and FWHM size measurement results are shown in Table 3. The CNR value for each sphere size was calculated locally over individual octants, and FWHM sphere sizes and variance were calculated from all spheres of the same size within each octant.
Figure 12.
Comparison of images reconstructed using (a) only single LSO array events that deposit energy within the 511 keV±12% window, (b) events used in (a) as well as MIPEs using the energy-weighted spatial mean positioning method for placing the LOR, and (c) the same event set as (b) but using the ML algorithm for estimating the initial interaction in each MIPE for positioning the LOR. (d) shows the reconstructed volume of (c) in a slice orthogonal to the panels, spanning the 4 cm panel separation. Orientation of the axes corresponds to that of Figs. 13. The sphere diameters are 1, 2, 4, and 8 mm, with mutual separation of at least twice the diameter, and have activity concentration ten times that of the surrounding medium. The total activity of the entire volume is 800 μCi and all images were normalized to account for system photon sensitivity nonuniformity.
Table 3.
Reconstructed image CNR and FWHM sphere size. (See Fig. 3 for the orientation of x, y, and z.)
| Single LSO array events only | Single LSO array and MIPES (weighted mean) | Single LSO array and MIPES (max. likelihood) | |
|---|---|---|---|
| ϕ=2 mm spheres | |||
| Peak CNR | 4.24 | 2.98 | 4.53 |
| x size (mm) | 2.1±0.4 | 2.3±0.6 | 2.1±0.4 |
| y size (mm) | 1.6±0.3 | 1.7±0.4 | 1.6±0.3 |
| z size (mm) | 1.6±0.3 | 1.8±0.3 | 1.6±0.2 |
| ϕ=4 mm spheres | |||
| CNRa | 5.88 | 5.36 | 6.16 |
| x size (mm) | 3.7±0.5 | 3.9±0.5 | 3.6±0.5 |
| y size (mm) | 3.2±0.4 | 3.3±0.3 | 3.1±0.3 |
| z size (mm) | 3.2±0.4 | 3.2±0.4 | 3.1±0.3 |
| ϕ=8 mm spheres | |||
| CNRa | 6.69 | 7.04 | 7.23 |
| x size (mm) | 7.3±1.1 | 7.5±1.0 | 7.6±1.0 |
| y size (mm) | 7.1±0.7 | 7.3±0.5 | 6.6±1.3 |
| z size (mm) | 7.2±0.8 | 7.6±0.3 | 7.4±0.8 |
This is the CNR for the 4 and 8 mm diameter spheres at the MLEM iteration where the 2 mm diameter spheres attain maximum CNR.
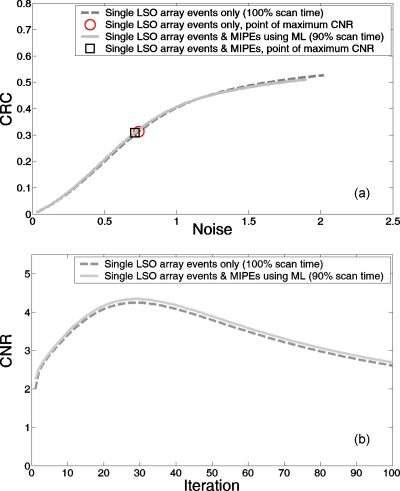
As a final part to the results, to quantify the magnitude of potential scan time reduction, the CRC-noise curve was plotted for image reconstructed over 100 MLEM iterations, but using data acquired during the first 90% of simulated scan time only [Figs. 13a, 13b]. This was done for the 2 mm diameter spheres instead of larger spheres specifically because the focus was to probe the system in the regime of operation that exploits its high spatial resolution capability.
Figure 13.
(a) Contrast recovery coefficient-noise curves of images reconstructed using the single LSO array data for 100% scan time compared to those based on the MIPEs-ML method over 90% scan time. Graph shows the CRC and noise values derived from the 2 mm diameter spheres. Curves for the 4 and 8 mm diameter spheres exhibit similar behavior. (b) Contrast to noise ratio as a function of the number of MLEM iterations. Plotted are curves derived from the 2 mm diameter spheres reconstructed using the single LSO array data for the full scan time and using the MIPEs-ML method over 90% of the scan time.
DISCUSSION
Photon sensitivity
The y-axis values traversed by the line corresponding to the center module in Fig. 7a illustrate that at the system’s acquisition threshold of 100 keV, more than half of all unwindowed events have sum energy within the 511 keV±12% window. This result suggests that the chosen system geometry and detector material offer reasonable photon sensitivity.
Figure 7 shows that the photon sensitivity increases monotonically with decreasing acquisition energy threshold values, and the graphs’ behavior can be characterized by three regions going right to left along the energy axis, viz., (i) the approximately flat region between 250 and 400 keV, (ii) a region of rapid sensitivity change between 250 and 150 keV, and (iii) a region of moderate sensitivity change from 150 down to 50 keV.
In region (i), both single LSO array events and inter-array Compton interactions with energy above 255 keV but below the 341 keV Compton edge (for 511 keV annihilation photons) would be acquired. However, the latter category of interactions would ultimately be discarded because the sum energy of any other interactions of the photon involved in the Compton interaction would necessarily have been lower than the 255 keV needed to trigger acquisition, which means that the total measured energy of that event would fall far short of the 511 keV±12% window. Region (i) therefore consists essentially of only single LSO array events, hence the lines’ flatness here.
At the low-end 150 keV threshold of region (ii), however, the two or three dominant Compton interactions of each MIPE would now likely be acquired, allowing the sum energy of most MIPES to fall within 511 keV±12%. Considering that over 90% of all single photon interactions in the dual-panel system involve at most three LSO crystal arrays, 150 keV is sufficiently low an acquisition threshold to detect all single LSO array events and most MIPEs. This explains the drastic change in sensitivity between 255 and 150 keV. In particular, for the dual-LSO-PSAPD module at the center of the panel, the rate of photon sensitivity increase is 0.248%∕keV at a threshold value of 200 keV, compared to at 100 keV, where the increase rate is more moderate at 0.111%∕keV. The lower rate of photon sensitivity increase below 100 keV in region (iii) is due to the fact that the ±12% margin of the 511 keV photopeak energy window admits into the window MIPEs with up to 62.3 keV of energy deficit so that single photon interactions detected using acquisition thresholds lower than 62.3 keV would not result in additional events admitted into window.
The implication is that lower acquisition threshold levels are useful for improving photon sensitivity via MIPEs but only to the extent that they are not limited by the scintillation crystal’s intrinsic energy resolution. Thus, for a 12% energy window, it is evident that as far as photon sensitivity is concerned, a noise level lower than the 100 keV level assumed in most of this work would not yield further gains.
The difference in the vertical position of the curve corresponding to the center module in Fig. 7b at 100 and 400 keV acquisition threshold levels is 50.1% (91.7% vs 41.6%). This indicates that as many as half of energy-windowed events at a 100 keV acquisition threshold are MIPEs since most of the events acquired at the 400 keV acquisition threshold would be single LSO array events, i.e., mostly likely photoelectric. A 100 or a 200 keV acquisition threshold would therefore realize 120.4% (91.7% vs 41.6%) and 46.9% (61.1% vs 41.6%) improvement in single photon sensitivity, respectively. Note that a 46.9% improvement in single photon sensitivity corresponds to a 115.7% gain in coincidence sensitivity. These results underscore how acquiring MIPEs using a low acquisition trigger threshold on individual interactions impacts photon sensitivity.
PSAPD multiplexing feasibility
From the results in Table 1 of the first simulation study of the geometry in Fig. 3, we see that the probability of category C events occurring within dual-LSO-PSAPD modules located at either the center or corner of the detector panels is consistently less than 0.4% and much less than any of the other event types tabulated in Table 1. This implies that even a simple scheme of “category C discard” would eliminate any positioning ambiguity for multiplexing with negligible reduction in system photon sensitivity. Recall that values in Table 1 were calculated with the deliberate absence of an acquisition energy threshold. Under this condition, categories C–E jointly constitute the set of all MIPEs, which together make up as much as 62% of all sum energy-windowed events at the panel center. Figure 9 shows a lesser fraction of nonsingle LSO array events, this is due to the presence of a 100 keV acquisition threshold applied for the image reconstruction part of the study.
Figure 8 shows that for the single dual-LSO-PSAPD module geometry, experiment and simulation yielded largely corresponding results. We see that category C events are about three orders of magnitude less frequent than that of the other event categories, where the positioning is unambiguous. From this, it is clear that results from both studies validate the assumption of the occurrence of positioning ambiguity being rare and verify the feasibility of using the proposed two-PSAPD multiplexed front-end readout scheme without degrading the photon sensitivity.
Reconstructed image quality
Starting from Fig. 9, it is first noted that Monte Carlo simulation of the phantom verified that acquisition of MIPEs indeed increases the coincident photon sensitivity and hence reduce noise in the reconstructed images. All detected MIPEs with sum energy within the 511 keV±12% window were used in image reconstruction for the (i) energy-weighted spatial mean LOR positioning method, (ii) MIPEs-ML without threshold method, and (iii) MIPEs-hybrid method, resulting in the effective coincident photon sensitivity approximately doubling in these cases compared to processing events that only involve one LSO array. This is consistent with the results shown in Fig. 7. However, Fig. 10 unambiguously shows that increased statistics does not result in improved CRC-noise trade-off if LORs corresponding to MIPEs cannot be accurately positioned (dark dotted curve in Fig. 10).
Comparing the single LSO array events and MIPEs-ML LOR positioning methods, Table 2 indicates that the latter reduced the random coincidence rate in absolute terms in spite of a larger total number of events accepted. This suggests that the MIPEs-ML algorithm with likelihood thresholding can function as an effective events filter based on multiple coincidence detection and Compton kinematics.
Section 4C also stated that the eventwise success rate S of the MIPEs-ML algorithm in correctly identifying the first photon interaction of a MIPE is higher for MIPEs involved in true coincidences (Strue=78.9%) than for those in random coincidences (Srandom=59.2%). This is understandable since positioning MIPEs in random coincidences using our methodology is more likely to be inconsistent with Compton kinematics. Note that Srandom and Strue are rates already conditioned on whether or not an event is part of a random coincidence, hence they are independent of the random coincidence fraction R (19.4% for MIPEs-ML as per Table 2). Although Srandom<Strue, the image quality is independent of Srandom for any given R because the position of a random coincidence event is already random, and mispositioning a noise contribution does not further degrade the image. The implication hereof is that image degradation in the presence of random coincidence is attributable to the fact that they are random (regardless of the LOR positioning algorithm) and not due to compromised performance of the MIPEs-ML algorithm (since Strue is independent of R as noted).
Next, Fig. 10 suggests that contrast is recovered much more rapidly using the MLEM image reconstruction algorithm for larger (>2 mm diameter) radioactive sources than for smaller (<2 mm diameter) ones. This is evidenced by the plateau in the CRC value for the 8 mm diameter spheres after only 20 MLEM iterations. On the other hand, the CRC curve of the 1 mm diameter spheres does not reach a plateau “knee” even at the 100th MLEM iteration—much more MLEM iterations would be needed if we desire full contrast recovery of features with the highest spatial frequency components, which is usually accompanied by a corresponding decrease in CNR.
Third, since the incorporation of MIPEs into image reconstruction via the ML algorithm inevitably results in a higher fraction of incorrectly positioned LORs than if only single LSO array events were used, the MIPEs-ML method’s achievable CRC will necessarily converge to a lower final value than that based only on the single LSO array data. Encouragingly, this is not immediately obvious from Fig. 10 because within the first 100 MLEM iterations the MIPEs-ML CRC curves for all sphere sizes remained above the CRC curve of images reconstructed using single LSO array events only. This shows that MIPEs-ML offers better initial CRC-noise trade-off than the single LSO array data set, i.e., the MIPEs-ML CRC curve initially runs above the single LSO array data curve before eventually converging to a lower final value.
Not shown are CRC curves of the MIPEs-ML without confidence threshold and MIPEs-hybrid variations in the ML algorithm. They exhibited similar behavior to the MIPEs-ML’s CRC curve, but the plateaus in their CRC curves are below that of the MIPEs-ML algorithm (by approximately 0.05 along the vertical axis for the cases of 2, 4, and 8 mm diameter sphere sizes). This indicates that while these MIPEs-ML variations are more accurate than the energy-weighted spatial mean method in positioning LORs, the level of accuracy remains insufficient to match the performance of images based on only single LSO array event data.
Fourthly, Fig. 10 shows that for any given MLEM iteration, the noise level corresponding to MIPEs-ML is greater than that corresponding to the energy-weighted spatial mean method. This can be understood by comparing the population size shown in Fig. 9. In particular, MIPEs-ML admits into the reconstructed image only the subset of MIPEs (18.9%) for which there is a high confidence of the LOR being positioned correctly (refer to Sec. 3C). A higher confidence or success rate threshold would have led to even fewer MIPEs being incorporated.
Unsurprisingly, the noise levels corresponding to MIPEs-ML without threshold and MIPEs-hybrid were comparable to that of the energy-weighted spatial mean method since all three methods operated on larger data sets of identical size (Fig. 9). Unfortunately, the lower noise levels are accompanied by a corresponding lowering in contrast recovery, resulting in no net improvement in the CNR over the MIPEs-ML method.
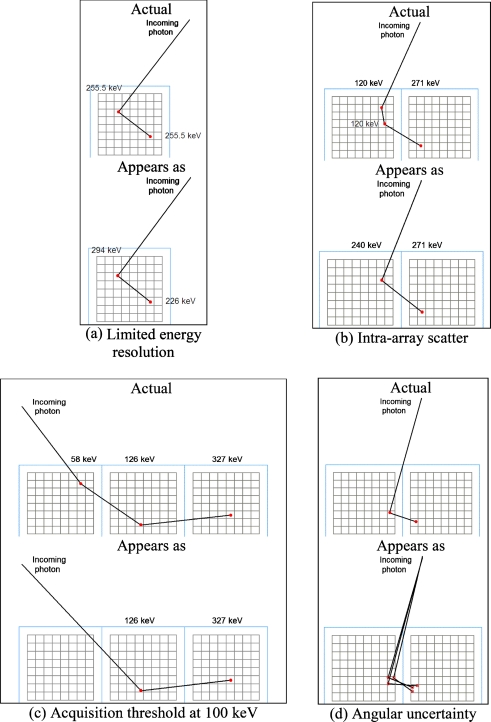
The fact that the MIPEs-ML algorithm’s MIPE admission rate is not higher underscores the difficulty in the task of inferring the correct site of initial interaction in MIPEs using only energy measurements and Compton kinematics. This task is made especially difficult by the convolution of several factors in the dual-panel breast-dedicated PET imaging system. These include limited energy resolution of LSO-PSAPD detectors [example shown in Fig. 14a], merging of intra-array scatter interactions within individual 8 mm×8 mm×1 mm LSO crystal arrays due to charge multiplexing inherent to PSAPDs (Ref. 2) [Fig. 14b], interactions omitted due to the acquisition threshold [Fig. 14c], as well as considerable angular uncertainty consequent of the finite spatial discretization of the LSO array (1 mm×1 mm×1 mm) being comparable to the interscatter distance of photons in LSO [Fig. 14d].
Figure 14.
Confounding factors to the MIPEs-ML LOR positioning algorithm. Note that occurrences in only two dimensions are shown for simplicity.
Degradation in energy and angular resolution is especially harmful to the ML processing of two-interaction MIPEs, as the algorithm already has to contend with having one independent and one pseudoindependent energy measurement for the LOR positioning task (the two energy measurements are highly anticorrelated as they must sum to 511 keV±12%). Indeed, the algorithm performs better for three-interaction MIPEs (1.53% of all single photon events) and four-interaction MIPEs (0.01% of all single photon events) with 81.3% and 87.9% success rates, respectively. This can be understood by considering that the increased number of measurements associated with more photon interactions provide added information to exclude less likely interaction sequences. Unfortunately, a consequence of the relatively high Z of LSO is that most incoming 511 keV photons will result in only two-photon interactions, which limits the overall success rate of the MIPEs-ML positioning algorithm.
Fifthly, the measurements of Table 3 show that the single LSO array event and MIPEs-ML images [Figs. 12a, 12c] have generally comparable image resolution, which is superior to the resolution of the energy-weighted spatial mean image [Fig. 12b]. For images reconstructed using the energy-weighted mean method, the FWHM diameter of the 2 mm diameter spheres in the y, z, and x directions are ∼1.7, ∼1.8, and 2.3 mm, respectively, compared to ∼1.6 mm (∼5.9% improvement), ∼1.6 mm (∼11.1% improvement), and 2.1 mm (∼8.7% improvement) as derived from the single LSO array event and MIPEs-ML images. Similar but smaller improvements can be observed for the 4 and 8 mm diameter spheres. This difference in spatial resolution is expected since the energy-weighted spatial mean method makes the oversimplistic assumption that the best location to position a MIPE is toward the interactions with higher energy deposition. As previously mentioned, this corresponds to the positioning mechanism of standard PET detectors. This confirms that the ability to position individual interactions in MIPEs clearly yields improved image quality and quantification compared to that available with a system built with the standard PET detector design.
In terms of CNR, Table 3 shows that at the MLEM iteration where each LOR positioning method achieves its maximum CNR for the 2 mm diameter spheres, the MIPEs-ML method in fact produced higher CNR than even the single LSO array event data for spheres of all detectable sizes. This is attributable to the improved image statistics via inclusion of MIPEs. At this point, the CNR improvement realized by MIPEs-ML over the single LSO array data is 6.81% for the 2 mm diameter spheres (4.53 vs 4.24), 4.72% for the 4 mm diameter spheres (6.16 vs 5.88), and 7.98% for the 8 mm diameter spheres (7.23 vs 6.69). The CNR corresponding to the MIPEs-ML without threshold and MIPEs-hybrid methods were 4.49 and 4.28, respectively, for the 2 mm diameter spheres, which are lower than that of the MIPEs-ML method, but higher than the CNR based on only single LSO array events.
Figure 12d and Table 3 illustrate the effect of limited-angle tomography. In particular, the phantom spheres appear elongated along the x direction, e.g., ∼1.6 mm FWHM diameter in the y and z directions vs ∼2.1 mm FWHM diameter in the x direction for the 2 mm diameter spheres. This results from the system’s limited-angle tomography where LORs provide poor localization along the x direction. However, the 16 layers of 1 mm photon interaction depth resolution mitigate this effect of limited-angle tomography compared to dual-panel systems that do not have interaction depth resolution.23, 24
So far the results suggest that as far as FWHM sphere resolution, CRC, rate of contrast recovery, and CNR are concerned, the MIPEs-ML method consistently outperforms its variations, i.e., the MIPEs-ML without threshold and MIPEs-hybrid methods, and its performance is at least as good as using only single LSO array events. This allows us to narrow our focus to the MIPEs-ML algorithm in the discussion of quantifiable benefits of employing MIPEs in PET.
MIPEs-ML has been shown to yield a superior CRC-noise trade-off compared to using only single LSO array events for the initial iterations of MLEM. Conversely, the benefit of employing MIPEs-ML could also be measured in terms of a reduced scan time that would achieve the same CRC-noise trade-off as the single LSO array events over the original full scan duration. The results of such a comparison between a scan using only single LSO array events and a scan using MIPEs-ML over a 10% shorter acquisition time are shown in Figs. 13a, 13b.
Compared to Fig. 10b, the corresponding points along the two LOR positioning methods’ curves track each other more closely in Fig. 13a. This is an indication that the image quality realized by the single LSO array data utilizing the full 100% scan time is comparable to the quality realized by MIPEs-ML utilizing just 90% of the data. Quantitatively, at the point of MIPEs-ML’s maximum CNR in Fig. 13 (iteration 29), the difference between CNR values for the 2 mm diameter spheres between the two methods is within 2.26% of each other (4.34 vs 4.24). Data for the 4 and 8 mm diameter spheres exhibit similar behavior.
Evidently, the system performance based on using events involving only one LSO array can be matched by the MIPEs-ML method with shorter scan times. The fact that the CNR gain decreased from 6.81% to 2.26% as a result of just 10% shorter acquisition time [Fig. 13b], however, does not suggest potential for reducing the scan time by much more than 10% without CNR loss.
Results of the study show that the potential value of MIPEs-ML can be realized via either CNR improvements over a fixed scan time, or alternatively a slightly reduced scan time for a given desired CNR. Putting this in context of the computational effort required by the MIPEs-ML algorithm as well as the more demanding data acquisition backend system requirements, the decision of whether or not to exploit MIPEs in a PET imaging system is not a trivial one. For instance, for a volume discretized into 0.5 mm×0.5 mm×0.5 mm voxels, MIPEs-ML-enhanced CNR may be appropriate and indeed necessary for the detection and visualization of breast lesions with a diameter of approximately 2 mm; however, the use of MIPEs-ML toward scan time reduction for tasks requiring a lower image resolution would not be equally justified if the original scan time was on the order of just a few minutes, which this system will be capable of due to its high photon sensitivity.1 The impact and the added value of MIPEs in PET image reconstruction is therefore ultimately a task-dependent one.
CONCLUSION
The multiple photon interaction characteristics of a high-resolution PET system under construction were quantified through both Monte Carlo simulation and experiment. With MIPEs making up 50% of energy-windowed events at a 100 keV acquisition threshold, the importance of the ability to acquire and accurately position MIPEs was elucidated. The less than 0.4% probability of both LSO arrays in a dual-LSO-PSAPD module being simultaneously involved in an incoming single photon event shows that multiplexing of the PSAPD signals within a single dual-LSO-PSAPD module has a <0.4% effect on photon sensitivity. The system’s capability to acquire individual interactions with a 100 or a 200 keV low energy threshold was seen to facilitate more than 46.9% improvement in system single photon sensitivity compared to accepting only single LSO array events at 511 keV±12%. Finally, the performance of a variety of MIPE LOR positioning algorithms was compared using Monte Carlo simulation data. The selective inclusion of MIPEs by the best-performing ML-based LOR positioning algorithm was verified to produce PET images with up to 8% CNR improvement and comparable FWHM image resolution to image acquisition based only on single LSO array events. MIPEs were also shown to be potentially useful in reducing the required scan time for a given reconstructed image CNR by up to approximately 10%. As ML processing of MIPEs has an associated computational cost, we are investigating further accelerated approaches to ML processing of MIPEs (Ref. 21) so that the incorporation of MIPEs for its benefits can be made more practical.
ACKNOWLEDGMENTS
The authors acknowledge the support of this work by the U.S. National Institute of Health under Grant Nos. R01 CA119056, R01 CA119056-S1 (ARRA), and R33 EB003283, and the support of Stanford Bio-X Graduate Fellowships for Dr. Guillem Pratx and Frances W. Y. Lau. The authors also wish to thank Dr. Arne Vandenbroucke for his time and valuable input towards the compilation of this manuscript.
References
- Zhang J. et al. , “Study of the performance of a novel 1 mm resolution dual-panel PET camera design dedicated to breast cancer imaging using Monte Carlo simulation,” Med. Phys. 34(2), 689–702 (2007). 10.1118/1.2409480 [DOI] [PMC free article] [PubMed] [Google Scholar]
- Zhang J., Foudray A. M. K., Olcott P. D., Farrell R., Shah K., and Levin C. S., “Performance characterization of a novel thin position-sensitive avalanche photodiode for 1 mm resolution positron emission tomography,” IEEE Trans. Nucl. Sci. 54(3), 415–421 (2007). 10.1109/TNS.2007.894128 [DOI] [Google Scholar]
- Olcott P. D., Lau F. W. Y., and Levin C. S., “Data acquisition system design for a 1 mm3 resolution PSAPD-based PET system,” Nuclear Science Symposium Conference Record, 2007 (NSS ‘07), 26 October–3 November 2007. (IEEE, Honolulu, 2007), Vol. 5, pp. 3206–3211.
- Vandenbroucke A., Foudray A. M. K., Olcott P. D., and Levin C. S., “Performance characterization of a new high resolution PET scintillation detector,” Phys. Med. Biol. 55(19), 5895–5911 (2010). 10.1088/0031-9155/55/19/018 [DOI] [PMC free article] [PubMed] [Google Scholar]
- Vandenbroucke A. and Levin C. S., “Study of scintillation crystal array parameters for an advanced PET scanner dedicated to breast cancer Imaging,” Nuclear Science Symposium Conference Record, 2008 (NSS ’08) (IEEE, Dresden, 2008), pp. 4914–4919.
- Levin C. S., “New imaging technologies to enhance the molecular sensitivity of positron emission tomography,” Proc. IEEE 96(3), 439–467 (2008). 10.1109/JPROC.2007.913504 [DOI] [Google Scholar]
- Shao Y., Cherry S. R., Siegel S., and Silverman R. W., “A study of inter-crystal scatter in small scintillator arrays designed for high resolution PET imaging,” IEEE Trans. Nucl. Sci. 43(3), 1938–1944 (1996). 10.1109/23.507250 [DOI] [Google Scholar]
- Rafecas M., Böning G., Pichler B. J., Lorenz E., Schwaiger M., and Ziegler S. I., “Inter-crystal scatter in a dual layer, high resolution LSO-APD positron emission tomography,” Phys. Med. Biol. 48(7), 821–848 (2003). 10.1088/0031-9155/48/7/302 [DOI] [PubMed] [Google Scholar]
- Comanor K. A., Virador P. R. G., and Moses W. W., “Algorithms to identify detector Compton scatter in PET modules,” IEEE Trans. Nucl. Sci. 9(4), 2213–2218 (1996). 10.1109/23.531884 [DOI] [Google Scholar]
- Lam C. F., Nagiwara N., Obi T., Yamaguchi M., Haneishi H., Tsuda T., Yoshida E., Yamaya T., and Murayama H., “Investigation of the effects of inter-crystal scatter reduction on reconstructed images in the jPET-D4 scanner,” Med. Imaging Technol. 23(5), 318–327 (2005). [Google Scholar]
- Rechka S., Fontaine R., Lecomte R., and Rafecas M., “LabPET inter-crystal scatter study using GATE,” Nuclear Science Symposium Conference Record, 2009 (NSS ‘09), 24 October–1 November 2009. (IEEE, Orlando, 2009), pp. 3988–3994.
- Champley K. M., Lewellen T. K., MacDonald L. R., Miyaoka R. S., and Kinahan P. E., “Statistical LOR estimation for a high-resolution dMiCE PET detector,” Phys. Med. Biol. 54(20), 6369–6382 (2009). 10.1088/0031-9155/54/20/022 [DOI] [PMC free article] [PubMed] [Google Scholar]
- Shah K. S., Farrell R., Grazioso R., Harmon E. S., and Karplus E., “Position-sensitive avalanche photodiodes for gamma-ray imaging,” IEEE Trans. Nucl. Sci. 49(4), 1687–1692 (2002). 10.1109/TNS.2002.801510 [DOI] [Google Scholar]
- Levin C. S., Foudray A. M. K., Olcott P. D., and Habte F., “Investigation of position sensitive avalanche photodiodes for a new high-resolution PET detector design,” IEEE Trans. Nucl. Sci. 51(3), 805–810 (2004). 10.1109/TNS.2004.830112 [DOI] [Google Scholar]
- Lau F. W. Y., Vandenbroucke A., Olcott P. D., Horowitz M. A., and Levin C. S., “Front-end electronics for a 1 mm3 resolution avalanche photodiode-based PET system with analog signal multiplexing,” Nuclear Science Symposium Conference Record, 2008 (NSS ’08) (IEEE, Dresden, 2008), pp. 3871–3874.
- Levin C. S., “Design of a high-resolution and high-sensitivity scintillation crystal array for PET with nearly complete light collection,” IEEE Trans. Nucl. Sci. 49(5), 2236–2243 (2002). 10.1109/TNS.2002.803870 [DOI] [Google Scholar]
- Olcott P. D., Buss S. R., Levin C. S., Pratx G., and Sramek C. K., “GRAY: High energy photon ray tracer for PET applications,” Nuclear Science Symposium Conference Record, 2006 (NSS ‘06), 29 October 2006–1 November 2006. (IEEE, San Diego, 2006), Vol. 4, pp. 2011–2015.
- Pratx G., Chinn G., Olcott P. D., and Levin C. S., “Fast, accurate and shift-varying line projections for iterative reconstruction using the GPU,” IEEE Trans. Med. Imaging 28(3), 435–445 (2009). 10.1109/TMI.2008.2006518 [DOI] [PMC free article] [PubMed] [Google Scholar]
- Rahmim A., Lenox M., Reader A. J., Michel C., Burbar Z., Ruth T. J., and Sossi V., “Statistical list-mode image reconstruction for the high resolution research tomography,” Phys. Med. Biol. 49(18), 4239–4258 (2004). 10.1088/0031-9155/49/18/004 [DOI] [PubMed] [Google Scholar]
- Qi J., “Calculation of the sensitivity image in list-mode reconstruction for PET,” IEEE Trans. Nucl. Sci. 53(5), 2746–2751 (2006). 10.1109/TNS.2006.882298 [DOI] [Google Scholar]
- Pratx G. and Levin C. S., “Bayesian reconstruction of photon interaction sequences for high-resolution PET detectors,” Phys. Med. Biol. 54, 5073–5094 (2009). 10.1088/0031-9155/54/17/001 [DOI] [PMC free article] [PubMed] [Google Scholar]
- Rose A., Vision: Human and Electronic (Plenum, New York, 1973). [Google Scholar]
- Smith M. F., Raylman R. R., Majewski S., and Weisenberger A. G., “Positron emission mammography with tomographic acquisition using dual planar detectors: Initial evaluations,” Phys. Med. Biol. 49(11), 2437–2452 (2004). 10.1088/0031-9155/49/11/022 [DOI] [PubMed] [Google Scholar]
- Weinberg I. N., Beylin D., Zavarzin V., Yarnall S., Stepanov P. Y., Anashkin E., Narayanan D., Dolinsky S., Lauckner K., and Adler L. P., “Positron emission mammography: High-resolution biochemical breast imaging,” Technol. Cancer Res. Treat. 4(1), 55–60 (2005). [DOI] [PubMed] [Google Scholar]


