Abstract
Purpose: The accuracy of the system model that governs the transformation from the image space to the projection space in positron emission tomography (PET) greatly affects the quality of reconstructed images. For efficient computation in iterative reconstructions, the system model in PET can be factored into a product of geometric projection and sinogram blurring function. To further speed up reconstruction, fully 3D PET data can be rebinned into a stack of 2D sinograms and then be reconstructed using 2D iterative algorithms. The purpose of this work is to develop a method to estimate the sinogram blurring function to be used in reconstruction of Fourier-rebinned data.
Methods: In a previous work, the authors developed an approach to estimating the sinogram blurring function of nonrebinned PET data from experimental scans of point sources. In this study, the authors extend this method to the estimation of sinogram blurring function for Fourier-rebinned PET data. A point source was scanned at a set of sampled positions in the microPET II scanner. The sinogram blurring function is considered to be separable between the transaxial and axial directions. A radially and angularly variant 2D blurring function is estimated from Fourier-rebinned point source scans to model the transaxial blurring with consideration of the detector block structure of the scanner; a space-variant 1D blurring kernel along the axial direction is estimated separately to model the correlation between neighboring planes due to detector intrinsic blurring and Fourier rebinning. The estimated sinogram blurring function is incorporated in a 2D maximum a posteriori (MAP) reconstruction algorithm for image reconstruction.
Results: Physical phantom experiments were performed on the microPET II scanner to validate the proposed method. The authors compared the proposed method to 2D MAP reconstruction without sinogram blurring model and 2D MAP reconstruction with a Monte Carlo based blurring model. The results show that the proposed method produces images with improved contrast and spatial resolution. The reconstruction time is unaffected by the new method since the blurring component takes a relatively negligible part of the overall reconstruction time.
Conclusions: The proposed method can estimate sinogram blurring matrix for Fourier-rebinned PET data and can be used to improve contrast and spatial resolution of reconstructed images. The method can be applied to other human and animal scanners.
Keywords: detector response, sinogram blurring kernel, axial blurring kernel, positron emission tomography, iterative image reconstruction, system modeling
INTRODUCTION
Iterative image reconstruction methods have gained increasing popularity in positron emission tomography (PET) because they are amenable to an arbitrary, complicated, and realistic system model that defines the mapping from sources to measurements. The system model is usually stored in a set of factored matrices to reduce storage and computational costs.1, 2, 3, 4, 5, 6, 7 The major element is the geometric projection matrix that is either approximated by simple line integrals or calculated based on the solid angle effect. The second component is the sinogram blurring function, or detector response, which models the physical effects such as crystal penetration, intercrystal scatter, photon noncollinearity, etc.1, 2 The sinogram blurring matrix can be calculated analytically,4, 8, 9, 10 but it is hard to model all the physical effects of the photon detection process. Direct measurement is also challenging because it requires placing a collimated point source at different radial positions inside the PET scanner to avoid crosstalk between measurements taken at different angles.11 As a result, Monte Carlo simulations are often used to estimate the detector blurring matrix1, 6 or the complete system matrix without any decomposition between the geometric and blurring components.12 In our previous work,13, 14 we proposed a maximum likelihood (ML) approach to estimating the 2D blurring kernel in both radial and angular directions from experimental measurements of noncollimated point sources. Our method differs from other approaches2, 5 with the explicit modeling of the block structure of the detector instead of assuming the detector blurring matrix to be the same for all azimuthal angles and the addition of blurring effect along the angular direction. A similar ML method was used to estimate the detector response in SPECT from measurements of an extended source,15 but that method is not applicable to PET because of the differences in scanner geometry.
In this work, we apply the sinogram blurring matrix estimation to Fourier-rebinned data with the aim to speed up reconstruction by first Fourier rebinning (FORE)16, 17, 18 fully 3D data into 2D sinograms, and then reconstructing the image using a 2D iterative reconstruction algorithm. The rebinning algorithms range in complexity from the single slice rebinning algorithm19 to the Fourier rebinning with John’s equation18 (FOREJ) and the exact Fourier rebinning algorithm.20 In this paper, we use the FOREJ algorithm, which will be simply referred to as FORE from here on. By directly estimating the sinogram blurring function from FORE data, we expect to model the loss in resolution introduced by the FORE step in addition to the burring caused by PET detectors. Furthermore, a space-variant 1D axial blurring function is estimated separately to model the detector intrinsic axial blurring and the blurring across neighboring planes following the FORE algorithm. The estimated blurring matrices have been incorporated into a 2D maximum a posteriori (MAP) reconstruction. Alessio et al.21 proposed a method to compute the transaxial and the axial FORE kernels analytically and deconvolve the FORE kernels in sinogram space prior to FBP reconstruction. Our approach models both detector blurring and FORE-related blurring in a single sinogram blurring function and integrates it into the system model in an iterative reconstruction algorithm. We used an existing MAP algorithm in this paper, but the estimated blurring kernel can be incorporated into other iterative reconstruction algorithms, such as the attenuation-weighted ordered-subsets22 and the penalized weighted least-squares23 algorithms. We performed physical phantom experiments on the microPET II scanner24 to compare the proposed MAP reconstruction with the MAP reconstruction using a Monte Carlo (MC)-based detector response function and MAP reconstruction without detector response modeling.
MATERIALS AND METHODS
The imaging system model
In this paper we focus on reconstruction of Fourier-rebinned (or conventional 2D) PET data. Since PET data are prenormalized and attenuation corrected prior to Fourier rebinning, the expectation of the FORE data can be modeled as an affine transform of the tracer distributionx∊RM×1
| (1) |
where and are the expectation of the randoms and the scatters, respectively. The factored system matrix consists of three components: B∊RN×N is the transaxial sinogram blurring matrix with the (i,j)th element, bij, being the blurring contribution from detector pair j to detector pair i; G∊RN×M is the geometrical projection matrix with the (i,j)th element being the probability of an event from voxel j reaching the face of detector pair i in the absence of object attenuation; and Z∊RM×M is the axial blurring matrix. Here, G is computed based on the solid angle extended from each voxel to each detector pair. The estimation of the transaxial sinogram blurring matrix B and the axial blurring matrix Z is described below.
The above model considers the axial blurring component to be separable from the in-plane sinogram blurring, which is reasonable for image reconstruction of 2D PET data (Fourier-rebinned or conventional 2D) (Ref. 5) and also allows us to estimate the transaxial blurring component and the axial blurring component separately. Here we let the axial blurring matrix Z act on the image space directly, but it can also be applied to the sinogram as long as the geometric projection matrix G does not introduce any additional axial blurring. When the number of image voxels is less than the number of lines of response in the rebinned sinogram, the image space axial blurring is more computationally efficient.
Estimation of the transaxial sinogram blurring matrix
The transaxial sinogram blurring matrix B models crystal penetration, intercrystal scatter, and other blurring effects in PET detectors. We estimate the elements of B from Fourier-rebinned point source scans using an iterative ML algorithm developed previously,13 which has a form similar to the ML-EM algorithm for emission tomography. Considering the rotational symmetry of cylindrical PET systems, we reference detector pair i by its radial and angular components (ir,iϕ). The update equation for estimating B can then be written as
| (2) |
where yir,iφ,m and gjr,jφ,m are the measured projection and calculated geometric projection of the mth point source, respectively, dφ=jφ−iφ, K is the number of crystals in each detector block, and M is the number of point source positions. This algorithm was derived based on the Poisson likelihood function.13 We note that Fourier-rebinned data do not follow the Poisson distribution, so the result is no longer a ML estimate. However, this loss in statistical efficiency is not critical because the measured point source data have relatively low noise. In addition, the measurements yir,iφ,m have been prenormalized during the Fourier rebinning step, so no further normalization factors are needed.
Each blurring kernel b(ir,k,:,:)∊RNr×Nφ that acts on a particular reference (ir,k) sinogram element is defined and calculated in the sinogram data space. The above equation considers the rotation symmetry only at the detector block level. The measured data yir,iφ,m are sampled at every K angle starting from angle k to estimate the blurring matrix at angle k. The resulting estimated detector response kernel can be viewed as a 4D matrix: The last two indices contain the radial and angular blurring information which act on a particular bin and angle defined by the first two indices. In practice, b(ir,k,:,:) is a locally smoothing operator and the size of the blurring window is reduced from Nr×Nφ (a full 2D sinogram) to ±10 radial bins and ±4 angular bins.
In this work, gi,m were calculated by forward projecting a computer simulated point source using the geometrical projection matrix. To get yi,m, an 18.5 MBq (0.5 mCi) 22Na point source was scanned at 0.5 mm intervals for 3064 different locations inside the microPET II scanner using a 2D high-precision computer-controlled motion stage. The stage was positioned in such a manner as to restrict the 2D motion of the point source to the central axial plane. The scan duration at each location was 60 s, resulting in an average of 22.3×10⁶ detected events. The microPET II scanner has 30 detector blocks per ring and 14×14 crystals per block (K=14), which means that the estimated blurring kernel is rotationally symmetric at every 14 angles. List mode data were histogrammed into sinograms having 140 radial bins (Nr) and 210 azimuthal angles (Nφ), and a span of 3, resulting in 83 direct planes and 1120 oblique planes. The fully 3D PET data were then Fourier rebinned into 2D sinograms (83 planes) using the FOREJ algorithm18 and the blurring kernel estimation algorithm was applied to obtain the sinogram blurring function for Fourier-rebinned sinograms. Special care was given to the gaps between detector blocks during the Fourier rebinning process. The gaps in the sinogram were filled in using linear interpolation along the radial direction prior to Fourier rebinning, and were removed after Fourier rebinning before being introduced to the blurring kernel estimation algorithm to maintain the rotational symmetry at every 14 angles. A 12 h normalization scan was performed prior to the data acquisition to obtain the detector normalization factor ni.
We estimated the sinogram blurring matrix by running the update Eq. 2 for 200 iterations. Figure 1 shows the estimated blurring kernels for ir=71, 43, and 15, and k=1 and k=8. The value of the blurring kernel at each position reflects the probability of mispositioning an event with the corresponding angular and radial offset. In a perfect system with no detector blurring effect, the blurring kernel would be a delta function at (0, 0). Note that ir=71 corresponds to the line of response passing through the center of the field of view. Thus, it has the minimum blurring effect. As the line of response moves away from the center, the blurring effect increases as shown by the increased size and reduced peak value of the blurring kernel. The plots also show that the detector blurring occurs in both radial and angular directions. Results of different k values (only k=1 and k=8 shown here) also confirm that the sinogram blurring effect is dependent on the position of the detector pair inside detector blocks (angular dependence).
Figure 1.
The estimated sinogram blurring kernel for k=8 (top row) and k=1 (bottom row) with ir=15 (left), 43 (center), and 71 (right).
Estimation of the axial blurring matrix
The axial blurring component can be estimated independently from the in-plane (transaxial) sinogram blurring. This axial blurring function models the correlation between neighboring planes due to the detector intrinsic axial blurring and the blurring introduced during the Fourier rebinning step. The former is caused mainly by the intercrystal scatter, crystal penetration, and photon noncollinearity, and is assumed to be independent of axial and radial positions, while the latter is position-dependent. The assumption of shift invariance of the detector intrinsic axial blurring is a reasonable approximation as long as the acceptance angle of the scanner is not too large, which holds true for most animal and clinical scanners currently in use.
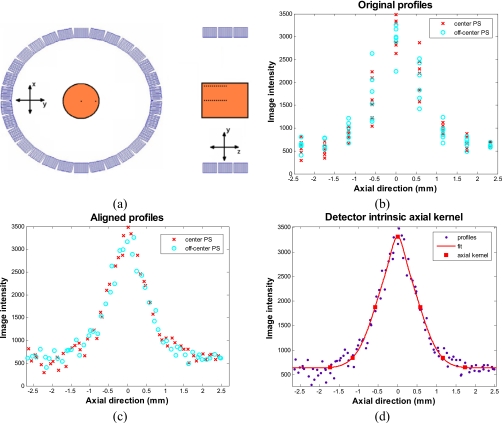
The intrinsic axial function is obtained by taking the axial profiles of images of 22Na point source scans reconstructed by a fully 3D ML reconstruction algorithm (i.e., no FORE effect). The point source sinograms were superimposed on a warm background to avoid the artificial resolution enhancement caused by the non-negativity constraint. The axial profiles should be symmetrical in nature. However, because it is difficult to accurately position the point source at the center of a detector ring, the contribution of the point source to neighboring planes is often asymmetric as shown in Fig. 2b. Our solution to this problem was to acquire a series of point source scans at various axial positions [illustrated in Fig. 2a]. We extracted axial profiles through the center of the point sources in the reconstructed images and fitted each profile with a Gaussian curve. We then used the peak location of the fit to align different axial profiles and combined them into a single up-sampled representative profile shown in Fig. 2c. This new profile was in turn fitted with a sum of two Gaussian curves and resampled at the original axial sampling rate to form the detector intrinsic axial function shown in Fig. 2d. The results also verify that the detector intrinsic axial function is radially independent for the microPET II scanner because the measurements from the point source at the radially center and off-center positions are almost indistinguishable in the plot [Fig. 2c].
Figure 2.
(a) Illustration of the point source positions for axial blurring kernel measurements, which were superimposed on a scan of a cylindrical warm background phantom. (b) Original unaligned profiles through the point sources located at the radially center (crosses) and radially off-center (circles) in the field of view. (c) Aligned profiles obtained by fitting a Gaussian curve to each profile to obtain the peak location. (d) Detector intrinsic axial kernel obtained by re-sampling the fitted curve.
The axial FORE kernel, on the other hand, is position-dependent, and thus requires a series of point source data at different radial and axial positions. To circumvent the need to acquire a large number of point source measurements, the FORE kernel was obtained from simulations as was done by others.21 Sinogram data were obtained by forward projecting simulated images of a point source at different radial and axial positions. The sinograms were then Fourier rebinned and the reconstructed images were used to extract the position-dependent axial FORE function.
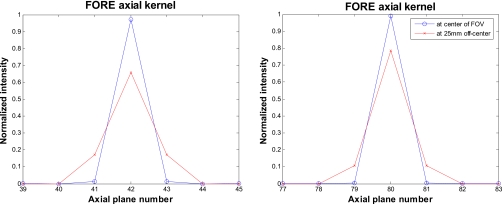
Examples of the position-dependent FORE axial kernel obtained from the simulations are plotted in Fig. 3. The sets of two curves in each plot are the axial kernels at the radial center of the field of view and at a 25 mm radially off-center position. We see an increase in the support size and a reduced peak value of the FORE axial kernel as the radial distance from the center of the field of view increases. The final overall axial blurring kernel is formed by convolving the detector intrinsic axial kernel with the FORE axial kernel.
Figure 3.
Normalized FORE axial kernel for a plane located at the center of the axial field of view (left) and close to the edge of the axial field of view (right). The plane width is 0.58 mm.
Evaluation phantoms and figures of merit
The estimated 2D sinogram blurring kernels (axial blurring kernels ignored first) were incorporated into a 2D MAP reconstruction algorithm.1, 25 The algorithm uses a preconditioned conjugate gradient (PCG) update with a diagonal preconditioner. We performed phantom experiments to compare the proposed method to a 2D MAP algorithm without a detector response model, and 2D MAP with the existing MC-based blurring matrix. The MC-based blurring matrix models photon pair noncollinearity, crystal penetration, and intercrystal scatter, but does not include any axial blurring or FORE-related effects. The MC-based model also ignored blurring effect caused by detector readout electronics. All phantom data were Fourier rebinned first using the FORE algorithm with John’s equation18 and then reconstructed using the three methods independently. Furthermore, the 1D axial blurring function is also integrated into the MAP algorithm and a comparison is made between the 2D MAP reconstruction of FORE data with and without the axial kernel. All reconstructions were performed with β=0 (equivalent to ML) and with various number of iterations to evaluate the convergence property.
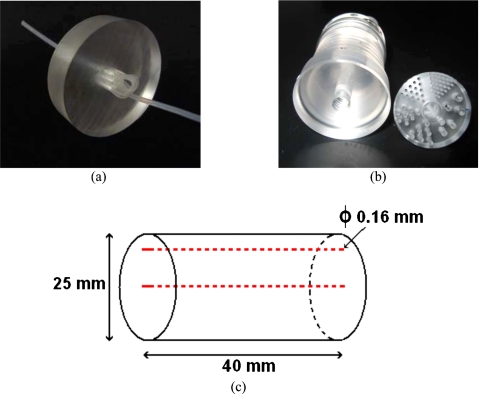
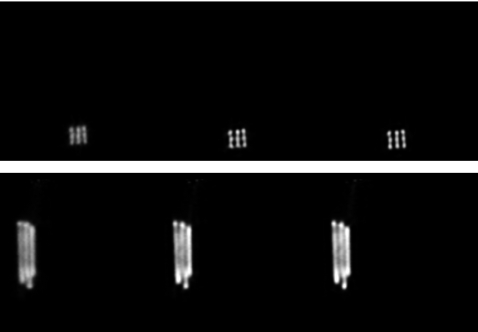
Three physical phantoms are used. The first phantom is a 3×3 line phantom [Fig. 4a] made by a plastic tube. The phantom was filled with 3.7 MBq (100 μCi) of 18F and scanned at 2 cm radial offset from the center of the field of view (FOV) for 20 min. The second phantom is an ultramicro hot spot phantom™ [Fig. 4b], which was filled with 11.1 MBq (300 μCi) of 18F and scanned at 1.5 cm radial offset from the center for 30 min. The third phantom is a cylindrical phantom with two 30 gauge line sources [inner diameter of 160 μm, shown in Fig. 4c] filled with 14.8 MBq (400 μCi) of 18F, resulting in a concentration of 20 μCi∕cc in the background and about 4 mCi∕cc inside the line sources. This phantom was scanned for 20 min at two positions. In position A, the phantom is placed along the axial direction of the scanner (line sources parallel to the z-direction) while it is rotated to form a small angle with respect to the transaxial plane in position B. The first three data sets were used to evaluate the transaxial blurring kernel, while the last data set (dual-line source in position B) is used to study the axial blurring kernel.
Figure 4.
The physical phantoms used in the evaluation study. (a) A 3×3 line phantom. The inner diameter of the tube is about 0.6 mm and the center-to-center spacing between the lines is about 2 mm. (b) The ultramicro hot spot phantom with hot spot diameters of 2.4, 2, 1.7, 1.35, 1, and 0.75 mm. The spacing between line channels is twice the diameter. (c) The dual-line source phantom. The inner diameter of the line sources is 160 μm.
Line profiles were drawn along the radial directions through hot spots of the first two phantoms to compare the reconstruction results. We calculated a contrast coefficient defined as
| (3) |
where pk and vk represent the values of the kth peak and valley in the line profile, respectively, and Nv is the number of valleys. A sum of two Gaussian function was fitted to the profiles and the corresponding full width at half maximum (FWHM) was extracted to compare the resolution across different reconstruction methods. For the phantom with the two line sources, the axial planes were summed for position A to collapse the line sources into point sources and radial profiles were extracted through each of the point sources. The axial profile was extracted from the phantom at position B in a manner reminiscent of that used by Boone et al.26 Since the line sources were scanned at an angle, we obtained the slope of the line sources by a least-squares fit. This slope determines the center location of the axial profile at each plane, which was used to align all the axial profiles into one up-sampled profile [similar to the one shown in Fig. 2c] for measuring contrast and resolution. The noise was estimated by computing the standard deviation of a large uniform area within the phantoms away from the high activity regions and then normalized by the means of the region.
RESULTS
Effect of the transaxial blurring kernel
The 3×3 line phantom
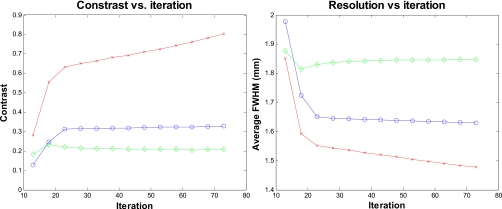
Figure 5 shows the reconstructed images of the 3×3 line phantom with the 2D MAP PCG algorithm (18 iterations) using no detector response model, the existing MC-based blurring matrix, and the newly estimated transaxial blurring matrix, respectively. The contrast and resolution versus iteration plots are shown in Fig. 6. The improvement in contrast with the proposed method at iteration 73 is 144% and 289% over the MAP reconstruction with the existing MC blurring kernel and the one without any transaxial blurring model, respectively. The resolution is characterized by the average FWHM of the three line sources. The MAP reconstruction using the proposed blurring kernel results in an average FWHM of 1.48 mm, while the corresponding resolutions obtained by the MC-based kernel and no blurring modeling are 1.63 and 1.85 mm, respectively. Note that these values are worse than the intrinsic resolution of the microPET II scanner because we did not deconvolve the physical size of the line sources. Also, we observe that the spatial resolution of the line sources in Fig. 5 is anisotropic for all reconstruction methods, such that the radial resolution is worse than the tangential one. This is due to the fact that the majority of the in-plane blurring tends to radially blur events from the edge of the field of view toward the center of the field of view as a result of crystal penetration. Since it is difficult to have a complete recovery of the resolution, some radial blurring persists in the reconstructed images.
Figure 5.
The reconstructed images of the 3×3 phantom placed at 2 cm radial offset. Left: MAP reconstruction with no detector response model. Center: MAP reconstruction using the Monte Carlo based blurring matrix. Right: MAP reconstruction using the new blurring matrix. Top row: Transaxial views; bottom row: Sagittal views through the center column.
Figure 6.
Figures of merit for the 3×3 phantom located 2 cm away from the center of FOV. Left: Contrast versus iteration curves. Right: Resolution (FWHM) versus iteration curves. Diamonds: MAP reconstruction with no detector response model; circles: MAP reconstruction with Monte Carlo based blurring matrix; crosses: MAP reconstruction with the new blurring matrix.
The ultramicro hot spot phantom
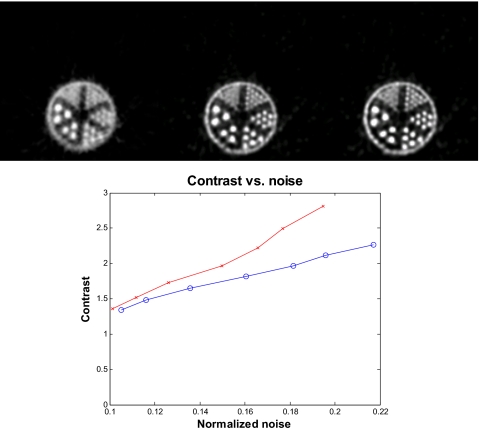
Reconstructed images of the ultramicro hot spot phantom are shown in Fig. 7 (top row). The MAP reconstructions which model the blurring effects result in images that are of higher quality than the MAP reconstruction without any blur modeling. The figures of merit reported for this phantom focus on the 1 mm pie of the phantom (upper right section). The case with no blurring model was not included in the quantitative comparison since the corresponding reconstructed images were unable to resolve the 1 mm section. The contrast versus noise curves are plotted in Fig. 7 (bottom row). It shows that at a similar noise level (around 20% noise mark), the new estimated blurring kernel improved the contrast by 33% over the MC-based blurring kernel.
Figure 7.
Top row: The reconstructed images of the ultramicro resolution phantom. Left: MAP with no detector response model. Center: MAP reconstruction using the Monte Carlo based blurring matrix. Right: MAP reconstruction using the new blurring matrix. Bottom row: Contrast versus normalized noise for the ultramicro hot spot phantom. Circles: MAP reconstruction with Monte Carlo based blurring matrix; crosses: MAP reconstruction with the new blurring matrix.
The dual-line source phantom with warm background (position A)
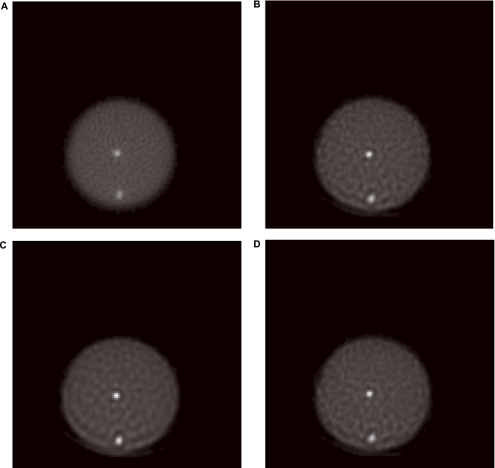
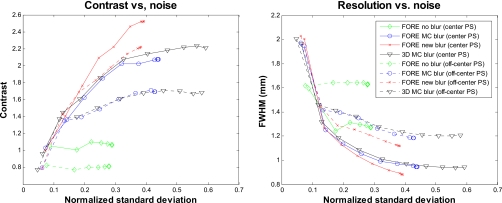
Figure 8 shows the summed images of the dual-line source phantom with warm background (position A) for all FORE reconstruction methods. For comparison, we also included in Fig. 8 the fully 3D reconstruction using the MAP with the MC-based transaxial blurring kernel. The corresponding contrast and resolution versus noise curves are shown in Fig. 9. Here, again, the proposed blurring kernel results in higher contrast and better resolution when compared to the other two MAP reconstruction results. When the line source is located close to the center of the field of view, the enhanced contrast obtained with the new blurring kernel translates into a 136% and 21% improvement over the case with no blurring kernel and the case with the MC kernel, respectively. This improvement becomes 173% and 31% when the line source is located off-center in the field of view. The improvement in resolution is 30.5% and 7% over the no-blur case and MC-blur case, respectively, for the center line source, while it is 31% and 6%, respectively, for the off-center line source. These percent improvements are obtained from the end point of each curve in Fig. 9. In addition, we observed little difference between the 2D MAP reconstruction of FORE data and 3D MAP reconstruction of 3D data using the same MC blurring kernel for this data set, indicating that the reconstruction of FORE data with a sinogram blurring kernel is a fast alternative to fully 3D reconstruction. Moreover, we found that the contrast and resolution obtained in the FORE reconstruction with the estimated blurring kernel are better than those obtained in the 3D reconstruction using MC blurring kernel. This could be attributed to the fact that the MC blurring kernel is an in-plane 2D kernel geared toward the direct (nonoblique) planes. When used in 3D reconstruction, the same kernel is applied to all planes, some of which (the oblique planes) they may be ill-suited for. With the estimated blurring kernel, we observe a decrease in the difference in resolution at the center and off-center point source when compared to the case where no blurring kernel was used. Quantitatively, the difference between the off-center and center resolution for the no-blur case is 1.629−1.269=0.36 mm, while it is only 1.118−0.882=0.236 mm for the proposed method.
Figure 8.
The reconstructed images of the dual-line source phantom with warm background. (a) MAP reconstruction with no detector response model. (b) MAP reconstruction using the Monte Carlo based blurring matrix. (c) MAP reconstruction using the new blurring matrix. (d) Fully 3D MAP reconstruction using the Monte Carlo based blurring matrix.
Figure 9.
Contrast versus normalized noise (left) and resolution versus normalized noise (right) curves for the dual-line source phantom with warm background at position A. The legends are shown in right figure only.
Effect of the axial blurring kernel
The dual-line source phantom with warm background (position B)
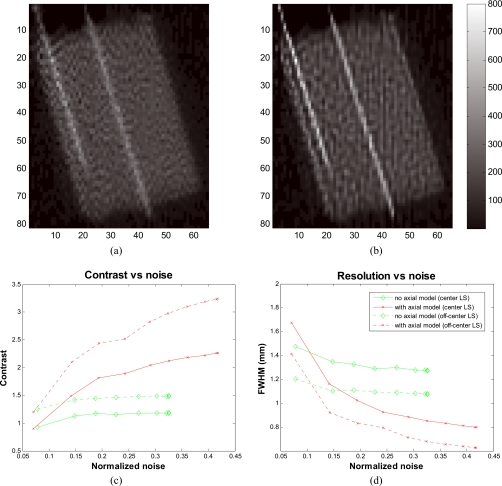
The coronal views of the reconstructed images of the dual-line source phantom at position B are shown in Fig. 10 (top row) for the cases with and without axial kernel modeling. The corresponding contrast and resolution versus noise curves are plotted in Fig. 10 (bottom row). It is important to note that at this phantom position, the labeling of the line sources as being at the center of the phantom in Fig. 10 does not signify that the line source is located at the center of the field of view, since the phantom is at an angle and both line sources will span a wide range of radial distances from the center of the field of view. The axial kernel appears to visually sharpen the line sources as well as increase their contrast. Quantitatively, it results in an increase in contrast by 92% and 118% over the case when the axial kernel was not used in the reconstruction for the center and off-center line sources, respectively. The gain in contrast is accompanied by a resolution enhancement of 37.5% and 42% for the center and off-center line sources, respectively. The off-center line source has better resolution than the center line source because of the nature of Poisson noise.27 There is a noticeable undershoot at the edges of the line sources of Fig. 10b. This undershoot is about 6.5% of the peak on average for the center line source and increases to about 12% for the off-center line source. This increase in undershoot is asymmetrical and is more severe on the side of the line source closer to the edge of the phantom, which is caused by the superposition of the undershoots from the off-center line source and that from the sharp edge of the phantom. There is also some change in noise pattern in the background in Fig. 10b when compared to Fig. 10a, which reflects a change in noise correlation because both images were taken at matched standard deviation levels (iteration 100 and 60 for the case without and with axial modeling, respectively).
Figure 10.
Top row: Coronal view of the reconstructed images of the dual-line source phantom with warm background at position B. (a) MAP reconstruction with no axial blurring model. (b) MAP reconstruction with the estimated axial blurring kernel. Bottom row: Figures of merit for the dual-line source phantom with warm background at position B. (c) Contrast versus normalized noise curves. (d) Resolution versus normalized noise curves.
DISCUSSION
The results show that modeling the detector response function is important in image reconstruction for PET. The estimated 2D transaxial blurring matrix produces higher contrast and improved resolution compared to the existing Monte Carlo based blurring matrix. Similarly, the estimated axial kernel also yields reconstructed images with better contrast and resolution compared with the case without any axial blurring modeling.
In this study, we use the ML-EM algorithm to estimate the transaxial sinogram blurring matrix from Fourier-rebinned point source data. No regularization was applied because the point source measurements are of high counting statistics and the noise in the point source measurements are far less than that in a normal scan. The algorithm was run for 200 iterations to get a good fit of the data. The blurring kernel estimation was run in parallel on a PC cluster because each blurring kernel can be estimated independently. The estimation took about 140 s per blurring kernel on a single 2 GHz CPU and 1 h for all 994 blurring kernels on a 40 CPU cluster. Since this is a one-time computation, the computational time is not an issue. The same sinogram blurring matrix can be used with different geometric projection matrices for reconstructions using different image voxel size, which is one advantage of the factored system matrix. Another advantage of the factored system matrix is its computational efficiency because the system matrix retains the sparsity of the geometric projection matrix, for which forward and back projections can be efficiently calculated. The computation cost of the sinogram blurring operation is insignificant compared to geometric forward and back projections. Thus, the new blurring kernels, while having slightly larger support than the Monte Carlo based blurring kernels, do not affect the total image reconstruction time.
When a PET scanner is operated in 2D or when PET data are rebinned into 2D sinograms, the axial blurring effects can be obtained separately from the transaxial blurring kernel. On the other hand, for fully 3D PET data, the axial and in-plane blurring effects are correlated with each other for oblique sinograms and thus should be estimated simultaneously.
We note that Fourier-rebinned PET data no longer follow Poisson distribution because of the precorrections for attenuation, randoms, scatters, dead time, and detector efficiency, as well as linear interpolations used in the rebinning procedure. In this paper, we focus on studying the effect of sinogram blurring kernels. While the MAP reconstruction algorithm was derived based on Poisson statistics, the loss in statistical efficiency when applying to non-Poisson data should not affect the relative performance between different sinogram blurring models. To improve statistical efficiency, the estimated blurring kernels can be incorporated into other reconstruction algorithms, such as the one proposed by Alessio et al.,28 that use a more appropriate statistical model for Fourier-rebinned data.
CONCLUSION
We have presented a method for estimating the transaxial and axial blurring components of the system matrix for iterative image reconstruction of Fourier-rebinned 2D PET data. The method has been validated using the small animal microPET II scanner. The proposed method models sinogram blurring effects along the radial and angular directions, as well as the correlations between neighboring planes in the axial direction. The in-plane blurring function explicitly takes into account the block structure of the detectors. Phantom experiments show that the proposed method provides superior results in terms of resolution and contrast with no noticeable additional cost in reconstruction time when compared to MAP reconstruction using the existing Monte Carlo based blurring matrix. The proposed method is applicable to other PET scanners for human and animal imaging.
ACKNOWLEDGMENTS
The authors would like to thank Dr. Christian Michel at Siemens Medical Solutions and Dr. Michel Defrise at V.U. Brussels for providing the FOREJ software, Dr. Ronald H. Huesman at Lawrence Berkeley National Laboratory for sharing the list-mode histogramming software, and Dr. Stefan B. Siegel at Siemens Preclinical System and Dr. Bing Bai at Columbia University for their help on list-mode data format and MAP reconstruction software. The authors would also like to acknowledge the staff of the Center for Molecular and Genomic Imaging (CMGI) at UC Davis for their assistance in the data collection and Dr. Yongfeng Yang and Dr. Jennifer Stickel for sharing the phantoms. This work is supported by NIH under Grant No. R01EB005322.
References
- Qi J., Leahy R., Cherry S. R., Chatziioannou A., and Farquhar T., “High-resolution 3-D Bayesian image reconstruction using the microPET small-animal scanner,” Phys. Med. Biol. 43, 1001–1013 (1998). 10.1088/0031-9155/43/4/027 [DOI] [PubMed] [Google Scholar]
- Alessio A., Kinahan P., and Lewellen T., “Modeling and incorporating of system response functions in 3-D whole body PET,” IEEE Trans. Med. Imaging 25, 828–837 (2006). 10.1109/TMI.2006.873222 [DOI] [PubMed] [Google Scholar]
- Frese T., Rouze N., Bouman C., Sauer K., and Hutchins G., “Quantitative comparison of FBP, EM, and Bayesian reconstruction algorithm for the IndyPET scanner,” IEEE Trans. Med. Imaging 22, 258–276 (2003). 10.1109/TMI.2002.808353 [DOI] [PubMed] [Google Scholar]
- Selivanov V., Picard Y., Cadorette J., Rodrigue S., and Lecomte R., “Detector response models for statistical iterative image reconstruction in high resolution PET,” IEEE Trans. Nucl. Sci. 47, 1168–1175 (2000). 10.1109/23.856565 [DOI] [Google Scholar]
- Panin V., Rothfuss H., Hu D., Michel C., and Casey M., “Fully 3-D PET reconstruction with system matrix derived from point source measurements,” IEEE Trans. Med. Imaging 25, 907–921 (2006). 10.1109/TMI.2006.876171 [DOI] [PubMed] [Google Scholar]
- Mumcuoglu E. U., Leahy R., Cherry S. R., and Hoffman E., “Accurate geometric and physical response modeling for statistical image reconstruction in high resolution PET,” in IEEE Nuclear Science Symposium Conference Record, Anaheim, CA, 1996, pp. 1569–1573.
- Lee K., Kinahan P. E., Fessler J. A., Miyaoka R. S., Janes M., and Lewellen T. K., “Pragmatic fully 3D image reconstruction for the MiCES mouse imaging PET scanner,” Phys. Med. Biol. 49(19), 4563–4579 (2004). 10.1088/0031-9155/49/19/008 [DOI] [PubMed] [Google Scholar]
- Strul D., Slates R. B., Dahlbom M., Cherry S. R., and Marsden P. K., “An improved analytical detector response function model for multilayer small-diameter PET scanners,” Phys. Med. Biol. 48(8), 979–994 (2003). 10.1088/0031-9155/48/8/302 [DOI] [PubMed] [Google Scholar]
- Scheins J., Boschen F., and Herzog H., “Analytical calculation of volumes-of-intersection for iterative, fully 3-D PET reconstruction,” IEEE Trans. Med. Imaging 25(10), 1363–1369 (2006). 10.1109/TMI.2006.880679 [DOI] [PubMed] [Google Scholar]
- Rahmim A., Tang J., Lodge M., Lashkari S., Ay M., Lautamaki R., Tsui B., and Bengel F., “Analytic system matrix resolution modeling in PET: An application to Rb-82 cardiac imaging,” Phys. Med. Biol. 53(21), 5947–5965 (2008). 10.1088/0031-9155/53/21/004 [DOI] [PMC free article] [PubMed] [Google Scholar]
- Alessio A., Kinahan P. E., Harrison R., and Lewellen T., “Measured spatially variant system response for PET image reconstruction,” in IEEE Nuclear Science Symposium Conference Record, 2005, Vol. 4, pp. 23–29.
- Rafecas M., Mosler B., Dietz M., Pögl M., Stamatakis A., McElroy D. P., and Ziegler S. I., “Use of a Monte-Carlo based probability matrix for 3-D iterative reconstruction of MADPET-II data,” IEEE Trans. Nucl. Sci. 51(5), 2597–2605 (2004). 10.1109/TNS.2004.834827 [DOI] [Google Scholar]
- Tohme M. and Qi J., “Iterative image reconstruction for positron emission tomography based on a detector response function estimated from point source measurements,” Phys. Med. Biol. 54, 3709–3725 (2009). 10.1088/0031-9155/54/12/007 [DOI] [PMC free article] [PubMed] [Google Scholar]
- Tohme M. S. and Qi J., “High-resolution image reconstruction for PET using estimated detector response functions,” Proc. SPIE 6498, 649819 (2007). 10.1117/12.716739 [DOI] [Google Scholar]
- Beekman F., Slijpen E., de Jong H., and Viergever M., “Estimation of the depth-dependent component of the point spread function of SPECT,” Med. Phys. 26(11), 2311–2322 (1999). 10.1118/1.598745 [DOI] [PubMed] [Google Scholar]
- Defrise M., Kinahan P. E., Townsend D., Michel C., Sibomana M., and Newport D., “Exact and approximate rebinning algorithms for 3-D PET data,” IEEE Trans. Med. Imaging 16(2), 145–158 (1997). 10.1109/42.563660 [DOI] [PubMed] [Google Scholar]
- Vollmar S., Michel C., Treffert J. T., Newport D., Casey M., Knoss C., Wienhard K., Liu X., Defrise M., and Heiss W., “Heinzel cluster: Accelerated reconstruction for FORE and OSEM3D,” Phys. Med. Biol. 47, 2651–2658 (2002). [DOI] [PubMed] [Google Scholar]
- Defrise M. and Liu X., “A fast rebinning algorithm for 3D PET using John’s equation,” Inverse Probl. 15, 1047–1065 (1999). 10.1088/0266-5611/15/4/314 [DOI] [Google Scholar]
- Daube-Witherspoon M. and Muehllehner G., “Treatment of axial data in 3D PET,” J. Nucl. Med. 28, 1717–1724 (1987). [PubMed] [Google Scholar]
- Liu X., Defrise M., Michel C., Sibomana M., Comcat C., Kinahan P. E., and Townsend D., “Exact rebinning methods for three-dimensional PET,” IEEE Trans. Med. Imaging 18, 657–664 (1999). 10.1109/42.796279 [DOI] [PubMed] [Google Scholar]
- Alessio A., Sauer K., and Kinahan P., “Analytical reconstruction of deconvolved Fourier rebinned PET sinograms,” Phys. Med. Biol. 51(1), 77–93 (2006). 10.1088/0031-9155/51/1/006 [DOI] [PubMed] [Google Scholar]
- Comtat C., Kinahan P. E., Defrise M., Michel C., and Townsend D., “Fast reconstruction of 3D PET data with accurate statistical modeling,” IEEE Trans. Nucl. Sci. 45, 1083–1089 (1998). 10.1109/23.681983 [DOI] [Google Scholar]
- Fessler J. A., “Penalized weighted least-squares image reconstruction for positron emission tomography,” IEEE Trans. Med. Imaging 13(2), 290–300 (1994). 10.1109/42.293921 [DOI] [PubMed] [Google Scholar]
- Tai Y. et al. , “MicroPET II: Design, development and initial performance of an improved microPET scanner for small-animal imaging,” Phys. Med. Biol. 48(11), 1519–1537 (2003). 10.1088/0031-9155/48/11/303 [DOI] [PubMed] [Google Scholar]
- Bai B., Smith A., Newport D., and Leahy R., “On the effect of modeling block detector structure in small animal PET scanners,” presented at the Nuclear Science Symposium and Medical Imaging Conference, Rome, Italy, 2004.
- Boone J., “Determination of the presampled MTF in computed tomography,” Med. Phys. 28(3), 356–360 (2001). 10.1118/1.1350438 [DOI] [PubMed] [Google Scholar]
- Fessler J. A. and Rogers W. L., “Spatial resolution properties of penalized-likelihood image reconstruction: Space-invariant tomographs,” IEEE Trans. Image Processing 5, 1346–1358 (1996). [DOI] [PubMed] [Google Scholar]
- Alessio A., Sauer K., and Bouman C., “MAP reconstruction from spatially correlated PET data,” IEEE Trans. Nucl. Sci. 50(5), 1445–1451 (2003). 10.1109/TNS.2003.817943 [DOI] [Google Scholar]


