Abstract
Purpose: As the practice of using high-energy photon beams to create therapeutic radiation fields of subcentimeter dimensions (as in intensity-modulated radiotherapy or stereotactic radiosurgery) grows, so too does the need for accurate verification of beam output at these small fields in which standard practices of dose verification break down. This study investigates small-field output factors measured using a small plastic scintillation detector (PSD), as well as a 0.01 cm3 ionization chamber. Specifically, output factors were measured with both detectors using small fields that were defined by either the X-Y collimator jaws or the multileaf collimator (MLC).
Methods: A PSD of 0.5 mm diameter and 2 mm length was irradiated with 6 and 18 MV linac beams. The PSD was positioned vertically at a source-to-axis distance of 100 cm, at 10 cm depth in a water phantom, and irradiated with fields ranging in size from 0.5×0.5 to 10×10 cm2. The field sizes were defined either by the collimator jaws alone or by a MLC alone. The MLC fields were constructed in two ways: with the closed leaves (i.e., those leaves that were not opened to define the square field) meeting at either the field center line or at a 4 cm offset from the center line. Scintillation light was recorded using a CCD camera and an estimation of error in the median-filtered signals was made using the bootstrapping technique. Measurements were made using a CC01 ionization chamber under conditions identical to those used for the PSD.
Results: Output factors measured by the PSD showed close agreement with those measured using the ionization chamber for field sizes of 2.0×2.0 cm2 and above. At smaller field sizes, the PSD obtained output factors as much as 15% higher than those found using the ionization chamber by 0.6×0.6 cm2 jaw-defined fields. Output factors measured with no offset of the closed MLC leaves were as much as 20% higher than those measured using a 4 cm leaf offset.
Conclusions: The authors’ results suggest that PSDs provide a useful and possibly superior alternative to existing dosimetry systems for small fields, as they are inherently less susceptible to volume-averaging and perturbation effects than larger, air-filled ionization chambers. Therefore, PSDs may provide more accurate small-field output factor determination, regardless of the collimation mechanism.
Keywords: plastic scintillation detectors, small-field dosimetry, output factors, small MLC fields
INTRODUCTION
Several current modern radiotherapy techniques are foregoing traditional treatment field sizes for smaller and smaller fields that better target tumor volumes and spare normal tissues. Various external-beam delivery systems rely on fields smaller than 3×3 cm2, including sealed-source stereotactic radiosurgery devices that can produce therapeutic 60Co beams using apertures as small as 4 mm in diameter.1 Certain forms of intensity-modulated radiotherapy (IMRT), including the various arc therapy modalities,2, 3 use high-resolution multileaf collimators (MLC) capable of producing subcentimeter field sizes. Even standard clinical IMRT machines routinely produce small beamlets using standard-resolution MLCs; alternatively, they may be fitted with a dynamic micro-MLC in order to perform intensity-modulated stereotactic radiosurgery.4
However, with the advent of these new techniques come new problems for performing direct, accurate dosimetry measurements of small radiation fields. Discrepancies have been reported between doses predicted by treatment planning systems and those measured in patients or phantoms,5, 6, 7, 8 and sophisticated Monte Carlo codes have been used to calculate the dose properties of small fields in lieu of direct measurements, which may be too difficult to perform with typical detectors.8, 9, 10, 11 Moreover, the rapid advance of small-field radiotherapy technology has precipitated a decrease in the relevance of well-established standards of practice with respect to reference dosimetry. For example, the methods proposed in documents such as the American Association of Medical Physicists Task Group 51 (AAPM TG-51) (Ref. 12) report may not be applicable to certain small-field machines. In light of this, there are ongoing efforts to determine a uniform formalism for small-field reference dosimetry. Alfonso et al.13 suggested using two intermediate calibration fields to extend existing recommendations and grant new small-beam delivery techniques access to traceable dosimetry references.
A recent report by Das et al.14 provided a thorough review of the various problems associated with small-field dosimetry, as well as suggestions for possible solutions. Among the problems discussed were the loss of charged-particle equilibrium as the field sizes approach that of the lateral secondary electron range; the lack of a practical, small-volume dosimeter that does not suffer from energy, dose, or dose-rate dependence or perturbation effects; beam output variations due to the use of different collimation devices (X-Y collimator jaws or a MLC) to produce identical field sizes; and a lack of consensus on the very definition of “small” when used to describe radiation fields. Understandably, the authors list “better detectors” among their proposed solutions to improve the accuracy of small-field dosimetry, stating that “small-volume detectors (ion chambers, diodes, and others) will be developed that have minimum perturbations due to its (sic) presence and composition. Also, such detectors will have minimum energy, dose, and dose-rate dependence.”14 Plastic scintillators fit this description well, as they possess close water equivalence (i.e., are nonperturbing) when compared to other small-volume detectors such as small air-filled ion chambers, diodes, and metal-oxide-semiconductor field-effect transistors (MOSFETs); can be made with smaller volumes than ionization chambers (providing high spatial resolution); respond linearly with dose; and are practically energy and dose-rate independent over the range of energies used in radiotherapy.15, 16, 17, 18, 19, 20, 21
Plastic scintillation dosimetry in the setting of small-field irradiation has been studied by several investigators using a variety of systems.22, 23, 24, 25 However, no close examination has been made of the dependence of the measurement of output factors on the way in which the small fields are defined. The aim of the study reported here was to explore this dependence using plastic scintillation dosimetry and the field-defining mechanisms associated with a clinical IMRT linac and to expand the body of knowledge concerning the viability of plastic scintillators for accurately measuring small radiation fields. Presented are the results of using a small-volume scintillating fiber to measure output factors of clinically relevant high-energy (6 and 18 MV) photon beams in comparison with those obtained with a 0.01 cm3 ionization chamber under identical conditions for small-field sizes. Also presented are results of investigations into the effects of using the linac’s collimator jaws or the MLC to form the field and of changing the MLC leaf configuration on output factors at a given field size, using both the plastic scintillation dosimetry system and the ionization chamber.
EXPERIMENTAL DETAILS
Radiation source and field definitions
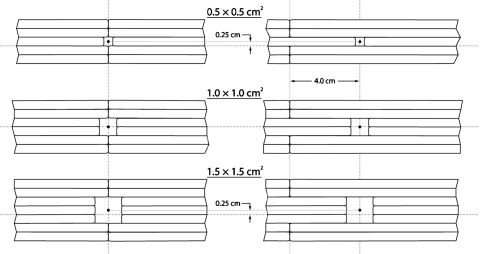
All measurements presented in this communication were made at the Ambulatory Clinical Building of The University of Texas M. D. Anderson Cancer Center. A Varian Medical Systems (Palo Alto, CA) Clinac 21EX equipped with a Millennium 120 MLC was used to deliver photons with energies of 6 and 18 MV at a dose rate of 400 MU∕min. Beam field sizes were defined using three configurations. In one configuration, the fields were defined using the X-Y collimator jaws alone, with the MLC leaves retracted to their maximum (>40×40 cm2) in order to minimize their influence. The collimator jaws defined square fields with side lengths of 0.6, 0.8, 1.0, 1.2, 1.5, 2.0, 2.5, 3.0, 4.0, 5.0, 6.0, 8.0, and 10.0 cm. The other two field definitions used the MLC alone, with collimator jaws set to 20×20 cm2. One MLC configuration positioned the closed leaves (i.e., those leaves that were not opened to define the square field) so that they met at the center line, coincident with the crosshairs of the light field; the other MLC configuration held the closed leaves at a 4 cm offset from the center line (Fig. 1). The former MLC setup is henceforth called the MLC-0 setup; likewise, the latter MLC setup is referred to as MLC-4. In both configurations, the MLC was used to define square fields with side lengths equal to 0.5, 1.0, 1.5, 2.0, 2.5, 3.0, 4.0, 5.0, 6.0, 8.0, and 10.0 cm. It is important to note some details regarding some of the smaller MLC-defined fields. The projections of the individual MLC leaves, in the plane perpendicular to the beam direction, are 0.5 cm wide at a source-to-axis distance of 100 cm. This restricted the side lengths of the square fields to multiples of 0.5 cm. Furthermore, the 0.5×0.5 cm2 MLC-defined field was produced by closing all leaves except for two of the centermost opposing leaves, each of which was opened 0.25 cm from center. The lateral light field crosshairs coincided with the abutment of the centermost MLC leaves, so the center of the beam (and subsequently the detector position) was shifted 0.25 cm superiorly for the 0.5×0.5, 1.5×1.5, and 2.5×2.5 cm2 MLC-defined fields. Figure 1 shows a diagrammatic representation of this field shift for the 0.5×0.5 and 1.5×1.5 cm2 fields, as compared to a 1.0×1.0 cm2 field.
Figure 1.
Diagram depicting the three smallest fields defined by the MLC using closed leaves meeting at the center line (left) and at a 4 cm offset from the center line (right). Also shown is the 0.25 cm superior shift in field center from lateral light field crosshairs due to defining noninteger field sizes with the 5 mm wide MLC leaves. Dashed lines represent the position of the light field crosshairs for each field configuration.
Detectors
The scintillation dosimetry system used in this study is based on that developed and described previously by Archambault et al.26 The main components of this system are a SCSF-3HF multiclad scintillating fiber (Kuraray Co., Ltd., Tokyo,Japan) with a polystyrene core having a scintillation emission peak centered at 530 nm, a diameter of 0.5 mm, and a length of 2 mm; an 8 m length of 0.5 mm diameter ESKA plastic optical fiber protected by a black polyethylene jacket (Mitsubishi Corporation, Tokyo, Japan); an optical setup allowing for spectral discrimination, consisting of a dichroic mirror (model NT47–950, Edmund Optics Inc., Barrington, NJ); and three standard mirrors; and a Luca electron multiplying charge-coupled device (CCD) camera (Andor Technology, Belfast, Northern Ireland). The scintillating fiber was coupled to the distal end of the optical fiber, forming a plastic scintillation detector (PSD). A graphite cap with an outer diameter of ∼2 mm and length of 2 cm was placed over the distal end of the PSD assembly to ensure light-tightness and to provide a nonperturbing support for positioning the vertically while eliminating flexure in the optical fiber. The proximal end of the PSD was positioned such that its light output could be imaged by the CCD camera through the optical setup. The optical setup was optimized between the jaw-defined and MLC-defined field measurements in order to increase the scintillation signal level.
Ionization chamber measurements were made using a CC01 chamber from IBA Dosimetry America (Bartlett, TN) connected to a model 206 electrometer from CNMC Instruments Inc. (Nashville,TN). The ionization chamber has an active volume of 0.01 cm3, with a length of 3.6 mm, an outer electrode made of air-equivalent plastic (C-552) with a diameter of 2 mm, and a steel inner electrode 2.8 mm long.
Measurement setup
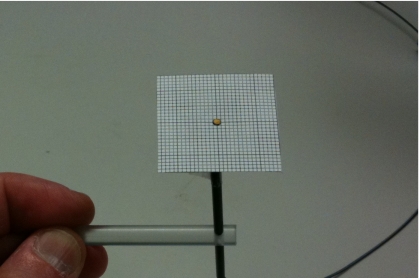
High-energy photon beams were directed vertically down into a 40×40×40 cm3box water phantom (CNMC Instruments) equipped with a vertical translation stage centered on one wall. The detectors were attached to this stage by means of acrylic holders so that they were fixed in a vertical alignment under the treatment head of the linac. The PSD was positioned at beam isocenter (source-to-axis distance=100 cm) at a depth of 10 cm in water. In the ionization chamber setup, the point of measurement of the chamber was set at beam isocenter at 10 cm depth in water. In each setup, the detector cables (optical fiber, in the case of the PSD, and electrical wire, in the case of the ionization chamber) were placed so that they trailed down and away from the treatment head. Both detectors were positioned precisely at beam center by using a 3×3 cm2 piece of laminated, 1 mm spacing grid paper for use underwater. This device (Fig. 2) would be placed on the tip of the detectors for positioning underwater using the light field. Positioning consisted of careful alignment of the center of the detector to the light field crosshairs, as well as precise verification of the size of the smaller fields at the detector tip. The device was then carefully removed before measurements were made. Periodically, throughout the experiments of all setups, measurements were made with the MLC parked and the jaws set to 10×10 cm2 to confirm the linac’s stability (data not reported).
Figure 2.
Photograph showing the PSD inserted into an acrylic holder, with the 1 mm spacing grid paper device (used to precisely position the detectors using the light field crosshairs) placed at the tip.
Cerenkov light removal
One of the unavoidable consequences of using optical fiber under irradiation at high energies is the production of Cerenkov light, a type of light that is emitted when a charged particle moves through a transparent medium (e.g., water or certain plastics) faster than the speed of light in that medium. Cerenkov light is emitted in a broad band over which the intensity decreases as a function of wavelength and, in the case of optical fiber, the collection of Cerenkov light is highly dependent on the angle at which the radiation beam is incident to the fiber.27, 28
A technique was developed that uses optical filtration to spectrally segregate the scintillation light and background light output by a single scintillator∕fiber cable.18, 29 The so-called chromatic removal technique involves measuring light from different spectral bands of the multicomponent signal produced by the scintillator and optical fiber. A calibration is then performed to determine the relative contributions of scintillation and Cerenkov light to the resulting signal that is proportional to a measured dose. Thus, Cerenkov light can be effectively removed.19, 29 The chromatic removal technique was used for all measurements discussed below.
Image noise filtration
Because of constraints on the length of the optical fiber cable that were used in these experiments, measurements using the scintillation dosimetry system were performed with the CCD reader system placed in the maze of the linac vault. Though the camera was protected from a direct line of sight to the treatment head, scattered radiation still impinged on the CCD chip during irradiation. In all PSD experiments, a series of five images was taken at each field size and for both energies. These images were considered to represent the results of identical measurements and so the temporal median filtration technique30 was applied to remove transient noise due to stray radiation. This technique produced a single, pristine image containing only signals originating from the scintillating fiber and optical fiber.
Signal measurement and analysis
In order to account for the pixel-to-pixel variation of the CCD, a series of ten background images was taken after the scintillation dosimetry system was set up but with no radiation applied. The images were then filtered using the temporal median value in order to produce a dark-current image to be subtracted from each of the temporal median-filtered signal images. Different regions of interest (ROIs) were drawn onto the background-subtracted images to delineate the portions of the images that contained the signals of interest. Integrating the total intensity from all pixels contained within the ROIs produced the raw PSD signals. The chromatic removal technique requires a calibration against the ionization chamber and electrometer, and thus the dose-proportional values resulting from this technique have the same units as those read from the electrometer. For these measurements, the electrometer was set to report the accumulated charge (in nanocoulombs) collected over each irradiation. Between five and seven measurements were taken with the ionization chamber and electrometer for each field size, configuration, and energy.
Relative output factors were defined as the ratio of the signal measured at field size n×n cm2 (at 10 cm depth in water, using either jaw-defines or MLC-defined fields) to the signal measured at 10 cm depth in water under a 5×5 cm2 field.31 Relative output factors measured using jaw-defined fields were directly compared to those measured using the MLC-0 and MLC-4 configurations. An additional comparison was made between the results obtained using the two MLC configurations by taking the ratio of the signal from the MLC-0 configuration to the signal from the MLC-4 configuration for each field size. This last analysis was designed to test the sensitivity of the two detectors to the positions of the closed leaves.
Error estimation
We used the temporal median image filtration technique for signal processing, as opposed to a mean signal approach, because the median is much less sensitive to far outliers.30 The outliers associated with the measurements discussed here were those pixel values substantially increased by stray radiation incident on the CCD. Such stray radiation events shift the distribution of charge collection events occurring in the pixels away from a typical Poisson distribution. The bootstrapping technique was implemented in order to estimate the error in the median pixel values corresponding to this unknown distribution. Originally developed by Efron,32 bootstrapping builds new sets of data via random resampling with replacement from the original data set. An estimation of the variance in the median of the original sample may be made by Monte Carlo approximation, as follows: First construct some number N of bootstrapped samples; then obtain from these samples N medians ; finally, calculate the estimated variance (, with the subscript MC denoting the use of the Monte Carlo approximation) in from the bootstrapped medians using
| (1) |
where is the mean of the bootstrapped medians.33, 34 This method was applied (using N=1000 bootstrapped samples) to estimate the variance in each pixel’s median for the temporal median-filtered images. A standard deviation estimation for the total integrated median image value was made by summing the standard deviations σMC of all M pixels in quadrature
| (2) |
The above estimations accounted only for the variation inherent in the temporal median filtration of the images. Further error considerations were made by propagating the uncertainty through the background subtraction of the images, the subtraction calculation associated with the chromatic removal technique, and the normalizations necessary to obtain the output factors. Thus, error bars given for the output factors measured by the PSD represent the final standard deviation estimate of the integrated, median-filtered signal after accounting for uncertainty propagation.
RESULTS
Output factors
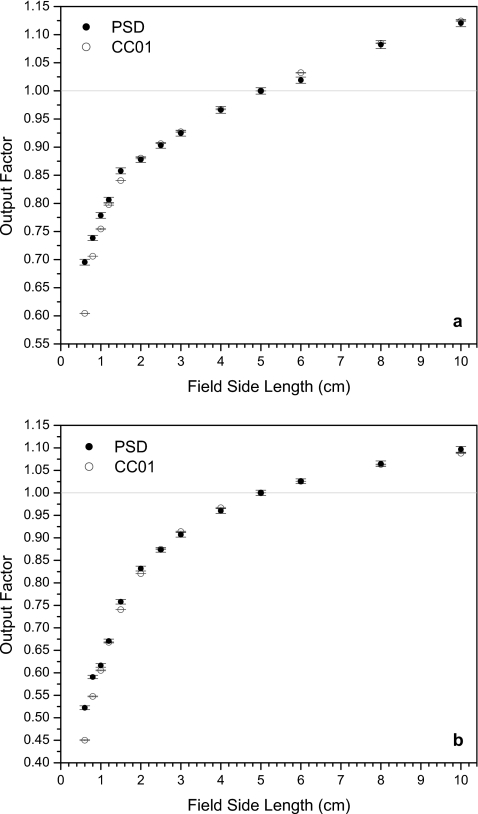
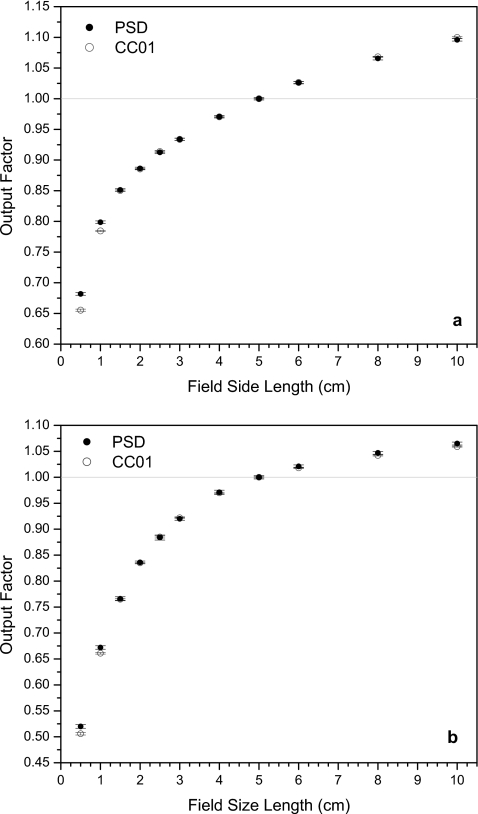
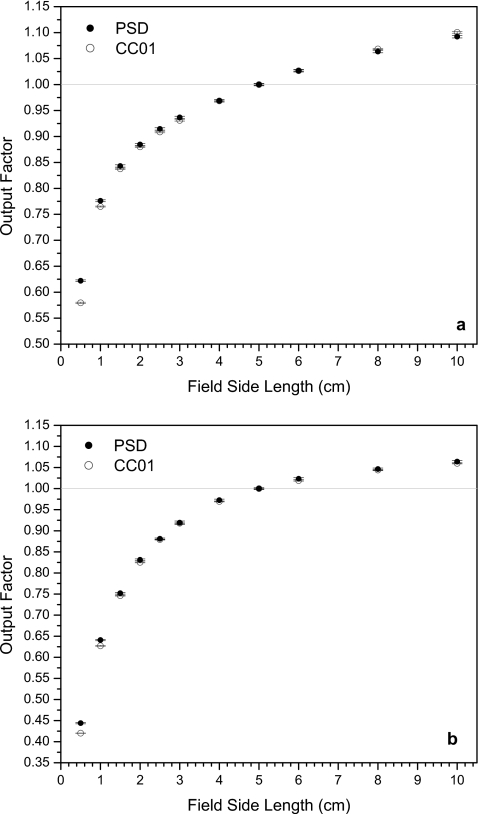
Figures 345 show the output factors obtained using the scintillation system and the ionization chamber. PSD data error bars in the y-direction represent one standard deviation calculated and propagated as described in Sec. 2G. Output factors for the ionization chamber were calculated using the average recorded accumulated charge and the y-direction errors bars represent one standard deviation of these measurements. A fixed uncertainty in the x-direction of 1 mm (error bars not shown) accounts for variations in detector positioning and jaw∕MLC travel.
Figure 3.
Output factors from the PSD and the ionization chamber for (a) 6 and (b) 18 MV photon fields defined by the collimator jaws. (The vertical lines are shown to facilitate visualizing the corresponding side lengths of the fields.)
Figure 4.
Output factors from the PSD and the ionization chamber for (a) 6 and (b) 18 MV photon fields defined by the MLC with closed leaves with zero offset (MLC-0 configuration).
Figure 5.
Output factors from the PSD and the ionization chamber for (a) 6 and (b) 18 MV photon fields defined by the MLC with closed leaves with a 4 cm offset (MLC-4 configuration).
For the square fields defined by the X-Y collimator jaws (Fig. 3), it can be seen that the PSD produces significantly higher output factors than the ionization chamber at the smallest fields. The PSD signal was 15% higher at 0.6×0.6 cm2 for both energies, while at 0.8×0.8 cm2 the PSD signal was 4.5% and 7.8% higher than in the ionization chamber at 6 and 18 MV, respectively. Output factor uncertainty for the PSD ranged from 0.52% to 0.81% for the jaw-defined fields. Uncertainty in the ionization chamber measurements never reached more than 0.22%. Also apparent in Fig. 3 are some small deviations in the PSD data [e.g., at 6×6 cm2 under 6 MV in Fig. 3a] from the ionization chamber data that are larger than the y-error bars. These deviations prompted a redesign of the system’s optical setup to minimize the path length between the fiber optic output and the CCD through the optical setup. Consequently, the CCD was able to detect more light from the PSD for the following MLC-defined field measurements, increasing the ratio of signal to noise.
Figure 4 shows the data obtained for both energies using fields defined by the MLC alone, with no offset of the closed leaves. Here, the PSD data and ionization chamber data at field sizes ≥1.5×1.5 cm2 were in better agreement than for the jaw-defined fields. The PSD system still gave higher output factors than the ionization chamber at the smallest fields, though the discrepancies were smaller than those seen at the smallest fields in Fig. 3. The output factors reported by the PSD system under a 0.5×0.5 cm2 field were 4.1% and 2.8% higher than those reported by the ionization chamber for 6 and 18 MV beams, respectively. For the 1.0×1.0 cm2 field, the PSD output factors were 1.8% higher at 6 MV and 1.7% higher at 18 MV. The error in the output factors for these measurements ranged between 0.19% and 0.48%, with higher error found in the 18 MV data because of the greater amount of scattered radiation incident on the CCD during irradiation at this energy.
Output factors measured using the MLC-4 setup can be seen in Fig. 5. At 6 MV, the PSD gave output factors 7.3% and 1.5% higher than the ionization chamber for 0.5×0.5 and 1.0×1.0 cm2 fields, respectively. At 18 MV, the respective increases were 5.7% and 2.2% for these two smallest fields. The error bars for these data are very similar to those seen using the MLC-0 setup, ranging from 0.21% to 0.43%.
Verification of error estimation
As the analysis of the PSD data progressed, a question arose regarding the validity of the error estimations obtained using the bootstrapping technique. As a result, a simple test was conducted to verify that the bootstrapping error estimation method was producing realistic standard deviation estimations for the PSD data. A set of 20 images obtained using a 10×10 cm2 jaw-defined field, taken with 6 MV beams amidst the MLC-0 experiments (nb, see end of Sec. 2C), was visually inspected so that those images that were obviously affected by stray radiation (four, in this case) could be removed. The total signal integrals from the remaining 16 unfiltered images were then averaged, yielding a standard deviation of 0.23% of the mean. As a result of using this relatively large data set, this test produced a best estimate of the true standard deviation of the data.
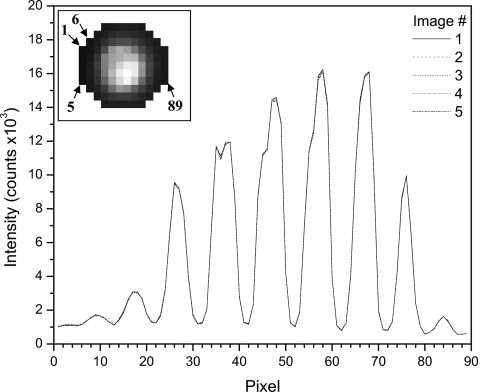
The standard deviations found using the bootstrapping technique on the data taken with both MLC setups (i.e., after optimization of the mirror setup) range from 0.19% to 0.48%, with the mean being 0.27%. Thus, the bootstrapping technique produces an estimate of error for signals that are affected by noise due to stray radiation that is practically equivalent to the level of error found in apparently noise-free signals. To allow for a better appreciation of the precision of the PSD system, we show an example data set from five unprocessed images of the ROI containing mostly scintillation light in Fig. 6. Here, each of the five images has been converted to a two-dimensional plot of intensity versus pixel. These data were taken from a set of images obtained at 18 MV using a 10×10 cm2 field. The plots show little (if any) stray radiation effects, as well as close agreement.
Figure 6.
Two-dimensional plots of measured intensities for each pixel in the ROI, across five images (image 1 is shown in the upper left corner inset). Pixel intensities were taken from an image from top to bottom, left to right, starting at the leftmost pixel column. (Inset: Sample images of PSD output enclosed in the ROI with arrows indicating the first, fifth, sixth, and 89th pixels, as shown in the intensity plots.)
Dependence on field definition
It is difficult to directly compare the output factors measured in fields created using the jaws and the MLC at the smallest field sizes because of the inherent differences in the mechanical designs of the two collimation devices. A machine safeguard prevented the X-Y collimator jaws from closing to less than 6 mm apart and the width of the MLC leaves limited small fields to having side lengths in multiples of 5 mm. The smallest field size in common between the two mechanisms was 1.0×1.0 cm2. At this field size, the data obtained from both detectors in fields defined using the jaws and the MLC-4 configuration were practically equivalent for 6 MV beams. The output factors for the 18 MV beam for fields formed using the MLC-4 configuration were slightly higher (∼4%) than those found for the jaw-defined fields for both detectors. Output factors from the 6 MV field created with the MLC-0 configuration were 2.5% and 3.6% higher than those from fields defined by the jaws for the PSD and ionization chamber, respectively. In the case of 18 MV photons, the MLC-0-defined field output factors of both the PSD and the ionization chamber were 9% higher than those measured using the jaw-defined fields. Except in the 6 MV, MLC-4-defined fields, both the ionization chamber and the PSD measured a slightly higher output factor when the 1.0×1.0 cm2 field was shaped by the MLC rather than the jaws. Many factors may have contributed to this effect, including a higher amount of scatter in the MLC leaves or phantom, leakage between the closed MLC leaves, and the different locations of the field-defining mechanisms between the source and the final field (and detector).
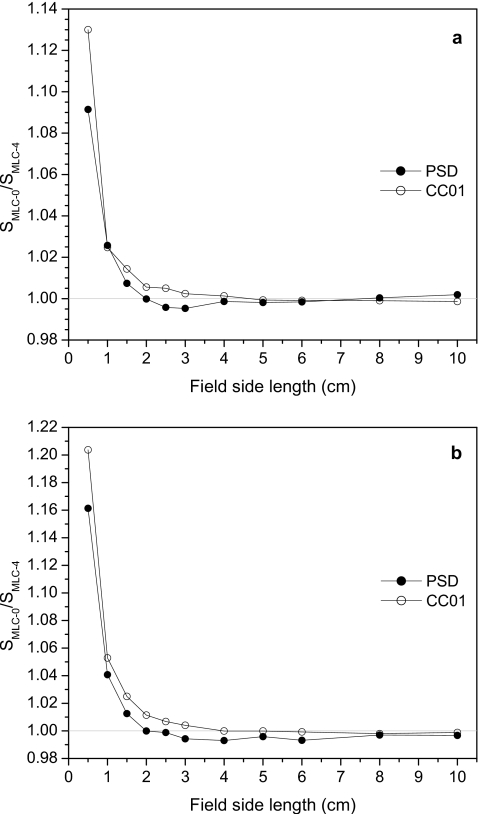
Figure 7 displays the results of taking the ratios of the signals obtained from the two MLC configurations. Here, SMLC-0 and SMLC-4 are the signals measured with closed leaves having no offset and 4 cm offset, respectively. Ratios are given for both detectors. Significant differences between the signals recorded from the two MLC configurations are evident. The largest difference (>20%) was recorded by the ionization chamber when 18 MV beams were used. Ratios for both detectors fell to 1% or below at field sizes of 2.0×2.0 cm2 and above for both energies. These large discrepancies were most likely due to the fact that for smaller fields, radiation leakage through centered closed leaves had a larger influence than leakage through offset leaves.
Figure 7.
Ratios of the signal obtained using MLC-defined fields with no closed-leaf offset (SMLC-0) over the signal obtained using MLC fields in which the closed leaves were offset by 4 cm (SMLC-4) at multiple field sizes for (a) 6 and (b) 18 MV beams.
DISCUSSION
Our results are consistent with previous studies which have shown that for small radiation fields, plastic scintillators measured higher output factors than an ionization chamber. Beddar et al.24 used a silicon diode, a radiographic film, a 0.1 cm3 ionization chamber, and a 1.6 mm3 plastic scintillator to measure the output factors from a 6 MV linac beam that was collimated with specially designed 5, 10, 20, and 30 mm stereotactic cones. The plastic scintillator was shown to measure higher output factors than the other detectors for all field sizes with the sole exception of the 5 mm field size, where the diode showed higher output and the ionization chamber was not tested due to its large size. Archambault et al.25 showed that a 1.4 mm3 plastic scintillating fiber measured an output factor that was ∼4% higher than that measured by a 7 mm3 ionization chamber using a 1×1 cm2 jaw-defined, 6 MV linac beam. This is close to the disparity we see in our 1×1 cm2 output factors for jaw-defined fields [see Fig. 3a].
The difference in the active volumes of the detectors used in this study represents the most likely cause of the differing output factor measurements. In the subcentimeter region, field sizes approach the order of magnitude of the size of the ionization chamber, which has an outer electrode diameter of 2 mm. Thus, the output factors measured using the ionization chamber may suffer more from volume-averaging effects than the 0.5 mm diameter PSD.
Detectors other than ionization chambers have been used extensively to test output factors for small fields. Mack et al.35 performed a thorough examination and review of output factors of a Gamma Knife® (Elekta Instrument AB, Stockholm, Sweden) using several detectors including a PinPoint® ionization chamber (PTW, Freiburg, Germany), a liquid ionization chamber, a diode, a diamond detector, a radiochromic film, and thermoluminescent dosimeters, among others. Absent from their detector list is any form of plastic scintillator. They found that for fields having diameters of 14, 8, and 4 mm, the mean of the output factors measured by all of the detectors were 98.7%, 95.8%, and 87.4%, respectively. These output factors closely matched those found in their review of other studies (including results of Monte Carlo calculations) using the Gamma Knife® and are much higher than those found in the current study at similar field sizes. The disagreement is most likely due to the differences between the photon energies and∕or forms of collimation used in the Gamma Knife® and the Clinac.
Westermark et al.36 applied cone collimators similar to those used in the Gamma Knife® (ranging in size from 4 to 18 mm in diameter) to a Varian Clinac 2100C and studied the output factors of a 6 MV beam using a plastic scintillation dosimetry system based on BC-400 (Saint-Gobain Crystals, Hiram, OH), as well as a single diode detector, and a double diode, a diamond detector, and a liquid ionization chamber. At these field sizes, the scintillator was shown to consistently measure output factors that were ≥5% lower than the liquid scintillator and measured lower than the diode detectors at most of the field sizes. The scintillator and diamond detector performed similarly with the exception of the 4 mm diameter field, where the scintillator measured a ∼10% higher output factor. The authors argue that the nonwater equivalence of silicon may been responsible for an over-response of the diode detectors at these small fields and that if the output factors were renormalized to the 18 mm diameter field, the factors measured by the scintillator and liquid ionization chamber would have agreed to within 2% over all of the small circular fields.
For our experiments, the two detectors were placed using a small grid to precisely align the detectors with the light field crosshairs. However, truly accurate measurement of small-field output factors requires that the placement of the detector(s) correspond to the region of the small field with the highest intensity. At a certain point, small fields lose any flatness in their centers and become convolutions of penumbras resulting from whichever collimation was used. We did not investigate the actual position of the peak radiation intensity for the small fields. We relied on the routinely calibrated coincidence of the light and the radiation fields as output through the collimating jaws. Granted, this calibration is typically performed at larger field sizes than those used in this study. We are confident that the grid paper device shown in Fig. 2 granted us a positioning precision of within 1 mm. This suggests that even if the detectors were not placed exactly at the position of peak intensity, both the PSD and the ionization chamber were reproducibly placed with an identical shift away from the peak intensity.
Direct measurement of the peak field intensity could have been performed using film, but any attempt to match the peak position found using the film with the PSD or ionization chamber would likely introduce further positioning error, and still there would be no guarantee that the detectors were placed exactly at the peak intensity. A more reliable method for locating the peak field intensity is to scan the horizontal field profiles using a three-dimensional translation stage with each detector and then hold the detectors in the position of the highest readings.
CONCLUSION
A small-volume PSD has been shown to precisely report output factors higher than those measured with a 0.01 cm3 ionization chamber for radiation fields less than or equal to 1.0×1.0 cm2. The higher performance of the PSD is due mostly to it being less susceptible to volume-averaging effects than the ionization chamber and so the output factors measured with the PSD are likely more accurate. Future works should include comparative tests using a selection of other detectors (diodes, diamond detectors, MOSFETs, etc.) and the use of a water phantom equipped with a three-dimensional stage so that the maximum field intensity can be tracked in order to circumvent any uncertainties in manual positioning using visual cues, field-defining construction techniques (i.e., jaws or MLCs), and positional references (e.g., light field crosshairs or lasers).
A method for estimating the error associated with filtering the CCD images using a temporal median was found to produce levels of uncertainty similar to those expected for images that had little to no apparent noise due to incident stray radiation. Therefore we suggest that the bootstrapping or similar approach be implemented when estimating the error associated with signals taken from CCD images that contain far outliers in their noise component due to incident stray radiation.
We have shown that the output characteristics of small radiation fields depend heavily not only on the type of collimation device, but also on the particular configuration of a single device (i.e., the MLC). This dependence was seen in both detectors. It is highly recommended that great care be taken in the choice of collimation to define smaller fields. In the case of multileaf collimation, we suggest that the closed MLC leaves be offset away from the center of the field to reduce the influence of radiation leakage on the output of the small field.
Our results suggest that plastic scintillation dosimetry is a useful alternative to existing dosimetry systems for small fields, as PSDs are less susceptible to volume-averaging and perturbation effects than larger, air-filled ionization chambers; therefore, PSDs may have an inherent ability to determine output factors more accurately.
ACKNOWLEDGMENTS
This work was supported by the National Cancer Institute partly from T32 (Grant No. T32-CA119930-04) and R01 (Grant No. 1R01CA120198-01A2) grants. The authors would like to thank Kathryn Carnes for her help in editing the manuscript.
References
- Lindquist C. and Paddick I., “The Leksell Gamma Knife Perfexion and comparisons with its predecessors,” Neurosurgery 61, 130–141 (2007). 10.1227/01.neu.0000289726.35330.8a [DOI] [PubMed] [Google Scholar]
- Otto K., “Volumetric modulated arc therapy: IMRT in a single gantry arc,” Med. Phys. 35, 310–317 (2008). 10.1118/1.2818738 [DOI] [PubMed] [Google Scholar]
- Wang C., Luan S., Tang G., Chen D. Z., Earl M. A., and Yu C. X., “Arc-modulated radiation therapy (AMRT): A single-arc form of intensity-modulated arc therapy,” Phys. Med. Biol. 53, 6291–6303 (2008). 10.1088/0031-9155/53/22/002 [DOI] [PubMed] [Google Scholar]
- Benedict S. H., Cardinale R. M., Wu Q., Zwicker R. D., Broaddus W. C., and Mohan R., “Intensity-modulated stereotactic radiosurgery using dynamic micro-multileaf collimation,” Int. J. Radiat. Oncol., Biol., Phys. 50, 751–758 (2001). 10.1016/S0360-3016(01)01487-0 [DOI] [PubMed] [Google Scholar]
- Cadman P., Bassalow R., Sidhu N. P. S., Ibbott G. S., and Nelson A., “Dosimetric considerations for validation of a sequential IMRT process with a commercial treatment planning system,” Phys. Med. Biol. 47, 3001–3010 (2002). 10.1088/0031-9155/47/16/314 [DOI] [PubMed] [Google Scholar]
- Laub W. U. and Wong T., “The volume effect of detectors in the dosimetry of small fields used in IMRT,” Med. Phys. 30, 341–347 (2003). 10.1118/1.1544678 [DOI] [PubMed] [Google Scholar]
- Ma C. -M., Jiang S. B., Pawlicki T., Chen Y., Li J. S., Deng J., and Boyer A. L., “A quality assurance phantom for IMRT dose verification,” Phys. Med. Biol. 48, 561–572 (2003). 10.1088/0031-9155/48/5/301 [DOI] [PubMed] [Google Scholar]
- Sánchez-Doblado F., Hartmann G. H., Pena J., Capote R., Paiusco M., Rhein B., Leal A., and Lagares J. I., “Uncertainty estimation in intensity-modulated radiotherapy absolute dosimetry verification,” Int. J. Radiat. Oncol., Biol., Phys. 68, 301–310 (2007). 10.1016/j.ijrobp.2006.11.056 [DOI] [PubMed] [Google Scholar]
- Ding G., Duggan D., and Coffey C., “Commissioning stereotactic radiosurgery beams using both experimental and theoretical methods,” Phys. Med. Biol. 51, 2549–2566 (2006). 10.1088/0031-9155/51/10/013 [DOI] [PubMed] [Google Scholar]
- Scott A. J. D., Nahum A. E., and Fenwick J. D., “Using a Monte Carlo model to predict dosimetric properties of small radiotherapy photon fields,” Med. Phys. 35, 4671–4684 (2008). 10.1118/1.2975223 [DOI] [PubMed] [Google Scholar]
- Sterpin E., Hundertmark B. T., Mackie T. R., Lu W., Olivera G. H., and Vynckier S., “Monte Carlo-based analytical model for small and variable fields delivered by TomoTherapy,” Radiother. Oncol. 94, 229–234 (2010). 10.1016/j.radonc.2009.12.018 [DOI] [PubMed] [Google Scholar]
- Almond P. R., Biggs P. J., Coursey B. M., Hanson W. F., Huq M. S., Nath R., and Rogers D. W., “AAPM’s TG-51 protocol for clinical reference dosimetry of high-energy photon and electron beams,” Med. Phys. 26, 1847–1870 (1999). 10.1118/1.598691 [DOI] [PubMed] [Google Scholar]
- Alfonso R., Andreo P., Capote R., Huq M. S., Kilby W., Kjall P., Mackie T. R., Palmans H., Rosser K., Seuntjens J., Ullrich W., and Vatnitsky S., “A new formalism for reference dosimetry of small and nonstandard fields,” Med. Phys. 35, 5179–5186 (2008). 10.1118/1.3005481 [DOI] [PubMed] [Google Scholar]
- Das I. J., Ding G. X., and Ahnesjo A., “Small fields: Nonequilibrium radiation dosimetry,” Med. Phys. 35, 206–215 (2008). 10.1118/1.2815356 [DOI] [PubMed] [Google Scholar]
- Beddar A. S., Mackie T. R., and Attix F. H., “Water-equivalent plastic scintillation detectors for high-energy beam dosimetry: I. Physical characteristics and theoretical consideration,” Phys. Med. Biol. 37, 1883–1900 (1992). 10.1088/0031-9155/37/10/006 [DOI] [PubMed] [Google Scholar]
- Beddar A. S., Mackie T. R., and Attix F. H., “Water-equivalent plastic scintillation detectors for high-energy beam dosimetry: II. Properties and measurements,” Phys. Med. Biol. 37, 1901–1913 (1992). 10.1088/0031-9155/37/10/007 [DOI] [PubMed] [Google Scholar]
- Clift M. A., Sutton R. A., and Webb D. V., “Water equivalence of plastic organic scintillators in megavoltage radiotherapy bremsstrahlung beams,” Phys. Med. Biol. 45, 1885–1895 (2000). 10.1088/0031-9155/45/7/313 [DOI] [PubMed] [Google Scholar]
- Fontbonne J. M., Iltis G., Ban G., Battala A., Vernhes J. C., Tillier J., Bellaize N., Le Brun C., Tamain B., Mercier K., and Motin J. C., “Scintillating fiber dosimeter for radiation therapy accelerator,” IEEE Trans. Nucl. Sci. 49, 2223–2227 (2002). 10.1109/TNS.2002.803680 [DOI] [Google Scholar]
- Archambault L., Beddar A. S., Gingras L., Roy R., and Beaulieu L., “Measurement accuracy and Cerenkov removal for high performance, high spatial resolution scintillation dosimetry,” Med. Phys. 33, 128–135 (2006). 10.1118/1.2138010 [DOI] [PubMed] [Google Scholar]
- Beddar A. S., “Water equivalent plastic scintillation detectors in radiation therapy,” Radiat. Prot. Dosim. 120, 1–6 (2006). 10.1093/rpd/nci694 [DOI] [PubMed] [Google Scholar]
- Lambert J., McKenzie D. R., Law S., Elsey J., and Suchowerska N., “A plastic scintillation dosimeter for high dose rate brachytherapy,” Phys. Med. Biol. 51, 5505–5516 (2006). 10.1088/0031-9155/51/21/008 [DOI] [PubMed] [Google Scholar]
- Beddar A. S., Mason D. J., and O’Brien P. F., “Absorbed dose perturbation caused by diodes for small field photon dosimetry,” Med. Phys. 21, 1075–1079 (1994). 10.1118/1.597350 [DOI] [PubMed] [Google Scholar]
- Létourneau D., Pouliot J., and Roy R., “Miniature scintillating detector for small field radiation therapy,” Med. Phys. 26, 2555–2561 (1999). 10.1118/1.598793 [DOI] [PubMed] [Google Scholar]
- Beddar A. S., Kinsella T. J., Ikhlef A., and Sibata C. H., “A miniature ‘scintillator-fiberoptic-PMT’ detector system for the dosimetry of small fields in stereotactic radiosurgery,” IEEE Trans. Nucl. Sci. 48, 924–928 (2001). 10.1109/23.940133 [DOI] [Google Scholar]
- Archambault L., Beddar A. S., Gingras L., Lacroix F., Roy R., and Beaulieu L., “Water-equivalent dosimeter array for small-field external beam radiotherapy,” Med. Phys. 34, 1583–1592 (2007). 10.1118/1.2719363 [DOI] [PubMed] [Google Scholar]
- Archambault L., Briere T. M., Pönisch F., Beaulieu L., Kuban D. A., Lee A. K., and Beddar A. S., “Toward a true real-time in-vivo dosimetry system using plastic scintillation detectors,” Int. J. Radiat. Oncol., Biol., Phys. 78, 280–287 (2010). [DOI] [PMC free article] [PubMed] [Google Scholar]
- Beddar A. S., Mackie T. R., and Attix F. H., “Cerenkov light generated in optical fibers and other light pipes irradiated by electron-beams,” Phys. Med. Biol. 37, 925–935 (1992). 10.1088/0031-9155/37/4/007 [DOI] [Google Scholar]
- de Boer S. F., Beddar A. S., and Rawlinson J. A., “Optical filtering and spectral measurements of radiation-induced light in plastic scintillation dosimetry,” Phys. Med. Biol. 38, 945–958 (1993). 10.1088/0031-9155/38/7/005 [DOI] [Google Scholar]
- Frelin A. M., Fontbonne J. M., Ban G., Colin J., Labalme M., Batalla A., Isambert A., Vela A., and Leroux T., “Spectral discrimination of Cerenkov radiation in scintillating dosimeters,” Med. Phys. 32, 3000–3006 (2005). 10.1118/1.2008487 [DOI] [PubMed] [Google Scholar]
- Archambault L., Briere T. M., and Beddar S., “Transient noise characterization and filtration in CCD cameras exposed to stray radiation from a medical linear accelerator,” Med. Phys. 35, 4342–4351 (2008). 10.1118/1.2975147 [DOI] [PMC free article] [PubMed] [Google Scholar]
- Martens C., De Wagter C., and De Neve W., “The value of the PinPoint ion chamber for characterization of small field segments used in intensity-modulated radiotherapy,” Phys. Med. Biol. 45, 2519–2530 (2000). 10.1088/0031-9155/45/9/306 [DOI] [PubMed] [Google Scholar]
- Efron B., “1977 Rietz Lecture—Bootstrap methods—Another look at the Jackknife,” Ann. Stat. 7, 1–26 (1979). 10.1214/aos/1176344552 [DOI] [Google Scholar]
- Davison A. C. and Hinkley D. V., Bootstrap Methods and Their Application (Cambridge University Press, Cambridge, 1997). [Google Scholar]
- Booth J. G. and Sarkar S., “Monte Carlo approximation of bootstrap variances,” Am. Stat. 52, 354–357 (1998). 10.2307/2685441 [DOI] [Google Scholar]
- Mack A., Scheib S., Major J., Gianolini S., Pazmandi G., Feist H., Czempiel H., and Kreiner H., “Precision dosimetry for narrow photon beams used in radiosurgery—Determination of Gamma Knife output factors,” Med. Phys. 29, 2080–2089 (2002). 10.1118/1.1501138 [DOI] [PubMed] [Google Scholar]
- Westermark M., Arndt J., Nilsson B., and Brahme A., “Comparative dosimetry in narrow high-energy photon beams,” Phys. Med. Biol. 45, 685–702 (2000). 10.1088/0031-9155/45/3/308 [DOI] [PubMed] [Google Scholar]


