

Abstract
Objective
Chronic hypercortisolemia due to Cushing’s Disease (CD) results in abnormal adipose tissue (AT) distribution. Whole-body magnetic resonance imaging (MRI) was used to examine lean and AT distribution in female patients with CD to further understand the role of glucocorticoid excess in the development of abnormal AT distribution and obesity.
Design
Cross-sectional and case control study.
Patients
15 females with CD and 12 healthy controls.
Measurements
Mass of skeletal muscle (SM) and AT in the visceral (VAT), subcutaneous (SAT), and inter-muscular (IMAT) compartments from whole-body MRI and serum levels of insulin, glucose, and leptin were measured.
Results
CD patients had leptin values that correlated to total AT (TAT) and SAT (p < 0.05) but not to VAT. CD patients had higher VAT/TAT ratios (p < 0.01) and lower SAT/TAT ratios (p < 0.05) compared to controls. TAT, VAT, and trunk SAT (TrSAT) were greater in CD patients (p < 0.01). SM was less in CD (p < 0.001) but IMAT was not different.
Conclusions
TAT, VAT, trSAT, and the proportion of AT in the visceral depot were greater in CD, though the proportion in the subcutaneous depot was less. SM was less but IMAT was not different. These findings have implications for understanding the role of cortisol in the abnormal AT distribution and metabolic risk seen in patients exposed to chronic excess glucocorticoids.
Keywords: Cushing syndrome; Metabolic syndrome; Intra-abdominal fat; Adipose tissue, brown; Leptin
INTRODUCTION
Cortisol is known to have important roles in the regulation of body composition 1, 2. Although the mechanisms of regulation remain unclear, cortisol has been shown to bind to a cytoplasmic glucocorticoid receptor in human adipocytes 3, of which visceral adipose tissue (VAT) may express a higher number than adipose tissue (AT) located elsewhere 3, 4. The cortisol-receptor complex stimulates lipogenesis by increasing lipoprotein lipase (LPL) activity 2, and in Cushing’s Syndrome (CS), LPL activity may be higher in retroperitoneal compared to subcutaneous fat 5. Subsequently, chronic hypercortisolemia due to CS is associated with profound changes in body composition, including increased central adiposity and decreased lean mass 1, 2, 6–8. Central adiposity is strongly associated, in other populations, with development of insulin resistance and the metabolic syndrome in both normal and overweight individuals 9. Whether this relationship exists in CS, and whether known markers of metabolic and cardiovascular risk can be used for patients with CS has not yet been clarified.
Total body MRI, which offers the most accurate currently available method of assessing body composition components, especially VAT (for which DXA only approximates with trunk fat measurements 10), has not previously been done to study CS. Therefore, in this study we assessed body composition by total body MRI, in order to characterize the AT distribution seen in pituitary ACTH-dependent Cushing’s Disease (CD), and to correlate AT distribution to HOMA2 score and leptin levels. Given the risk associated with increased VAT, our primary endpoint was to quantify this depot in CD compared to matched controls. We also quantified, for the first time, inter-muscular adipose tissue (IMAT) in patients with CD. IMAT is AT that surrounds the muscle fibers, and is associated in other populations with insulin resistance 11. We hypothesized that patients with CD would have increased VAT and decreased lean mass, and we aimed to investigate the relationship between VAT and insulin resistance in this population.
METHODS
STUDY SUBJECTS
CD Subjects
We prospectively enrolled 15 female subjects with active CD. All patients had elevated 24-hour urinary free cortisol (UFC) and normal or elevated ACTH levels, as measured by their physician. The study cohort included 9 Caucasian patients, 4 African American patients, and 2 Asian patients, with a mean age at entry of 40.8 years (range 23–74 years), mean BMI 34.5 kg/m2 (range 25.1–46 kg/m2), mean weight 89.7 kg (range 64.7–133.7 kg), and mean waist circumference 103.4 cm (range 85.1–132.1 cm) (Table 1). Two had prior treatment (transsphenoidal surgery, TS) and 13 had no prior CD treatment. All patients subsequently had TS. ACTH tumors were confirmed pathologically in 12 of the 15 patients. In the three patients with negative surgical pathology, two had post-operative hypocortisolemia (<138 nmol/L) and one did not; all three patients entered clinical and biochemical remission post-operatively. Twelve patients had a suppressed (<138 nmol/L) 1–2 day post-operative cortisol (not on glucocorticoid replacement).
Table 1.
15 CD Patients Demographics and Endocrinological Characteristics
| pt | Age | Prior therapy | Sx (yrs) | ACTH (pmoi/1) | cort (rtmol/l) | UFC (nmol/d] | LDDST (nmol/l) | HOMA2 | DM | Leptm (ng/ml) | WC (cm) | Weight (kg) |
|---|---|---|---|---|---|---|---|---|---|---|---|---|
| 1 | 39 | no | 1.0 | 12.76 | 493.86 | 402.81 | 162.78 | 3.0 | no | 51.7 | 111.1 | 93.3 |
| 2 | 39 | no | 1.0 | 36.52 | 515.93 | 501.86 | 82.77 | 2.7 | no | 16.5 | 91.4 | 71.4 |
| 3 | 44 | yes - TS | 2.0 | 4.40 | 954.61 | 300.73 | 1.8 | GDM | 36.3 | 91.4 | ||
| a4 | 42 | no | 1.0 | 9.24 | 855.29 | 1271.90 | 0.8 | GDM | 38.0 | 110.5 | 116.7 | |
| 5 | 52 | no | 10.0 | 18.92 | 764.24 | 287.76 | 1.3 | no | 22.3 | 85.1 | 64.7 | |
| a6 | 29 | no | 3.0 | 6.16 | 772.52 | 435.92 | 386.26 | 0.7 | no | 45.0 | 106.6 | 90.0 |
| 7 | 64 | no | 2.5 | 4.18 | 651.12 | 309.01 | 1.4 | yes | 28.1 | 96.5 | 78.3 | |
| 8 | 23 | no | 3.0 | 17.38 | 1580.91 | 435.92 | 1.1 | no | 46.7 | 96.5 | 78.0 | |
| 9 | 45 | no | 15.0 | 22.66 | 589.05 | 143.47 | 452.48 | 1.1 | no | 29.6 | 132.1 | 107.0 |
| 10 | 27 | yes - TS | 0.5 | 7.04 | 629.05 | 275.90 | 311.77 | b | no | 30.4 | 92.4 | 88.5 |
| a11 | 74 | no | 4.5 | 8.14 | 551.80 | 19199.88 | 1.2 | yes | 79.6 | 120.0 | 133.7 | |
| 12 | 41 | no | 2.0 | 9.68 | 278.66 | 164.99 | 80.01 | 1.0 | no | 32.4 | 100.5 | 71.8 |
| 13 | 24 | no | 2.0 | 7.26 | 507.66 | 667.68 | 71.73 | 1.9 | no | 34.0 | 89.0 | 64.9 |
| 14 | 41 | no | 2.5 | 19.80 | 350.39 | 297.14 | 209.68 | 2.9 | IGT | 63.1 | 104.5 | 82.7 |
| 15 | 28 | no | 8.0 | 9.68 | 1051.18 | 761.48 | 80.01 | 1.8 | IFG | 49.2 | 111.7 | 112.4 |
| mean | 40.8 | 3.9 | 12.92 | 703.09 | °402.81 | 204.17 | 1.6 | 40.2 | 103.4 | 89.7 | ||
| SD | 14.4 | 4.1 | 8.76 | 322.08 | °292.5–584.8 | 146.31 | 0.8 | 16.3 | 13.0 | 20.2 |
not included in case control study
unable to calculate HOMA2 due to insulin value < 2 ulU/ml
median
25th–75th percentile
Sx Duration = Self-reported length of time (in years) pt has noted CD symptoms Approximate normal ranges:
TS = transsphenoidal surgery (can vary by assay and time of day)
24 hr UFC = 24 hour urinary free Cortisol ACTH 0–10 pmol/l
LDDST: post low dose dexamethasone test Cortisol value Cortisol 138–690 nmol/l
HOMA2 calculated from www.dtu.ox.ac.uk/homa UFC 11–138 nmol/24hr
DM = diabetes
WC = waist circumference
GDM = h/o gestational diabetetes
IGT = impaired glucose tolerance
IFG = impaired fasting glucose
Self-reported symptom duration ranged from 0.5 to 15 years (Table 1). Pre-operatively, four patients had a history of regular menses, eight had a history of irregular menses, and three were post-menopausal. Three patients were taking oral contraceptives at the time of the study visit. One patient had hypothyroidism, which was being treated with thyroid hormone replacement. Twelve patients had a diagnosis of hypertension. Two patients had a diagnosis of diabetes mellitus (DM), two had a history of gestational diabetes, one had impaired glucose tolerance, and one had impaired fasting glucose. Seven patients had hyperlipidemia, two had osteoporosis, two had osteopenia, and one additional patient had a history of a stress fracture (all by patient report). All patients were ambulatory with normal renal function and no liver disease.
Pre-operatively six patients had a normal pituitary MRI or irregularities seen only, eight had microadenomas, and one had a macroadenoma (greater than 1 cm). Five patients had preoperative inferior petrosal sinus sampling (IPSS) due to inconclusive diagnostic testing, and four of the five patients had a post-CRH central to peripheral ACTH ratio of >3:1. The patient with a central to peripheral ratio of less than 3:1 was confirmed to have an ACTH-secreting pituitary adenoma by surgical pathology and subsequent biochemical and clinical remission.
Healthy Control Group
Body composition testing comparison group
Twelve of the fifteen CD patients were included in a case-control study in which they were matched retrospectively to healthy controls from the New York Obesity Research Center at St. Luke’s-Roosevelt Hospital. Three CD patients (patients 4, 6, and 11) were not matched to healthy controls, as appropriate weight and aged-based matches were not present in the control cohort. The healthy subjects were recruited through advertisements in the New York City local newspapers and fliers posted in the community. Controls from this cohort who matched the CD patients by gender, ethnicity, menopausal status, age (± 6 years), and weight (± 5 kg) were included in the study (Table 2). The authors were blinded to the body composition data when selecting the controls, which were chosen by the above criteria. All healthy controls were ambulatory, nonsmoking, weight stable (± 2 kg over the prior 6 months) and not heavy exercisers. Participants with a history of diabetes mellitus, malignant/catabolic conditions or taking medications that could potentially influence body composition were excluded.
Table 2.
Demographics for CD patients and matched controls
| pt | Age | Et | inicity | Weight (kg) | ht(cm) | BMI (kg/m2) | Menopause | ||||
|---|---|---|---|---|---|---|---|---|---|---|---|
| CD | Control | CD | Control | CD | Control | CD | Control | CD | control | CD & control | |
| 1 | 39 | 38 | AA | AA | 93.3 | 92.6 | 156.7 | 167.9 | 38.0 | 32.8 | no |
| 2 | 39 | 33 | A | A | 71.4 | 68.8 | 152.0 | 173.1 | 30.9 | 22.9 | no |
| 3 | 44 | 45 | W | W | 91.4 | 92.5 | 147.3 | 160.0 | 42.0 | 36.1 | no |
| 5 | 52 | 56 | W | W | 64.7 | 63.7 | 158.6 | 160.7 | 25.7 | 24.6 | yes |
| 7 | 64 | 58 | W | W | 78.3 | 77.6 | 156.5 | 162.1 | 32.0 | 29.5 | yes |
| 8 | 23 | 28 | AA | AA | 78.0 | 77.6 | 176.4 | 160.0 | 25.1 | 30.3 | no |
| 9 | 45 | 44 | W | W | 107.0 | 101.9 | 160.7 | 161.6 | 41.1 | 39.0 | no |
| 10 | 27 | 30 | W | W | 88.5 | 87.4 | 171.3 | 172.8 | 30.2 | 29.3 | no |
| 12 | 41 | 45 | W | W | 71.8 | 76.1 | 157.0 | 156.6 | 29.1 | 31.0 | no |
| 13 | 24 | 24 | W | W | 64.9 | 68.4 | 152.4 | 172.7 | 27.9 | 22.9 | no |
| 14 | 41 | 45 | AA | AA | 82.7 | 83.2 | 162.5 | 166.2 | 31.2 | 30.1 | no |
| 15 | 28 | 28 | W | W | 112.4 | 111.3 | 172.0 | 174.7 | 38.3 | 36.5 | no |
| mean | 38.9 | 39.5 | 83.7 | 83.4 | 160.3 | 165.7 | 32.6 | 30.4 | |||
| SD | 12.1 | 11.1 | 15.4 | 14.3 | 8.9 | 6.3 | 5.8 | 5.2 | |||
| p value | 0.60 | 0.70 | 0.09 | 0.06 | |||||||
Note: Patients 4, 6, 11 not included
AA = African American
A = Asian
W = White
The study was approved by the Institutional Review Board at the Mount Sinai Medical Center and St. Luke’s-Roosevelt Hospital Center. All subjects gave written informed consent before participation.
STUDY DESIGN
Laboratory testing
Fasting insulin, glucose, and leptin levels were measured in the CD patients. Serum was frozen at −80 C. Each subjects’ samples were run in the same assay and in duplicate.
Body composition testing
Each subject underwent the following:
Anthropometric measurements
For the CD patients, body weight was measured with a digital scale to the nearest 0.1 kg and height with an eye level scale (Detecto, Webb City, MO) at the Mount Sinai General Clinical Research Center. For the control subjects, body weight was measured to the nearest 0.1 kg (Weight Tronix, New York, NY; and Scale-Tronix, Wheaton, IL) and height to the nearest 0.5 cm with a stadiometer (Holtain, Crosswell, United Kingdom) at the New York Obesity Research Center.
MRI
For the CD patients, total and regional body AT volumes were measured by whole body multi-slice MRI on a 1.5 T scanner at the Mount Sinai Hospital Radiology Associates (General Electric, Milwaukee, WI). Control subjects underwent MRI with a 1.5 T scanner platform at the New York Obesity Research Center (6x Horizon; General Electric, Milwaukee, WI). Identical image acquisition protocols were used for both MRI scanners, similar to what has been used in previous multi-center trials 12, 13. Technical parameters, slice thickness and spacing, and anatomical slice locations were also identical for both scanners, resulting in comparable images of similar quality. Subjects were placed on the MRI platform with their arms extended above their heads and approximately 40 axial images of 10 mm thickness at 40 mm intervals from head to toe were acquired. Trunk AT was defined as all AT in the body from the shoulder (upper limit defined as the separation between the arms and neck) to the pelvis (lower limit defined as the level of separation of the legs). The inter-muscular adipose tissue compartment (IMAT) was defined as the AT located between muscle groups and beneath the muscle fascia 14, 15. All images were analyzed using the same software and protocol with SliceOmatic image analysis software (TomoVision, Montreal, Canada) in the Image Reading Center at St. Luke’s-Roosevelt Hospital Center. MRI volume estimates were converted to mass using the assumed density of 0.92 kg/L for AT and 1.04 kg/L for skeletal muscle (SM) 16. The coefficient of variation for repeated measurements of the same scan by the same observer of MRI-derived AT volumes is 1.7% for SAT, 2.3% for VAT and 5.9% for IMAT 14.
Assays (CD patients)
Insulin was measured by Immulite®. Intra-assay coefficient of variation (CV) is 5.3% and inter-assay CV is 6.0%. Sensitivity is 2 μIU/ml. Glucose was measured by the hexokinase method. Leptin was measured by RIA (Linco Research, Inc.) with an intra-assay CV of 8.3% and inter-assay CV of 6.2%.
Estimates of insulin sensitivity (CD patients)
Insulin sensitivity was measured by homeostasis model assessment (HOMA2) scores using the HOMA calculator at www.dtu.ox.ac.uk/homa17.
STATISTICAL ANALYSIS
Normality of the data was assessed by visual inspection and the Shapiro-Wilk’s W test. For normally distributed variables parametric tests were used for analysis. Non-normal data were analyzed with the appropriate non-parametric test. Pearson correlation was used to assess the relationships between the mass of each AT compartment and the insulin sensitivity indices and leptin concentrations in the CD patients. Each subject’s VAT, subcutaneous AT (SAT), trunk SAT (TrSAT), limb SAT, total AT (TAT) and IMAT mass along with measures of adipose tissue distribution (e.g.: VAT/TAT, SAT/TAT, etc.) were compared to their matched healthy control values by paired t-test for normal data and by Wilcoxon Signed Ranks test for not normally distributed data. Linear regression was used to assess the association between VAT and CD after adjusting for TAT, height, and age. Linear regression was used to assess the association between SM and CD after adjusting for weight, height, and age. P values <0.05 were considered significant. Data are given as mean ± standard deviation unless stated otherwise. Data were analyzed using SPSS version 17.0 (SPSS Inc., Chicago, Illinois).
RESULTS
Cross-Sectional Study: AT and SM Mass, and Biochemical Markers in 15 CD Patients
Anthropometrics and duration of hypercortisolemia
Among CD patients, WC significantly correlated with BMI (p = 0.0001), TAT (p = 0.0001), VAT (p = 0.04), SAT (p = 0.001), TrSAT (p = 0.0001), and IMAT (p = 0.02). Duration of exposure to hypercortisolemia, estimated by the self-reported onset of symptoms, did not correlate to any anthropometric or body composition measurement (data not shown).
Correlation between Leptin values and AT Compartments
As shown in Table 1, the mean leptin value in CD patients was 40.2 ± 16.3 ng/ml. Leptin value significantly correlated to weight (r = 0.61, p = 0.015), TAT (r = 0.58, p = 0.024) and total SAT (r = 0.62, p = 0.013), but not to VAT (r = 0.005, p = 0.99), trSAT (r = 0.48, p = 0.07), or IMAT (r = 0.20, p = 0.48). Leptin was not significantly associated with fasting insulin, HOMA-IR, or fasting glucose. After excluding the two diabetic patients from the analyses, leptin was not associated with TAT or SAT.
AT Distribution and Insulin Sensitivity
Among CD patients, there were no significant correlations between fasting insulin or HOMA2 with BMI, SM, or any of the AT compartments, including VAT, TAT, TrSAT, or IMAT (data not shown).
Case-Control Study: AT and SM Mass in 12 CD Patients Compared to 12 Matched Controls
Weight, height, BMI, and age were not significantly different between the CD patients and the controls (Table 2).
TAT
AT mass in each compartment is shown in Table 3. TAT was higher than that of the matched control in ten of the twelve CD patients. By paired t-test, TAT was significantly higher in CD patients than in matched controls (mean in CD 37.7 ± 11.0 kg vs. 34.1 ± 11.1 kg in controls, p = 0.01). After excluding the two post-menopausal subjects in each group, and the three CD patients taking oral contraceptives, TAT remained significantly higher in CD patients than in controls (paired t-test, p = 0.01 for each).
Table 3.
CD patients and matched control whole-body MRI derived body composition data
| SM(kg) | SAT(kg) | IMAT(kg) | VAT | kg) | TAT(kg) | VAT/TAT | SAT/TAT | limb SAT(kg) | TrSAT(kg) | |||||||||
|---|---|---|---|---|---|---|---|---|---|---|---|---|---|---|---|---|---|---|
| pt | control | CD | control | CD | control | CD | control | CD | control | CD | control | CD | control | CD | control | CD | control | CD |
| 1 | 26.49 | 19.36 | 34.99 | 43.24 | 1.99 | 1.44 | 3.24 | 3.90 | 40.22 | 48.57 | 0.08 | 0.08 | 0.87 | 0.89 | 17.94 | 21.50 | 17.05 | 21.73 |
| 2 | 20.41 | 17.72 | 22.72 | 24.77 | 1.41 | 0.99 | 1.42 | 3.32 | 25.55 | 29.08 | 0.06 | 0.11 | 0.89 | 0.85 | 11.46 | 7.51 | 11.26 | 17.26 |
| 3 | 22.87 | 17.89 | 39.99 | 45.05 | 2.72 | 0.99 | 5.19 | 3.76 | 47.90 | 49.81 | 0.11 | 0.08 | 0.83 | 0.90 | 13.55 | 17.36 | 26.44 | 27.69 |
| 5 | 23.19 | 17.99 | 17.48 | 22.66 | 0.87 | 0.93 | 1.13 | 2.31 | 19.48 | 25.90 | 0.06 | 0.09 | 0.90 | 0.87 | 8.46 | 9.87 | 9.02 | 12.79 |
| 7 | 20.46 | 19.21 | 30.88 | 25.69 | 1.59 | 1.37 | 1.55 | 5.23 | 34.02 | 32.30 | 0.05 | 0.16 | 0.91 | 0.80 | 11.84 | 7.80 | 19.04 | 17.89 |
| 8 | 24.36 | 21.18 | 25.22 | 24.43 | 1.16 | 0.84 | 1.90 | 4.51 | 28.28 | 29.78 | 0.07 | 0.15 | 0.89 | 0.82 | 12.28 | 11.94 | 12.95 | 12.48 |
| 9 | 29.51 | 25.17 | 37.93 | 43.61 | 2.05 | 1.56 | 2.92 | 9.33 | 42.90 | 54.50 | 0.07 | 0.17 | 0.88 | 0.80 | 16.04 | 13.75 | 21.89 | 29.86 |
| 10 | 24.08 | 24.82 | 33.02 | 33.10 | 1.21 | 0.78 | 1.13 | 3.16 | 35.36 | 37.04 | 0.03 | 0.09 | 0.93 | 0.89 | 10.70 | 13.29 | 22.32 | 19.81 |
| 12 | 22.27 | 16.74 | 25.32 | 24.57 | 0.34 | 1.79 | 1.01 | 4.40 | 26.67 | 30.76 | 0.04 | 0.14 | 0.95 | 0.80 | 10.00 | 8.59 | 15.32 | 15.98 |
| 13 | 23.80 | 19.58 | 17.07 | 22.16 | 1.07 | 0.70 | 0.53 | 2.13 | 18.68 | 24.99 | 0.03 | 0.09 | 0.91 | 0.89 | 9.94 | 7.86 | 7.13 | 14.30 |
| 14 | 25.46 | 21.42 | 31.96 | 32.77 | 1.33 | 0.91 | 2.04 | 1.92 | 35.33 | 35.60 | 0.06 | 0.05 | 0.90 | 0.92 | 13.79 | 13.58 | 18.17 | 19.18 |
| 15 | 26.25 | 26.79 | 50.79 | 46.34 | 0.96 | 1.42 | 2.99 | 6.40 | 54.74 | 54.16 | 0.05 | 0.12 | 0.93 | 0.86 | 22.18 | 16.84 | 28.61 | 29.50 |
| mean | 24.10 | 20.66*** | 30.61 | 32.37 | 1.273 | 0.99a | 2.09 | 4.20** | 34.09 | 37.71** | 0.06 | 0.11- | 0.90 | 0.86* | 13.18 | 12.49 | 17.43 | 19.87* |
| SD | 2.60 | 3.30 | 9.77 | 9.66 | 1.0–1.7° | 0.9–1.4° | 1.30 | 2.08 | 11.07 | 11.03 | 0.02 | 0.04 | 0.03 | 0.04 | 3.90 | 4.45 | 6.69 | 6.17 |
p < 0.05
p < 0.01,
p < 0.001 vs. controls
median
25th–75th percentile
SM = skeletal muscle
SAT = subcutaneous adipose tissue
IMAT = inter-muscular adipose tissue
VAT = visceral adipose tissue
TAT = total adipose tissue
TrSAT = Trunk SAT
VAT
VAT was higher than that of the matched control in ten of the twelve CD patients. By paired t-test, VAT was significantly higher in CD patients than in matched controls (mean in CD 4.2 ± 2.1 kg vs. 2.1 ± 1.3 kg in controls, p = 0.004) (Figure 1). Using regression analysis, with VAT as the dependent variable, and TAT, height, and age, as covariates, the presence of CD was independently associated with VAT (p = 0.03). VAT remained significantly higher in CD patients than in controls after excluding the post-menopausal patients (paired t-test, p = 0.02) and after excluding the diabetic patients (paired t- test, p = 0.01; regression analysis, p = 0.02). VAT also remained significantly higher in CD patients than in controls after excluding the three patients taking oral contraceptives (paired t-test, p = 0.04).
Figure 1.
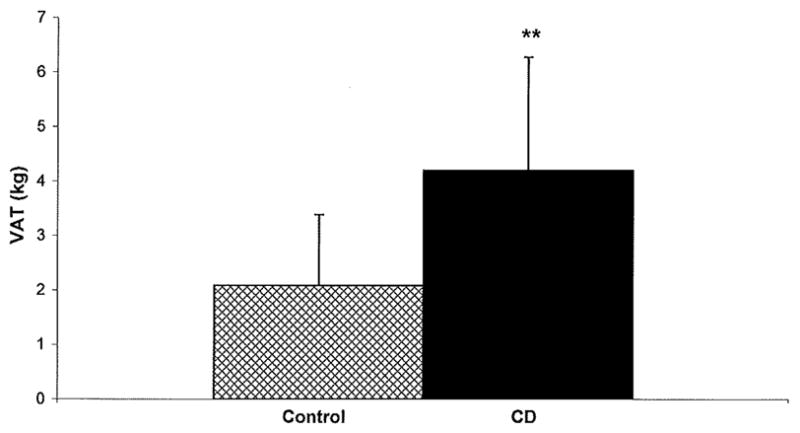
Mean VAT in subjects with CD (solid bar) and matched controls (patterned bar), n = 12 in each group. VAT was significantly higher in CD compared to controls, p < 0.01.
SAT
Eight of the 12 CD patients had a higher total SAT mass than their matched control, and eight of the 12 CD patients had a lower limb SAT mass than their matched control. Total SAT and limb SAT were not significantly different in the CD patients than in matched controls (mean total SAT in CD 32.4 ± 9.7 kg vs. 30.6 ± 9.8 kg in controls, p = 0.18; mean limb SAT in CD 12.5 ± 4.4 kg vs. 13.2 ± 3.9 kg in controls, p = 0.45). These data remained nonsignificant after excluding the three patients taking oral contraceptives (p = 0.07 for total SAT, p = 0.57 for limb SAT).
TrSAT
Nine of the twelve CD patients had a higher trSAT mass than their matched control. By paired t-test, trSAT was significantly higher in CD patients than in matched controls (mean in CD 19.9 ± 6.2 kg vs. 17.4 ± 6.7 kg in controls, p = 0.002). TrSAT remained significantly higher in CD patients after the post-menopausal patients were excluded from the analyses (p = 0.004). TrSAT also remained significantly higher in the CD patients after the three patients taking oral contraceptives were excluded from the analyses (p = 0.001).
IMAT
Nine of the twelve CD patients had a lower IMAT mass than their matched control. The IMAT values were not normally distributed and so were analyzed with Wilcoxon Signed Ranks test. IMAT was not significantly different in CD patients than in matched controls (median in CD was 0.99 kg with a 25th–75th percentile of 0.9–1.4 vs. 1.27 kg in the controls with a 25th–75th percentile of 1.0–1.7, p = 0.14).
SM
Ten of the twelve CD patients had a lower SM mass than their matched control. SM was significantly lower in CD patients than in matched controls (mean in CD 20.6 ± 3.3 kg vs. 24.1 ± 2.6 kg in controls, p = 0.0004). The ratio of the mean IMAT/SM was not significantly different between the groups (data not shown). Using regression analysis, with SM as the dependent variable, and weight, height, and age, as covariates, the presence of CD was independently associated with decreased SM (p = 0.001). After removing the three patients taking oral contraceptive from the analyses, the CD patients still had a significantly lower SM than controls (paired t-test, p = 0.0001).
Adipose Tissue Distribution
Compared to controls, CD patients had a significantly higher portion of their TAT in the visceral compartment (mean VAT/TAT was 0.11 ± 0.04 in CD vs. 0.06 ± 0.02 in controls, p = 0.002) and a significantly lower portion of their AT in the subcutaneous compartment (mean SAT/TAT was 0.86 ± 0.04 in CD vs. 0.90 ± 0.03 in controls, p = 0.03) (Table 3). The ratio of the trSAT to limb SAT was not significantly higher in CD patients than in controls (mean TrSAT/limb SAT was 1.67 ± 0.44 in CD vs. 1.33 ± 0.41 in controls, p = 0.06). The mean trSAT/TAT ratio was not significantly different between the two groups (data not shown).
DISCUSSION
Our study demonstrates that patients with chronic hypercortisolemia due to CD have significantly higher TAT, VAT, and trSAT, but similar IMAT despite lower SM mass, compared to weight matched controls. Additionally, CD patients have a significantly higher portion of their AT in the visceral compartment and a significantly lower portion in the subcutaneous compartment compared to matched controls. In CD, leptin correlated to TAT and SAT but not VAT, although this was not significant after the diabetic patients were excluded from the analyses. This is the first study to use whole-body MRI to quantify the body composition abnormalities in CD, and the first report quantifying IMAT in CD.
Cortisol’s regulation of AT may occur in part via leptin: acute administration of glucocorticoids increase leptin plasma levels 18, and similarly, cortisol inhibition results in hypoleptinemia 19. However, studies of CS patients have shown both comparable 20, 21 and elevated 7, 22, 23 leptin levels compared to BMI-matched controls. Only one study correlated body composition measurements (by DXA) to leptin levels in CS, and in this study diabetic patients were not analyzed separately 7. In contrast to this study, which found a significant correlation between serum leptin and percent truncal fat in CS patients 7, our study found that in CD, leptin levels correlated to TAT and SAT but not VAT. However when we excluded the diabetic patients, these findings were not significant, despite the fact that there was no significant correlation between leptin level and HOMA2, fasting insulin, or fasting glucose level among all CD patients. Further studies including more patients and following CD patients over time post-operatively will clarify whether leptin levels decrease with cure, and whether changes in body composition are required for a decline in leptin values post-operatively.
Whether CS patients have higher total fat 24, or just a redistribution of fat 1, 8 compared to non-CS obese patients has been debated. Our study found higher TAT in the CD patients compared to weight matched controls. We also found that limb SAT was not different between the two groups, despite the wide belief that CS patients exhibit limb atrophy. In fact, previous reports of limb fat in CS are contradictory, showing decreased 8, increased 6, and similar 5 limb fat/size in CS patients compared to controls. Given that trunk but not total SAT was higher in CD patients compared to controls, there may be a preferential deposition of SAT in the trunk compared to the limbs in CD, as opposed to an absolute decrease in limb SAT. Finally, the nonsignificant difference in total SAT in CD compared to controls also suggests that the increase in TAT in CD is predominantly due to an increase in VAT.
Indeed, we demonstrated a more pronounced elevation in VAT compared to SAT in CD. The elevation in VAT persisted after adjusting for TAT, height, and age, and after the post-menopausal, diabetic, and patients taking oral contraceptives, were excluded from the analyses, suggesting that the increased VAT was in fact due to chronic hypercortisolemia. Although no other study has used MRI to measure VAT in CD, the presence of abdominal obesity, measured by WC 2, DXA 5, 24, and CT 1, 8 has been shown previously. In our study, WC was significantly correlated to TrSAT and VAT. However not all studies show a good correlation, in other populations, between WC and DXA trunk fat measurements with VAT or total abdominal fat by MRI or CT 25, and therefore direct measures of VAT may be needed for accurate assessment. The mechanisms of cortisol’s regulation of VAT, resulting in the preferential enlargement of VAT versus SAT, may include increased expression of the glucocorticoid receptor and preferential regulation of 11BHSD1 in VAT compared to SAT 3, 4, 26, and/or lower AMP-activated protein kinase in the VAT 27.
The correlation between VAT and insulin resistance seen in other populations 9 may exist in CS as well, but has not been clearly shown. One study showed only a nonsignificant association between VAT and diabetes in CS 28, and another showed a significant correlation between percentage trunk fat and HOMA-IR in cured CS patients, but apparently not in those with active CS 29. Our study examined the relationship between regional AT mass and markers of insulin resistance (by HOMA2) in CD and did not find a correlation. Whether this reflects the small study size or a true finding remains to be determined in future studies.
We also examined, for the first time, the effect of excess cortisol on IMAT, an AT compartment that has been shown in other populations to be associated with insulin resistance 11. Interestingly, the absolute amount of IMAT was not increased in CD compared to weight, gender, age, menopausal status, and ethnicity matched controls, and despite the significantly reduced SM in CD patients compared to controls, the relative IMAT per SM mass was also not significantly different between the groups. Possibly larger numbers of patients need to be studied to clarify whether the IMAT is absolutely or relatively increased for the mass of SM in CD patients. The significance of the IMAT mass in relation to metabolic and cardiovascular risk in these patients needs to be investigated further, and whether the absolute IMAT mass or the IMAT relative to SM mass is predictive of risk currently is not understood.
Limitations of this study include the relatively small number of patients studied, the lack of suitable available controls for three of the CD patients, and the heterogeneity of the patient population (including pre- and post-menopausal patients, patients on oral contraceptive, and diabetic patients), though when these patients were excluded from the analyses the results were unchanged. Also, the limitations in selecting perfectly matched controls are intrinsic to any case control study, particularly since healthy volunteers may not accurately represent the population in general. The fact that the three CD patients who were not matched to controls had weights toward the upper spectrum of the cohort may have skewed the body composition data, as these patients were not included in that comparison. That the controls and patients with CD had MRI scans in different facilities could be of concern. However, the same image acquisition and analysis protocols were followed and all scan data was analyzed using the same lab. This has previously been shown to be an acceptable technique for MRI data 12, 13. Strengths of the study include the novel use of MRI to obtain a detailed assessment of AT distribution in CD, and the correlation of AT depots with HOMA2 and leptin levels.
In conclusion, we have demonstrated that hypercortisolemia due to CD is associated with higher TAT, with some AT depots preferentially elevated relative to others: VAT and trSAT are significantly elevated, but total SAT and IMAT are not. Whether IMAT is greater relative to the lower SM remains to be determined. In this insulin resistant and visceraly obese population, the degree of insulin resistance did not correlate to AT depot size, and novel markers of cardiovascular risk may need to be identified for this highly at risk population. To further understand the mechanisms of the metabolic dysregulation and increased cardiovascular risk seen in these patients, additional studies investigating the relationship between chronic glucocorticoid excess, AT distribution, and insulin resistance are warranted.
Acknowledgments
Supported by National Institutes of Health Grants K23 DK 082617 (to EBG), K24 DK 073040 (to PUF), P30-DK26687 (to the NYORC), and Mount Sinai General Clinical Research Center CReFF award MO1-RR-00071 (to EBG)
Footnotes
E.B.G, W.S., D.G., M.P., H.C.L., K.D.P., and P.U.F. have nothing to declare.
References
- 1.Mayo-Smith W, Hayes CW, Biller BM, Klibanski A, Rosenthal H, Rosenthal DI. Body fat distribution measured with CT: correlations in healthy subjects, patients with anorexia nervosa, and patients with Cushing syndrome. Radiology. 1989;170:515–518. doi: 10.1148/radiology.170.2.2911678. [DOI] [PubMed] [Google Scholar]
- 2.Rebuffe-Scrive M, Krotkiewski M, Elfverson J, Bjorntorp P. Muscle and adipose tissue morphology and metabolism in Cushing’s syndrome. J Clin Endocrinol Metab. 1988;67:1122–1128. doi: 10.1210/jcem-67-6-1122. [DOI] [PubMed] [Google Scholar]
- 3.Rebuffe-Scrive M, Lundholm K, Bjorntorp P. Glucocorticoid hormone binding to human adipose tissue. Eur J Clin Invest. 1985;15:267–271. doi: 10.1111/j.1365-2362.1985.tb00182.x. [DOI] [PubMed] [Google Scholar]
- 4.Rebuffe-Scrive M, Bronnegard M, Nilsson A, Eldh J, Gustafsson JA, Bjorntorp P. Steroid hormone receptors in human adipose tissues. J Clin Endocrinol Metab. 1990;71:1215–1219. doi: 10.1210/jcem-71-5-1215. [DOI] [PubMed] [Google Scholar]
- 5.Burt MG, Gibney J, Ho KK. Characterization of the metabolic phenotypes of Cushing’s syndrome and growth hormone deficiency: a study of body composition and energy metabolism. Clin Endocrinol (Oxf) 2006;64:436–443. doi: 10.1111/j.1365-2265.2006.02488.x. [DOI] [PubMed] [Google Scholar]
- 6.Garrapa GG, Pantanetti P, Arnaldi G, Mantero F, Faloia E. Body composition and metabolic features in women with adrenal incidentaloma or Cushing’s syndrome. J Clin Endocrinol Metab. 2001;86:5301–5306. doi: 10.1210/jcem.86.11.8059. [DOI] [PubMed] [Google Scholar]
- 7.Schafroth U, Godang K, Ueland T, Berg JP, Bollerslev J. Leptin levels in relation to body composition and insulin concentration in patients with endogenous Cushing’s syndrome compared to controls matched for body mass index. J Endocrinol Invest. 2000;23:349–355. doi: 10.1007/BF03343737. [DOI] [PubMed] [Google Scholar]
- 8.Wajchenberg BL, Bosco A, Marone MM, Levin S, Rocha M, Lerario AC, Nery M, Goldman J, Liberman B. Estimation of body fat and lean tissue distribution by dual energy X-ray absorptiometry and abdominal body fat evaluation by computed tomography in Cushing’s disease. J Clin Endocrinol Metab. 1995;80:2791–2794. doi: 10.1210/jcem.80.9.7673425. [DOI] [PubMed] [Google Scholar]
- 9.Carey DG, Jenkins AB, Campbell LV, Freund J, Chisholm DJ. Abdominal fat and insulin resistance in normal and overweight women: Direct measurements reveal a strong relationship in subjects at both low and high risk of NIDDM. Diabetes. 1996;45:633–638. doi: 10.2337/diab.45.5.633. [DOI] [PubMed] [Google Scholar]
- 10.Park YW, Heymsfield SB, Gallagher D. Are dual-energy X-ray absorptiometry regional estimates associated with visceral adipose tissue mass? Int J Obes Relat Metab Disord. 2002;26:978–983. doi: 10.1038/sj.ijo.0801982. [DOI] [PubMed] [Google Scholar]
- 11.Goodpaster BH, Thaete FL, Kelley DE. Thigh adipose tissue distribution is associated with insulin resistance in obesity and in type 2 diabetes mellitus. Am J Clin Nutr. 2000;71:885–892. doi: 10.1093/ajcn/71.4.885. [DOI] [PubMed] [Google Scholar]
- 12.Shen W, Punyanitya M, Chen J, Gallagher D, Albu J, Pi-Sunyer X, Lewis CE, Grunfeld C, Heymsfield SB, Heshka S. Visceral adipose tissue: relationships between single slice areas at different locations and obesity-related health risks. Int J Obes (Lond) 2007;31:763–769. doi: 10.1038/sj.ijo.0803474. [DOI] [PMC free article] [PubMed] [Google Scholar]
- 13.Tien PC, Benson C, Zolopa AR, Sidney S, Osmond D, Grunfeld C. The study of fat redistribution and metabolic change in HIV infection (FRAM): methods, design, and sample characteristics. Am J Epidemiol. 2006;163:860–869. doi: 10.1093/aje/kwj111. [DOI] [PMC free article] [PubMed] [Google Scholar]
- 14.Gallagher D, Kuznia P, Heshka S, Albu J, Heymsfield SB, Goodpaster B, Visser M, Harris TB. Adipose tissue in muscle: a novel depot similar in size to visceral adipose tissue. Am J Clin Nutr. 2005;81:903–910. doi: 10.1093/ajcn/81.4.903. [DOI] [PMC free article] [PubMed] [Google Scholar]
- 15.Freda PU, Shen W, Heymsfield SB, Reyes-Vidal CM, Geer EB, Bruce JN, Gallagher D. Lower visceral and subcutaneous but higher intermuscular adipose tissue depots in patients with growth hormone and insulin-like growth factor I excess due to acromegaly. J Clin Endocrinol Metab. 2008;93:2334–2343. doi: 10.1210/jc.2007-2780. [DOI] [PMC free article] [PubMed] [Google Scholar]
- 16.Snyder WS, Cook MJ, Nasset ES, Karhausen LR, Howells GP, Tipton IH. International Commission on radiological protection. 23. Pergamon Press; Oxford: 1975. Report of the Task Group on Reference Man. [Google Scholar]
- 17.Levy JC, Matthews DR, Hermans MP. Correct homeostasis model assessment (HOMA) evaluation uses the computer program. Diabetes Care. 1998;21:2191–2192. doi: 10.2337/diacare.21.12.2191. [DOI] [PubMed] [Google Scholar]
- 18.Papaspyrou-Rao S, Schneider SH, Petersen RN, Fried SK. Dexamethasone increases leptin expression in humans in vivo. J Clin Endocrinol Metab. 1997;82:1635–1637. doi: 10.1210/jcem.82.5.3928. [DOI] [PubMed] [Google Scholar]
- 19.Dagogo-Jack S, Tykodi G, Umamaheswaran I. Inhibition of cortisol biosynthesis decreases circulating leptin levels in obese humans. J Clin Endocrinol Metab. 2005;90:5333–5335. doi: 10.1210/jc.2005-0803. [DOI] [PubMed] [Google Scholar]
- 20.Widjaja A, Schurmeyer TH, Von zur Muhlen A, Brabant G. Determinants of serum leptin levels in Cushing’s syndrome. J Clin Endocrinol Metab. 1998;83:600–603. doi: 10.1210/jcem.83.2.4566. [DOI] [PubMed] [Google Scholar]
- 21.Krsek M, Silha JV, Jezkova J, Hana V, Marek J, Weiss V, Stepan JJ, Murphy LJ. Adipokine levels in Cushing’s syndrome; elevated resistin levels in female patients with Cushing’s syndrome. Clin Endocrinol (Oxf) 2004;60:350–357. doi: 10.1111/j.1365-2265.2003.01987.x. [DOI] [PubMed] [Google Scholar]
- 22.Leal-Cerro A, Considine RV, Peino R, Venegas E, Astorga R, Casanueva FF, Dieguez C. Serum immunoreactive-leptin levels are increased in patients with Cushing’s syndrome. Horm Metab Res. 1996;28:711–713. doi: 10.1055/s-2007-979884. [DOI] [PubMed] [Google Scholar]
- 23.Veldman RG, Frolich M, Pincus SM, Veldhuis JD, Roelfsema F. Hyperleptinemia in women with Cushing’s disease is driven by high-amplitude pulsatile, but orderly and eurhythmic, leptin secretion. Eur J Endocrinol. 2001;144:21–27. doi: 10.1530/eje.0.1440021. [DOI] [PubMed] [Google Scholar]
- 24.Kemink SA, Frijns JT, Hermus AR, Pieters GF, Smals AG, van Marken Lichtenbelt WD. Body composition determined by six different methods in women bilaterally adrenalectomized for treatment of Cushing’s disease. J Clin Endocrinol Metab. 1999;84:3991–3999. doi: 10.1210/jcem.84.11.6143. [DOI] [PubMed] [Google Scholar]
- 25.Storti KL, Brach JS, FitzGerald SJ, Bunker CH, Kriska AM. Relationships among body composition measures in community-dwelling older women. Obesity (Silver Spring) 2006;14:244–251. doi: 10.1038/oby.2006.31. [DOI] [PubMed] [Google Scholar]
- 26.Bujalska IJ, Kumar S, Stewart PM. Does central obesity reflect “Cushing’s disease of the omentum”? Lancet. 1997;349:1210–1213. doi: 10.1016/S0140-6736(96)11222-8. [DOI] [PubMed] [Google Scholar]
- 27.Kola B, Christ-Crain M, Lolli F, Arnaldi G, Giacchetti G, Boscaro M, Grossman AB, Korbonits M. Changes in adenosine 5′-monophosphate-activated protein kinase as a mechanism of visceral obesity in Cushing’s syndrome. J Clin Endocrinol Metab. 2008;93:4969–4973. doi: 10.1210/jc.2008-1297. [DOI] [PMC free article] [PubMed] [Google Scholar]
- 28.Rockall AG, Sohaib SA, Evans D, Kaltsas G, Isidori AM, Monson JP, Besser GM, Grossman AB, Reznek RH. Computed tomography assessment of fat distribution in male and female patients with Cushing’s syndrome. Eur J Endocrinol. 2003;149:561–567. doi: 10.1530/eje.0.1490561. [DOI] [PubMed] [Google Scholar]
- 29.Barahona MJ, Sucunza N, Resmini E, Fernandez-Real JM, Ricart W, Moreno-Navarrete JM, Puig T, Farrerons J, Webb SM. Persistent body fat mass and inflammatory marker increases after long-term cure of Cushing’s syndrome. J Clin Endocrinol Metab. 2009;94:3365–3371. doi: 10.1210/jc.2009-0766. [DOI] [PubMed] [Google Scholar]