Abstract
Tributyltin (TBT) activates the mitogen activated protein kinase (MAPK), p44/42 in human natural killer (NK) cells. TBT also reduces NK cytotoxic function and decreases the expression of several NK-cell proteins. To understand the role that p44/42 activation plays in TBT-induced loss of NK cell function, we have investigated how selective activation of p44/42 by phorbol 12-myristate 13-acetate (PMA) affects NK cells. Previously we showed that PMA caused losses of lytic function similar to those seen with TBT exposures. Here we examined activation of p44/42 in the regulation of NK-cell protein expression and how this regulation may explain the protein expression changes seen with TBT exposures. NK cells exposed to PMA were examined for levels of cell-surface proteins, granzyme mRNA, and perforin mRNA expression. The expression of CD11a, CD16, CD18, and CD56 were reduced, perforin mRNA levels were unchanged and granzyme mRNA levels were increased. To verify that activation of p44/42 was responsible for the alterations seen in CD11a, CD16, CD18, and CD56 with PMA, NK cells were treated with the p44/42 pathway inhibitor (PD98059) prior to PMA exposures. In the presence of PD98059, PMA caused no decreases in the expression of the cell-surface proteins. Results of these studies indicate that the activation of p44/42 may lead to the loss of NK cell cytotoxic function by decreasing the expression of CD11a, CD16, CD18, and CD56. Further, activation of p44/42 appears to be at least in part responsible for the TBT-induced decreases in expression of CD16, CD18, and CD56.
INTRODUCTION
Natural Killer (NK) cells are a subset of lymphocytes that are capable of killing (lysing) tumor cells, virally infected cells and antibody-coated cells. NK cells do not require prior sensitization in order to kill their targets (Lotzova, 1993; Vivier et al., 2004). They are the earliest and possibly predominant immune defense against tumor cells (Lotzova, 1993; O’Shea and Ortaldo, 1992; Trinchieri, 1989). They are responsible for limiting the spread of blood borne metastases, as well as limiting the development of primary tumors (Kiessling and Haller, 1978; Hanna, 1980). NK cells are also crucial in preventing viral infections as evidenced by greatly increased incidence of viral infection seen in individuals where the NK subset of lymphocytes is completely absent (Fleisher et al., 1982; Biron et al., 1989).
When an NK cell binds to a susceptible target cell, protein tyrosine kinases (PTKs) are activated (Gismondi et al., 2000) leading to subsequent activation of the mitogen activated protein kinase (MAPK) signaling cascade in NK cells (Vivier et al., 2004; Djeu et al., 2002). The MAPKs present in NK cells include p44/42 (also known as ERK1/2), p38, and JNK. Activation of p44/42 appears to be a part of the mechanism which controls the release of cytotoxic granules (which contain the lytic proteins granzyme B and perforin) from the NK cells onto target cells (Orange, 2008; Trotta et al., 1998; Trotta et al., 2000; Wei et al., 1998) and is thus needed in the lytic response of NK cells.
Tributyltin (TBT) is an environmental contaminant due to having been used in wood preservation, marine antifouling paints, disinfection of circulating industrial cooling waters, and slime control in paper mills (Kimbrough, 1976; Roper, 1992; Yamada et al., 1993). TBT has been detected in a number of household products (Yamada et al., 1993) and in human food, such as fish (Kannan et al., 1995a,b,c) and in human blood (Kannan et al., 1999; Whalen et al., 1999). The levels of TBT found in human blood samples ranged from a high of 260 nM to undetectable. Of the 38 blood samples (each from a different donor) that were studied 12 of the 38 (32%) showed levels of TBT between 25 to 265 nM and 19 of the 38 (50%) had levels between 3-25 nM (Kannan et al., 1999; Whalen et al., 1999).
TBT-induced loss of NK function could leave exposed individuals with an increased risk of viral infection and /or tumor formation. In vivo studies have shown decreased NK cell function in TBT exposed adult mice (Ghoneum et al., 1990). Alternatively, a study conducted on rats that were exposed to TBT both in-utero and post-natally showed increased splenic NK activity (Tryphonas et al., 2004). A study of weanling male rats administered bis(tri-n-butyltin) oxide (TBTO) for 106 weeks showed increased tumors (Wester et al., 1990). The reasons for these differences may be due to species (mouse versus rat), the method of administration of the TBT, or form of TBT. However, due to the demonstrated loss of NK function seen in at least one species in response to TBT, it was important to determine its effects on human immune system function. Previously, we have shown that in vitro exposures of human NK cells to TBT (at concentrations in the range found in blood, 300-25 nM) caused a loss of their ability to both lyse and bind to susceptible target cells (Whalen et al., 1999; Dudimah et al., 2007; Whalen et al., 2002). Our past studies have also shown that TBT-exposed human NK cells demonstrated a measureable decrease in the cell-surface proteins CD16, CD18, and CD56 that are involved in NK binding to targets (Whalen et al., 2002). There were also TBT-induced decreases in the cytolytic granule proteins, granzyme B and perforin (Thomas et al., 2004). As mentioned above, the cytolytic granule proteins are required to lyse targets. The importance of the role of MAPK activation in the regulation of the NK lytic response is described above. We have shown that TBT causes a significant (as much as 9 fold) increase in the activation of the MAPK, p44/42 (Aluoch and Whalen 2005; Aluoch et al., 2006) as well as other effects such as activation of the other MAPKs. This spurious activation of MAPKs by TBT leaves the NK cell unable to activate the MAPK signaling pathways when it subsequently comes in contact with a susceptible target cell and thus diminishes the NK cells ability to kill the target cell (Aluoch and Whalen 2005; Aluoch et al., 2006).
The role that activation of p44/42 (versus activation of the other MAPKs) plays in the loss of NK cell lytic function has been previously examined (Dudimah et al., 2010) by selectively stimulating (Chang et al., 2005) the p44/42 MAPK pathway using phorbol 12-myristate 13-acetate (PMA). Stimulation of p44/42 (to an extent similar to what was seen with TBT) (Aluoch and Whalen 2005; Aluoch et al., 2006) was able to decrease NK lytic function in a manner similar to that seen with TBT (Dudimah et al., 2010).
In this study, our goal is to elucidate the role that activation of the MAPK, p44/42, plays in regulating the expression of cell-surface proteins in NK cells and to investigate whether p44/42 activation (alone) can cause the TBT-induced changes in NK protein expression. The overlap between changes in protein expression seen with TBT and those seen with selective activation of p44/42 by PMA (Chang et al., 2005) will indicate what role (if any) p44/42 activation plays in TBT-induced alterations of protein expression. The cell-surface proteins examined are those that have been shown to have a role in NK cell interactions with targets, CD11a, CD16, CD18, and CD56 (Lotzova, 1993) as well as CD2 (which served as a negative control). CD16 and CD56 appear to be important in activation of the lytic response (Lotzova, 1993) and they (plus CD18) are decreased with TBT exposures (Whalen et al., 2002).
MATERIALS AND METHODS
Isolation of NK cells
Peripheral blood from healthy adults (male and female) volunteer donors was used for this study. Buffy coats (source leukocytes) obtained from either the American Red Cross (Portland, OR) or Key Biologics, LLC (Memphis, TN) were used to prepare NK cells. Highly purified NK cells were obtained using a rosetting procedure. Buffy coats were mixed with 0.6-0.8 mL of RosetteSep human NK cell enrichment antibody cocktail (StemCell Technologies, Vancouver, British Columbia, Canada) per 45 mL of buffy coat. The mixture was incubated for 20 min at room temperature (~ 25° C). Following the incubation, 5-8 mL of the mixture was layered onto 4 mL of Ficoll-Hypaque (1.077 g/mL) (MP Biomedicals, Irvine, CA) and centrifuged at 1200 g for 30-40 min. The cell layer was collected and washed twice with phosphate buffered saline (PBS) pH 7.2 and stored in complete media (RPMI-1640 supplemented with 10% heat-inactivated bovine calf serum (BCS), 2 mM L-glutamine and 50 U penicillin G with 50 μg streptomycin/mL (Mediatech, Inc. Herndon, VA)) at 1 million cells/mL at 37°C, 5%CO2. The resulting cell preparation was >95% CD16+, 0% CD3+ by fluorescence microscopy (Whalen et al., 2002) or flow cytometry in the current study.
Chemical preparation
PMA (Fisher Scientific, Suwanee, GA) and PD98059 (EMD Chemicals, Inc. Gibbstown, NJ) were dissolved in dimethylsulfoxide (DMSO, Sigma-Aldrich, St. Louis, MO) to give 10 mM stock solutions. TBT (Sigma-Aldrich, St. Louis, MO) was prepared as a 1 mM stock solution in de-ionized-distilled water. Desired concentrations of the compound were prepared by dilution of the stock into media.
Cell Treatments
NK cells (at a concentration of 1.5 million cells/mL) were exposed in the following ways. 1. PMA for 24 h: Cells were treated with the appropriate control or 2.5 nM PMA for 24 h at 37°C, 5%CO2. For mRNA analysis and western blot analysis, cells were treated with control, 10, and 2.5 nM or control, 10, 5, 2.5 and 1 nM PMA, respectively. 2. PMA for 1 h followed by 24 h in PMA-free media: Cells were treated with control (appropriate DMSO control), 5 nM PMA, 2.5 nM PMA, 1 nM PMA, and 0.5 nM PMA for 1 h. Following the incubation the cells were washed twice with media to remove the incubation media and then placed in compound-free media for 24 h at 37°C, 5%CO2. 3. Pre-treatments with PD98059 prior to exposure to varying concentrations of PMA: Cells were pre-incubated with 50 μM PD98059 or appropriate DMSO control for 1 h prior to the addition of control (for PMA), 5 nM PMA, 2.5 nM PMA, 1 nM PMA, or 0.5 nM PMA. The cells were then incubated with these PMA concentrations for 1 h. Thus, there was 1 tube of cells that had only control treatments and 5 tubes that had control for the 1 h pre-incubation which was then followed by a 1 h incubation with each of the 5 different PMA concentrations. There were also 5 tubes that had 50 μM PD98059 for the 1 h pre-incubation which was then followed by a 1 h incubation with each of the 5 PMA concentration. After the total 2 h of incubation the cells were washed twice with media to remove the incubation media and then placed in compound-free media for 24 h at 37°C, 5%CO2. 4. Treatment with TBT for 1 h followed by 24 h in TBT-free media: Cells were treated with control, 300 nM TBT, and 200 nM TBT for 1 h. Following the incubation the cells were washed twice with media to remove the incubation media and then placed in TBT-free media for 24 h at 37°C, 5%CO2. 5. Pre-treatments with PD98059 prior to exposure to varying concentrations of TBT: Cells were pre-incubated with 50 μM PD98059 or appropriate DMSO control for 1 h prior to the addition of control, 300 nM TBT, or 200 nM TBT. The cells were then incubated with these TBT concentrations for 1 h. After the total 2 hours of incubation the cells were washed twice with media to remove the incubation media and then placed in compound-free media for 24 h at 37°C, 5%CO2.
Cell Viability
Cell viability was determined by trypan blue exclusion (Whalen et al., 2003). Cell number and viability, assessed at the beginning and end of each exposure period, did not vary significantly among experimental conditions and control conditions for any of the cell treatments listed above.
Flow Cytometry
After the appropriate incubation with the compound, the cells were washed twice with ice-cold PBS and 100 μL of cell suspension (250,000-500,000 cells) was labeled with 10 μL (Whalen et al., 2002) of one of the following antibodies: anti-CD2, anti-CD11a, anti-CD16, anti-CD18, or anti-CD56 (Pharmingen, San Diego, CA). The antibodies were FITC-conjugated or PE-conjugated monoclonal antibodies. Appropriate FITC-conjugated and PE-conjugated isotype control antibodies (Phamingen, San Diego, CA) were used. The antibody-containing cell suspensions (final concentration 10 μL monoclonal antibody per 100 μL) were then incubated for 30 minutes on ice, in the dark. Following the incubation period the cells were washed twice with ice-cold PBS (0.5-1 mL) and suspended in 250 μL of ice-cold 1% paraformaldehyde in PBS. Samples were analyzed using a FACScan flow cytometer from Becton Dickinson Immunocytometry Systems, Inc. (BDIS). Instrument performance was standardized daily using Calibrite beads (BDIS) and the same instrument settings were used for all acquisitions of stained cells. The cell preparations were sufficiently uniform (with respect to cell size and viability) to use the same FSC, SSC, and FL settings (Whalen et al., 2002). The acquisition and analysis software for flow cytometry data was CELLQuest v3.3 from BDIS running on a G4 Apple computer.
Western Blot
Cell lysates from NK cells treated with control, 10 nM, 5 nM, 2.5 nM, 1 nM and 0.5 nM PMA for 24 h prior to lysis were run on 10% SDS-PAGE (sodium dodecylsulfate polyacrylamide gel electrophoresis) and transferred to PVDF (polyvinylidene Difluoride) membrane. The PVDF was immunoblotted with specific primary antibodies to either CD16, granzyme B, perforin, or β-actin. Antibodies were visualized using the ECL chemiluminescent detection system (Amersham, Piscataway, NJ) and a Kodak Image Station (Kodak, Rochester, NY). The density of each protein band was determined by densitometric analysis using the Kodak Image Station analysis software. A given experimental set-up always had its own internal control. Thus, differences in protein expression were determined relative to the internal control. β-actin levels were determined for each condition to verify that equal amounts of protein were loaded. In addition, the density of each protein band was normalized to β-actin to correct for small differences in protein loading among the lanes (Aluoch and Whalen, 2005).
RNA isolation and real-time quantitative RT-PCR
Human NK cells were isolated from whole blood as described in the section under NK cell isolation, treated with the compounds of interest for the desired lengths of time before proceeding with total RNA extraction. Total RNA was extracted using an RNeasy mini kit (Qiagen; Valencia, CA) and its concentration determined by reading the optical density at 260 nm. Possible genomic DNA contamination was removed by on-column DNase digestion using the RNase–free DNase set. Two million NK cells per treatment condition were used. Samples were diluted in RNase-free water to 15 ng/uL and stored in micro-centrifuge tubes at −80 °C. Real-time quantitative RT-PCR (qRT-PCR) was performed with an iCycler iQ System. Primers were designed using Primer Express 2.0 software (ABI). Primers were designed in such a way that they included at least one intron-exon junction so as to increase the specificity for the target genes and to minimize the amplification of closely related genes. Genes of interest were compared to closely related genes using BLAST and primers were designed based on divergent regions of the target gene sequence compared to those of the highly related genes (primer sequences are shown in Table 1). The QuantiTect SYBR green RT-PCR kit (Qiagen) and gene-specific PCR primers were used in a 20 μL reaction following protocols recommended by the manufacturer. To ensure that there is no significant difference in the concentration of total RNA in each sample, 18s RNA was analysed by qRT-PCR.
Table 1.
Quantitative RT -PCR (TaqMan) Primers
| Gene | Primer Sequence | Amplicon Size (bp) |
|---|---|---|
| 18S RNA | Forward 542F TCGAGGCCCTGTAATTGGAA Reverse 602R CCCTCCAATGGATCCTCGTT |
71 |
| Granzyme | Forward 68F TGCAACCAATCCTGCTTCTG Reverse 134R CCGATGATCTCCCCTGCAT |
67 |
| Perforin | Forward 1638F CTCCTTGGCACCTGTGATCAG Reverse 1706R GCCATGATTCAGGTTGCATCT |
69 |
| Beta-Actin | Forward 421F AAGGCCAACCGCGAGAA Reverse 500R ACAGCCTGGATAGCAACGTACA |
80 |
Generally, the PCR mixture (20 μL) contained 30 ng of total RNA and 0.2 μM each primer, 10 nM fluorescein calibration dye, 0.2 μL RT mix and 10 μL of 2× master mix. . Reverse transcription was performed for 20 min at 50 °C, followed by amplification for 35 cycles (15 s at 94 °C, 60 s at 60 °C) after an initial activation at 95 °C for 15 min. Melting curve analysis was carried out to determine the specificity of amplification. Analysis of results was done using the comparative Ct method. This involves comparing the Ct values of the samples of interest with a control or calibrator such as a non-treated sample. The comparative Ct method is also known as the delta Ct method, where [delta]Ct = [delta]Ct,sample - [delta]Ct,reference where [delta]Ct,sample is the Ct value for any treated sample and [delta]Ct, reference is the Ct value for the calibrator or untreated sample. The mRNA levels were represented in arbitrary units.
Statistical Analysis
Statistical analysis of the data was carried out utilizing ANOVA and Student’s t test. Data were initially compared within a given experimental setup by ANOVA. A significant ANOVA was followed by pair wise analysis of control versus exposed data using Student’s t test.
RESULTS
Effect of 24 h exposures to 2.5 nM PMA on NK cell-surface protein expression
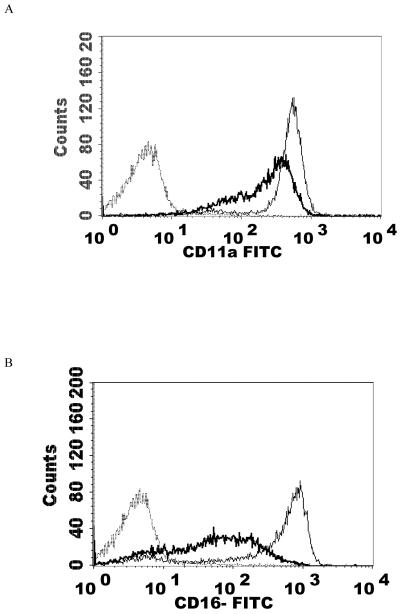
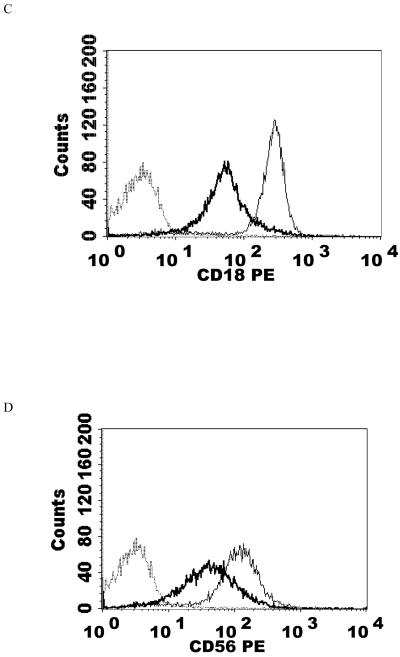
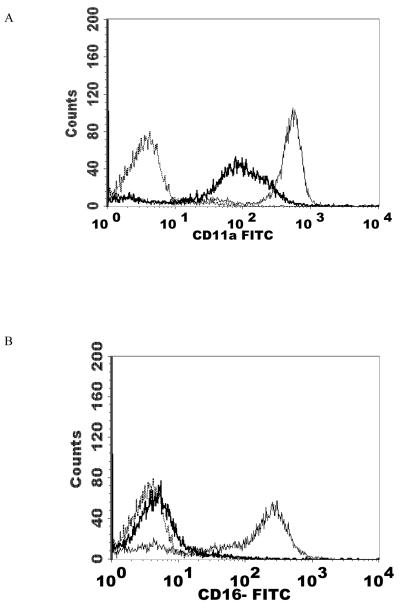
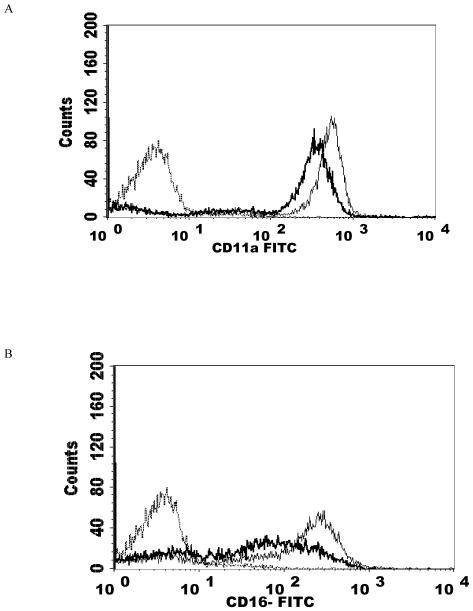
NK cells were treated with 2.5 nM PMA for 24 h and then analyzed using flow cytometry. The expression of CD2, CD11a, CD16, CD18, and CD56 were measured. CD2 levels were not expected to change and served as a negative control. The results are summarized in Table 2. Exposure of NK cells to this concentration of PMA resulted in a significant loss of the cell-surface proteins CD11a, CD16, CD18, and CD56 (P<0.05) compared to the control. 2.5 nM PMA has previously been shown to activate p44/42 in NK cells by approximately 10 fold (Dudimah et al., 2010). The treatment resulted in expression of CD11a at a level of 30% of that seen in control cells (a 70% loss of CD11a), CD16 expression was 17% of control (83% decrease), CD18 was expressed at 37% of control levels (63% decrease), and CD56 expression was 50% of control. This treatment did not result in a decrease in CD2 expression. Figure 1 shows histograms from a representative flow cytometry experiment for each of the cell-surface proteins whose expression was decreased. All studies were carried out at least three times using cells that were prepared from three different donors (n≥3).
Table 2.
Effect of PMA and TBT exposures on human NK cell-surface protein expression
| Treatment | Mean Fluorescence Intensity (Percent of Control) | ||||
|---|---|---|---|---|---|
| CD2 | CD11a | CD16 | CD18 | CD56 | |
| 2.5 nM (24 h Exposure) |
NS | 30±22 | 17±5 | 37±23 | 50±10 |
| 5 nM (1 h exposure followed by 24 h in PMA-free medium) |
NS | 32±10 | 11±5 | 31±8 | NS |
| 2.5 nM (1 h exposure followed by 24 h in PMA-free medium) |
NS | 28±4 | 16±12 | 35±3 | 54±3 |
| 1 nM (1 h exposure followed b y 24 h in PMA-free medium) |
NS | 62±15 | 47±15 | 67±18 | NS |
| 0.5 nM (1 h exposure followed by 24 h in PMA-free medium) |
NS | NS | NS | NS | NS |
| PD + 1 nM (1 h exposure followed by 24 h in PMA-free medium) |
NS | NS | NS | NS | NS |
| 300 nM TBT (1 h exposure followed by 24 h in TBT-free media) |
NS | NS | 70±12 | 89±1 | 62±11 |
| 200 nM TBT (1 h exposure followed by 24 h in TBT-free media) |
NS | NS | 82±9 | NS | 76±5 |
| PD +300 nM TBT (1 h exposure followed by 24 h in TBT-free media) |
NS | NS | NS | NS | 75±11 |
NS- indicates no significant change compared to control. All other changes are significant p<0.05.Values are the mean±S.D. of at least three determination (n≥3) from cells prepared from different donors. PD=MAPK Kinase (MAP2K) inhibitor PD98059
Figure 1.
Effect of a 24 h exposure to 2.5 nM PMA on NK cell-surface protein expression. A) CD11a. Dashed line = IgG isotype control, thin solid line = control NK cells, bold line = PMA treated cells, y-axis is cell number, and the x-axis is fluorescence intensity. B) CD16. C) CD18. D) CD56. Representative histograms are shown. Results were replicated in NK cells prepared from three separate donors, n=3.
Effects of 1 h exposures to 5 nM PMA followed by 24 h in PMA-free media on NK cell-surface protein expression
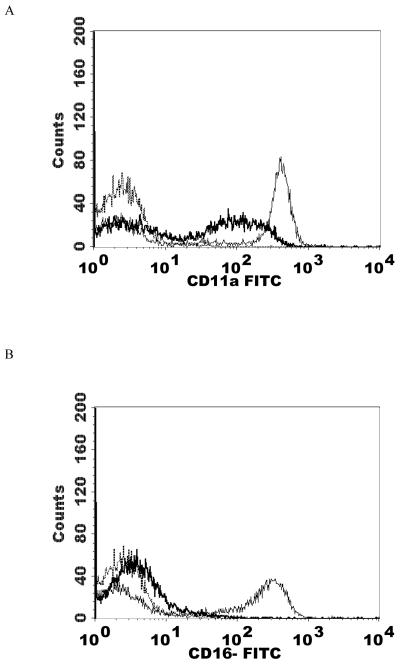
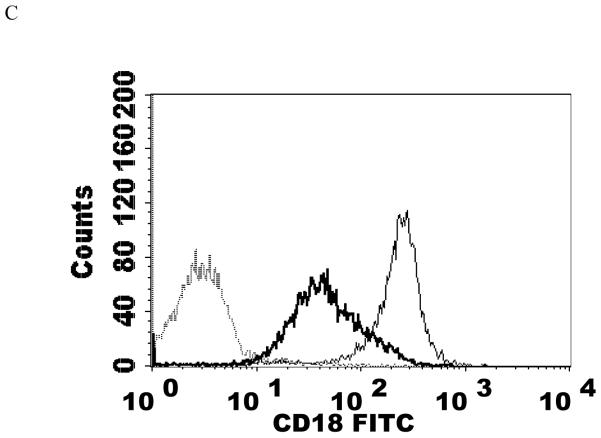
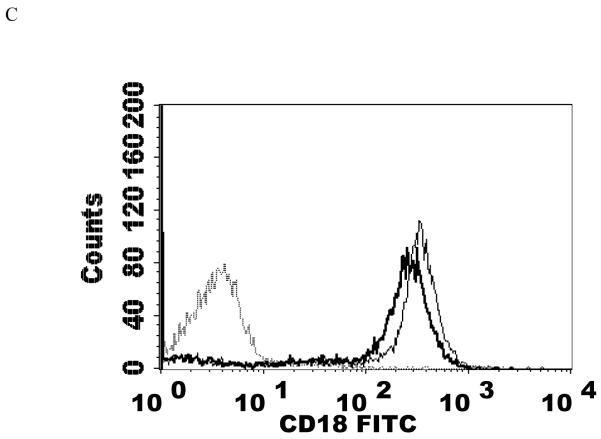
NK cells were exposed to a PMA concentration of 5 nM for 1 h after which the cells were washed twice with media then re-suspended in media for 24 h before flow cytometry analysis. This concentration of PMA resulted in a significant loss of CD11a, CD16, and CD18 expression compared to the control (P<0.05). 5 nM PMA has been shown to activate p44/42 by approximately 12 fold within 10 min (Dudimah et al., 2010). CD11a was expressed at 32% of control levels, while CD16 and CD18 were expressed at 11% and 31% of the levels seen in control cells. Thus, there were reductions of CD11a, CD16, and CD18 in treated cells compared to control cells of 68, 89, and 69% respectively (Table 2). There was again no significant change in CD2 expression. Figure 2 shows histograms from a representative flow cytometry experiment for those proteins whose expression was decreased.
Figure 2.
Effects of a 1 h exposure to 5 nM PMA followed by 24 h in PMA-free media on NK cell-surface protein expression A) CD11a. Dashed line = IgG isotype control, thin solid line = control NK cells, bold line = PMA treated cells, y-axis is cell number, and the x-axis is fluorescence intensity. B) CD16. C) CD18. Results were replicated in NK cells prepared from three separate donors, n=3.
Effects of 1 h exposures to 2.5 nM PMA followed by 24 h in PMA-free media on NK cell-surface protein expression
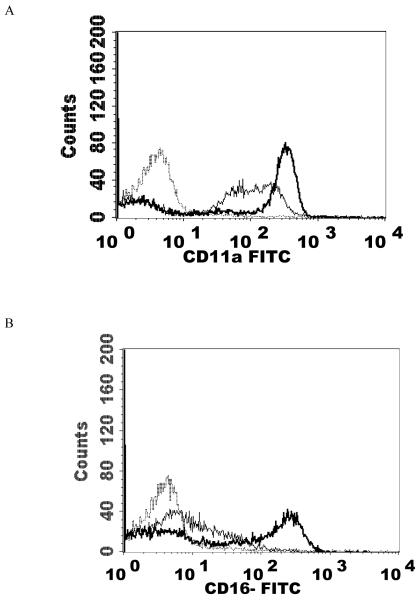
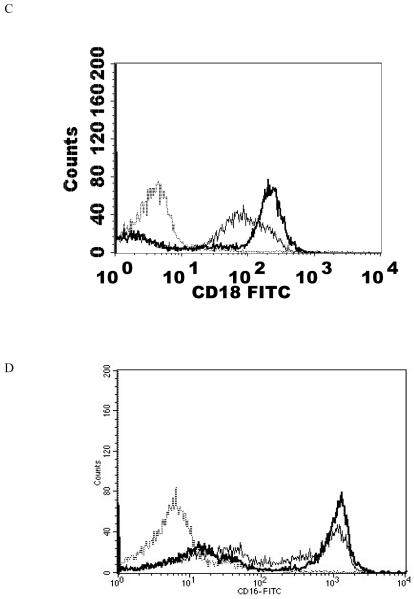
CD11a, CD16, CD18, and CD56 all showed significant reductions in expression compared to control cells (P<0.05) (Table 2). 2.5 nM PMA as mentioned above, caused about 10 fold activation of p44/42 (Dudimah et al., 2010). The only cell-surface protein that was not significantly reduced by this treatment was CD2. Figure 3 shows histograms from a representative flow cytometry experiment.
Figure 3.
Effects of a 1 h exposure to 2.5 nM PMA followed by 24 h in PMA-free media on NK cell-surface protein expression A) CD11a. Dashed line = IgG isotype control, thin solid line = control NK cells, bold line = PMA treated cells, y-axis is cell number, and the x-axis is fluorescence intensity. B) CD16. C) CD18 . D) CD56. Results were replicated in NK cells prepared from 5 separate donors, n=5.
Effects of 1 h exposures to 300 nM and 200 nM TBT followed by 24 h in TBT-free media on NK cell-surface protein expression
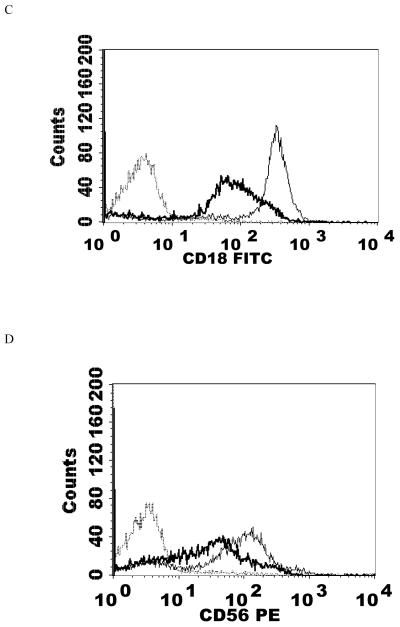
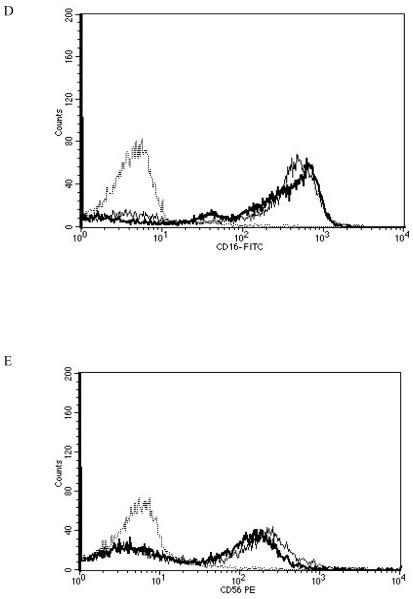
When NK cells were treated with 300 nM TBT for 1 h followed by 24 h in TBT-free media the expression of CD16 was 70% of that seen in control cells. Expression of CD18 was 89% of that seen in control cells and CD56 was present on the NK cell surface at 62% of levels seen in control cells. Thus, there were significant decreases in CD16 (30%), CD18 (11%), and CD56 (38%) expression 24 h following a 1 h exposure to 300 nM TBT (Table 2). Exposure of NK cells to 300 nM TBT causes an average increase in p44/42 activation of about 9 fold (Aluoch et al., 2006). Exposure to 200 nM TBT for 1 h followed by 24 h in TBT- free media led to decreased expression of both CD16 and CD56 (Table 2). CD16 expression was 82% of that seen in control cells while CD56 expression was 76% of that seen in control NK cells. Thus, expression of CD16 was decreased by 18% and that of CD56 was decreased by 24%. The increase in p44/42 activation seen with 200 nM TBT averaged 6 fold above control (Aluoch et al., 2006), which is between that seen with 2.5 and 1 nM PMA. Figure 4 shows data from representative flow cytometry experiments for CD16, CD18, and CD56 for the exposure to 300 nM TBT and CD16 and CD56 for both of the TBT treatments.
Figure 4.
Effects of 1 h exposures to 300 nM and 200 nM TBT followed by 24 h in TBT- free media on NK cell-surface protein expression A) effect of 300 nM TBT on CD16. Dashed line = IgG isotype control, thin solid line = control NK cells, bold line = TBT treated cells, y-axis is cell number, and the x-axis is fluorescence intensity. B) effect of 300 nM TBT on CD18. C) effect of 300 nM TBT on CD56. D) effect of 200 nM TBT on CD16. E) effect of 200 nM TBT on CD56. Results were replicated NK cells prepared from 5 separate donors, n=5.
Effects of 1 h exposures to 1 nM PMA followed by 24 h in PMA-free media on NK cell-surface protein expression
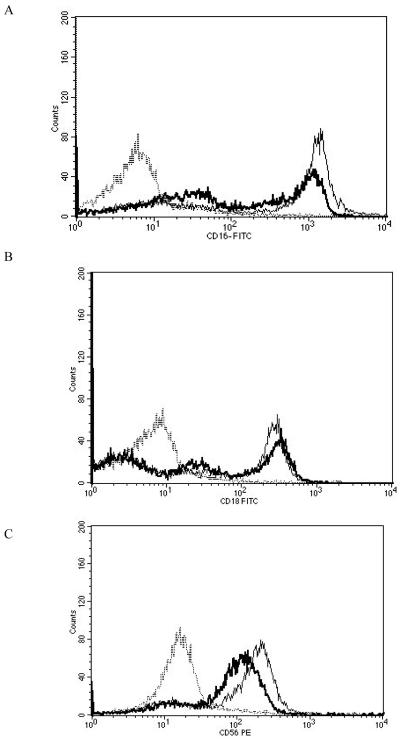
Results from the 1 nM treatment (the average increases in p44/42 activation with 1 nM PMA was 2.3 fold (Dudimah et al., 2010)) did not show a significant loss in CD56 and CD2. However, there were a significant decreases in the expression of C11a, CD16, and CD18 (P<0.05) (Table 2). CD11a expression was 62% of that seen in control cells, while CD16 and CD18 expression were 47% and 67%, respectively, of that seen in control cells. Put in terms of decreases, CD11a decreased by 38%, CD16 by 53%, and CD18 by 33%. Figure 5 shows histograms from a representative flow cytometry experiment.
Figure 5.
Effects of 1 h exposures to 1 nM PMA followed by 24 h in PMA-free media on NK cell-surface protein expression A) CD11a. Dashed line = IgG isotype control, thin solid line = control NK cells, bold line = PMA treated cells, y-axis is cell number, and the x-axis is fluorescence intensity. B) CD16. C) CD18. Results were replicated NK cells prepared from 5 separate donors, n=5.
Effects of 1 h exposures to 0.5 nM PMA followed by 24 h in PMA-free media on NK cell-surface protein expression
When NK cells were treated with 0.5 nM PMA (which causes no significant increases in p44/42 activation (Dudimah et al., 2010)) there was no significant change in any of the cell-surface proteins studied compared to the control.
Effect of 1 nM PMA or 300 nM TBT on NK cells pretreated with p44/42 pathway inhibitor (PD98059) on cell-surface protein expression
NK cells were treated with 50 μM PD98059 (a selective inhibitor of the MAPK kinase (MEK1/2) for p44/42) for 1 h prior to treating with 1 nM PMA for 1 h. The cells were then washed twice with media before they were re-suspended in PMA free media for 24 h before flow cytometry analysis. The results showed that PMA did not cause a significant reduction in cell-surface proteins of NK cells pretreated with PD98059 (Table 2). When NK cells were treated with the MEK1/2 inhibitor 1 h prior to exposure to 300 nM TBT, there were no significant decreases in either CD16 or CD18. The decreases in CD56 while still occurring were reduced (Table 2). Figure 6 shows histograms from a representative flow cytometry experiment.
Figure 6.
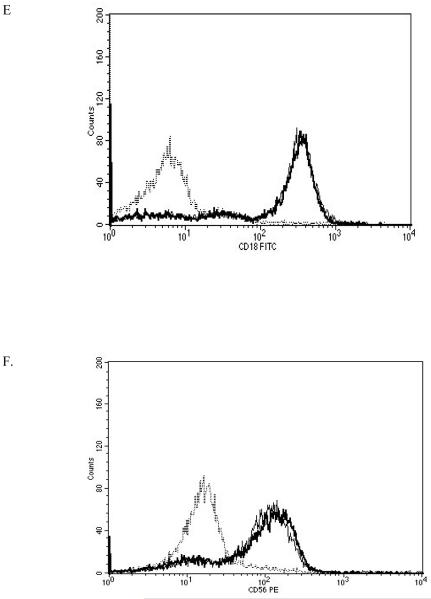
Effects of 1 nM PMA or 300 nM TBT on NK cells pretreated with p44/42 inhibitor (PD98059) on cell-surface protein expression. A) effect of 1 nM PMA on CD11a. Dashed line = IgG isotype control, thin solid line = 1 nM PMA treated cells, bold line = NK cells pretreated with PD98059 before 1 nM PMA treatment, y-axis is cell number, and the x-axis is fluorescence intensity. B) effect 1 nM PMA on CD16. C) effect of 1 nM PMA on CD18. D) effect of 300 nM TBT on CD16. Dashed line = IgG isotype control, thin solid line = 300 nM TBT treated cells, bold line = NK cells pretreated with PD98059 before 300 nM TBT treatment, y-axis is cell number, and the x-axis is fluorescence intensity. E) effect of 300 nM TBT on CD18. F) effect of 300 nM TBT on CD56. Results were replicated in NK cells prepared from 3 separate donors, n=3.
Effects of 24 h exposures to PMA on the levels of total CD16 protein expression in NK cells
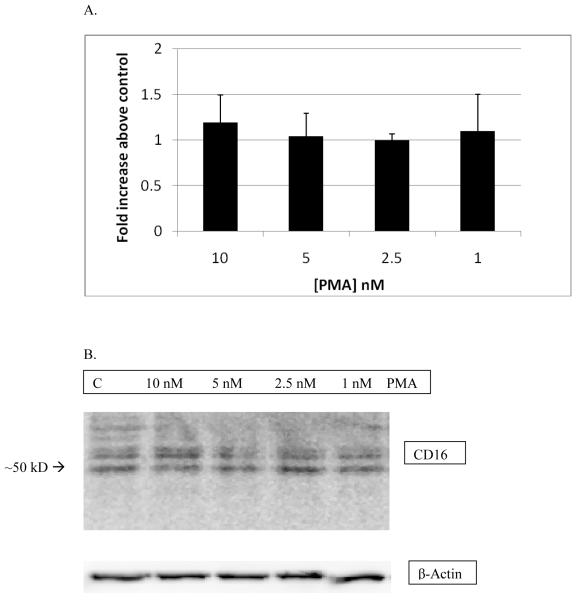
NK cells were exposed to PMA concentrations between 10 and 1 nM for 24 h before western blot analysis. The results from this treatment did not show any significant changes in CD16 protein expression compared to the control. Thus, although there were very significant decreases in the expression of CD16 at the cell surface with PMA exposures of 24 h (Table 2), there were no significant decreases in the total amount of CD16 present in the NK cells. Figure 7A shows the combined results from three separate experiments and Figure 7B show results from a representative experiment.
Figure 7.
Effects of 24 h exposures to 10-1 nM PMA on levels CD16 in pure NK cells: A) The band densities for the PMA-treated cells were normalized to control and are given as fold increase over the control There was no statistically significant change in CD16 expression as compared to control. Values are mean ± S.D. from at least three separate experiments. B) Representative western blot of total CD16 expression after 24 h exposure of NK cells to PMA. Results were replicated in NK cells prepared from 3 separate donors, n=3.
Effects of 24 h exposures to PMA on the levels of granzyme B and perforin mRNA and protein levels in NK cells
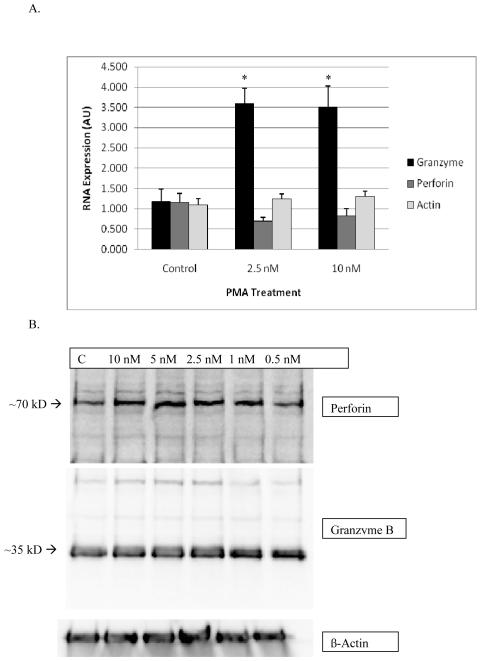
There was a significant increase in granzyme mRNA expression for both the 10 and 2.5 nM treated samples compared to the control samples. Both the 10 and 2.5 nM concentrations resulted in about 3 fold increase in mRNA compared to the control. There was no significant change in perforin mRNA expression compared to the control. Results are shown in Figure 8A. Figure 8B shows that neither granzyme B nor perforin protein levels were altered by exposures to a range of PMA concentrations for 24 h, data are from a representative experiment.
Figure 8.
Effects of exposures of human NK cells to PMA on the expression of granzyme B, perforin and beta actin. A) RNA levels in NK cells were treated with 2.5 and 10 nM of PMA for 24 h before the RT-PCR experiment. Values are mean±S.D. of four different samples from different donors, triplicate determinations, n=12. A significant difference in the expression of RNA in treated cells compared to their respective controls is indicated by an asterisk. The viability of PMA treated cells was identical to that of control cells. B) Protein levels in NK cells treated with 0-10 nM PMA for 24 h. Experiments carried out in 3 separate donors, n=3.
DISCUSSION
Studies with TBT in human NK cells have shown an association of the activation of MAPKs p44/42, p38, and JNK and loss of NK cell lytic function (Aluoch and Whalen, 2005; Aluoch et al., 2006; Aluoch et al., 2007). A separate study showed that selective activation of the p44/42 signaling pathway in NK cells could result in losses of lytic function similar to those seen with TBT, indicating that the TBT-induced activation of p44/42 may be at least in part responsible for the loss of lytic function (Dudimah et al., 2010). In this study, our goal is to elucidate the role that activation of p44/42 plays in regulating the expression of cell-surface proteins in NK cells and to investigate whether p44/42 activation (alone) can cause the TBT-induced changes in NK protein expression (Whalen et al., 2002; Thomas et al., 2004). The concentrations of PMA used were those that gave a similar level of p44/42 activation (Dudimah et al., 2010) as seen with TBT exposures (Aluoch et al., 2006). The proteins studied were those whose levels change when NK cells are exposed to TBT, which include the cell surface proteins CD16, CD18, CD56, and the cytolytic proteins granzyme B and perforin (Whalen et al., 2002; Thomas et al., 2004).
The results showed significant reductions in the expression of CD11a, CD16, CD18 and CD56 with 24 h exposures to PMA as well as 1 h exposures to PMA followed by a 24 h period in PMA-free media (Table 2). When NK cells were pretreated with the p44/42 pathway inhibitor PD98059 prior to a 1 nM exposure to PMA, there was no significant change in the expression of any of the cell-surface proteins, thus establishing that p44/42 activation was responsible for the decreased cell-surface protein expression seen with this PMA exposure. The higher concentrations of PMA were also tested for reversal of their effects on cell-surface proteins by PD98059. The effects of these concentrations of PMA could not be fully reversed. These results indicated that there may be other effects of PMA on NK cells that occur at higher concentrations of PMA, which are not due to its effects on p44/42. PMA is known to be a potent activator of protein kinase Cs (PKCs) (Liu and Heckman, 1998) and the activation of PKC in NK cells may have effects on cell surface protein expression.
Exposure of NK cells to 300 nM TBT for 1 h followed by 24 h in TBT-free media caused alterations of CD16 and CD18 expression that were in the same direction as were seen with 1 h exposures to 1 nM PMA and/or 2.5 nM PMA followed by 24 h in PMA-free media although the magnitude of the changes was different. 1 nM PMA decreased both CD16 and CD18 to a greater extent than did 300 nM TBT (Table 2). The decrease in CD56 seen with 300 nM TBT was not seen with 1 nM PMA however, a decrease in CD56 of slightly greater magnitude was seen at 2.5 nM PMA (Table 2).
The fact that the decreases in CD18 and CD16 seen with exposure to 300 nM TBT for 1 h followed by 24 h in TBT-free media were due to activation of p44/42 was verified by the fact that the p44/42 pathway inhibitor PD98059 prevented these decreases. The TBT-induced decreases in CD56 were lessened when p44/42 activation was blocked, but not completely remediated. Again, these results indicate that the decreases in CD16 and CD18 seen with TBT appear to be due to the activation of p44/42. The decreases in CD56 appear to be in part due to p44/42 activation, however it appears that another consequence of TBT exposures such as p38 or JNK activation may also be responsible for TBT-induced decreases in CD56 (Aluoch and Whalen, 2005; Aluoch et al., 2006).
We went on to examine if total CD16 levels or only cell-surface expression of CD16 was being affected by p44/42 activation. Western blot analysis of NK cells exposed to PMA showed no decreases in CD16. Since CD16 protein levels did not change, the loss of CD16 cell-surface protein with the same PMA exposures suggests that the loss at the cell surface may be due to a disruption of trafficking of the proteins to the cell-surface. These data suggest that p44/42 in involved in the regulation of the movement of at least CD16 to and/or from the plasma membrane. Other studies have indicated that activation of phosphatidylcholine (PC)-specific phospholipase C may play a role in the internalization of CD16 from the plasma membrane to the cytoplasmic compartment (Cecchetti et al., 2007). The current study indicates that p44/42 may be playing a role in the trafficking of CD16 NK-cell-surface proteins between the cytoplasmic compartment and the plasma membrane. CD16 has a role as an activating receptor of the NK lytic process with antibody coated (Lotzova, 1993) and tumor targets (Mandelboim et al., 1999), while CD18 and CD56 appear to be important in the binding of NK cells to targets (Lotzova, 1993). As a result of reduced expression of CD16 caused by p44/42 activation, the ability of NK cells to kill target cells could be compromised (Mandelboim et al., 1999).
In past studies we have found that TBT induced decreases not only in cell surface proteins such as CD16, CD18, and CD56 (Whalen et al., 2002), but also the cytolytic proteins, granzyme B and perforin (Thomas et al., 2004). The decreases in expression of granzyme B and perforin in response to a 1 h exposure to 300 nM TBT followed by 24 h in TBT-free media were seen both at the level of total protein and mRNA (Thomas et al., 2004). In an effort to determine the role (if any) that TBT–induced activation of p44/42 played in TBT-induced decreases in granzyme B and perforin, we looked at the effects of selectively activating p44/42 using PMA on both protein expression and mRNA expression. Unlike exposure to TBT (Thomas et al., 2004), PMA caused no measureable change in the protein expression of granzyme B or perforin (Figure 8B). Additionally PMA caused no significant changes in the expression of the mRNA for perforin (Figure 8A). However, the expression of mRNA for granzyme B was 3 times greater in PMA exposed cell as in the control (Figure 8A). These results indicated that while the transcription of granzyme was increased by p44/42 activation this does not result in increased levels of expression of the protein. One explanation for this may be that the stability of the mRNA is decreased when p44/42 is activated leading to no net increase in granzyme levels in the cell. It may also be that p44/42-stimulated release of cytolytic granules (Trotta et al., 1998) is just being compensated for by the increase in synthesis and thus no net increase is seen. These results also suggest that other molecular consequence of TBT exposures (beyond p44/42 activation) are involved in the TBT-induced changes in the levels of the cytolytic proteins. We have shown in past studies that TBT also activates the MAPK, p38 (Aluoch et al., 2006) and causes an influx of extracellular calcium into the NK cell (Lane et al., 2010), which may explain the divergence of TBT and PMA effects on these proteins.
In summary the results of the current study show: 1) cell-surface expression of CD11a, CD16, CD18, and CD56 in human NK cells is regulated by the MAPK, p44/42. 2) TBT-induced decreases in CD16, and CD18 appear to be attributable to the TBT-induced activation of p44/42 and TBT-induced decreases in CD56 appear to be only partially due to p44/42 activation. 3) changes in cell-surface protein expression of CD16 caused by PMA activation of p44/42 are not due to decreases in the total amount of CD16 in the NK cells, suggesting that p44/42 may be involved in regulating the trafficking of CD16 from the cytoplasmic compartment to the plasma membrane. 4) there is no alteration of expression the cytolytic proteins, granzyme B and perforin in response to activation of p44/42, mRNA for granzyme B was increased by p44/42 activation, indicating that TBT-induced decreases in cytolytic proteins are not due to TBT-induced activation of p44/42.
Acknowledgements
This research was supported by Grant 2S06GM-08092-34 from the National Institutes of Health.
Footnotes
Declaration of Interest: The Authors report no conflicts of interest. The Authors are alone responsible for the content and writing of the paper.
REFERENCES
- Aluoch AO, Whalen MM. Tributyltin-induced effects on MAP kinases p38 and p44/42 in human natural killer cells. Toxicology. 2005;209:263–277. doi: 10.1016/j.tox.2004.12.034. [DOI] [PubMed] [Google Scholar]
- Aluoch AO, Odman-Ghazi SO, Whalen MM. Alteration of an essential NK cell signaling pathway by low doses of tributyltin in human natural killer cells. Toxicology. 2006;224:229–237. doi: 10.1016/j.tox.2006.05.002. [DOI] [PubMed] [Google Scholar]
- Aluoch AO, Odman-Ghazi SO, Whalen MM. Pattern of MAP kinases p44/42 and JNK activation by non-lethal doses of tributyltin in human natural killer cells. Arch. Toxicol. 2007;81:271–277. doi: 10.1007/s00204-006-0155-4. [DOI] [PubMed] [Google Scholar]
- Biron CA, Byron KS, Sullivan JL. Severe herpes virus in an adolescent without natural killer cells. New Engl. J. Med. 1989;320:1731–1735. doi: 10.1056/NEJM198906293202605. [DOI] [PubMed] [Google Scholar]
- Cecchetti S, Spadaro F, Lugini L, Podo F, Ramoni C. Functional role of phosphatidylcholine-specific phospholipase C in regulating CD16 membrane expression in natural killer cells. European Journal of Immunol. 2007;37:2912–2922. doi: 10.1002/eji.200737266. [DOI] [PubMed] [Google Scholar]
- Chang M-S, Chen B-C, Yu M-T, Sheu J-R, Chen T-F, Lin C-H. Phorbol 12-myristate 13-acetate upregulates cyclooxygenase-2 expression in human pulmonary epithelial cells via Ras, Raf-1, ERK, and NF-kB, but not p38 MAPK, pathways. Cellular Signalling. 2005;17:299–310. doi: 10.1016/j.cellsig.2004.07.008. [DOI] [PubMed] [Google Scholar]
- Djeu JY, Jiang K, Wei S. A view to a kill: signals triggering cytotoxicity. Clin. Cancer Res. 2002;8:636–640. [PubMed] [Google Scholar]
- Dudimah FD, Odman-Ghazi SO, Hatcher F, Whalen MM. Effect of Tributyltin (TBT) on the ATP levels in human natural killer cells: Relationship to TBT- induced decreases in NK function. J. Appl. Toxicol. 2007;27:86–94. doi: 10.1002/jat.1202. [DOI] [PubMed] [Google Scholar]
- Dudimah FD, Griffey D, Wang X, Whalen MM. Activation of p44/42 MAPK plays a role in the TBT-induced loss of human natural killer (NK) cell function. Cell Biol. Toxicol. 2010 doi: 10.1007/s10565-010-9154-6. In press. [DOI] [PMC free article] [PubMed] [Google Scholar]
- Fleisher G, Koven N, Kamiya H, Henle W. A non-X-linked syndrome with susceptibility to severe Epstein-Bar virus infections. J. Pediatr. 1982;100:727–730. doi: 10.1016/s0022-3476(82)80572-6. [DOI] [PubMed] [Google Scholar]
- Ghoneum M, Hussein AE, Gill G, Alfred LJ. Suppression of murine natural killer cell activity by tributyltin: in vivo and in vitro assessment. Environ. Res. 1990;52:178–186. doi: 10.1016/s0013-9351(05)80252-x. [DOI] [PubMed] [Google Scholar]
- Gismondi A, Jacobelli J, Mainiero F, Paolini R, Piccoli M, Frati L, Santoni A. Cutting Edge: Functional Role for Proline-Rich Tyrosine Kinase 2 in NK Cell-Mediated Natural Cytotoxicity. J. Immunol. 2000;164:2272–2276. doi: 10.4049/jimmunol.164.5.2272. [DOI] [PubMed] [Google Scholar]
- Hanna N. Expression of metastatic potential of tumor cells in young nude mice is correlated with low levels of natural-killer cell mediated cytotoxicity. Int. J. Cancer. 1980;26:675–690. doi: 10.1002/ijc.2910260521. [DOI] [PubMed] [Google Scholar]
- Kannan K, Tanabe S, Tatsukawa R. Occurrence of butyltin residues in certain foodstuffs. Bull. Environ. Contam. Toxicol. 1995a;55:510–516. doi: 10.1007/BF00196029. [DOI] [PubMed] [Google Scholar]
- Kannan K, Tanabe S, Tatsukawa R, Williams RJ. Butyltin residues in fish from Australia, Papua New Guinea and the Solomon Islands. Int. J. Environ. Anal. Chem. 1995b;61:263–273. [Google Scholar]
- Kannan K, Tanabe S, Iwata H, Tatsukawa R. Butyltins in muscle and liver of fish collected from certain Asian and Oceanian countries. Environ. Pollut. 1995c;90:279–290. doi: 10.1016/0269-7491(95)00028-p. [DOI] [PubMed] [Google Scholar]
- Kannan K, Senthilkumar K, Giesy JP. Occurrence of butyltin compounds in human blood. Environ. Sci. Technol. 1999;33:1776–1779. [Google Scholar]
- Kiessling R, Haller O. Natural killer cells in the mouse, an alternative surveillance mechanism? Contemp. Top. Immunobiol. 1978;8:171–201. doi: 10.1007/978-1-4684-0922-2_6. [DOI] [PubMed] [Google Scholar]
- Kimbrough RD. Toxicity and health effects of selected organotins compounds: a review. Environ. Health Perspect. 1976;14:51–56. doi: 10.1289/ehp.761451. [DOI] [PMC free article] [PubMed] [Google Scholar]
- Lane R, Ghazi SO, Whalen MM. Increases in cytosolic calcium ion levels in human natural killer cells in response to butyltin exposure. Archives of Environmental Contamination and Toxicology. 2009;57:816–825. doi: 10.1007/s00244-009-9313-z. [DOI] [PMC free article] [PubMed] [Google Scholar]
- Liu WS, Heckman CA. The sevenfold was of PKC regulation. Cell Signal. 1998;10:529–542. doi: 10.1016/s0898-6568(98)00012-6. [DOI] [PubMed] [Google Scholar]
- Lotzova E. Definition and function of natural killer cells. Natural. Immun. 1993;12:177–193. [PubMed] [Google Scholar]
- Mandelboim O, Malik P, Davis DM, Jo CH, Boyson JE. Human CD16 as a lysis receptor mediating direct natural killer cell cytotoxicity. Proc. Natl. Acad. Sci. USA. 1999;96:5640–5644. doi: 10.1073/pnas.96.10.5640. [DOI] [PMC free article] [PubMed] [Google Scholar]
- Orange JS. Formation and function of the lytic NK-cell immunological synapse. Nat. Rev. Immunol. 2008;8:713–725. doi: 10.1038/nri2381. [DOI] [PMC free article] [PubMed] [Google Scholar]
- O’Shea J, Ortaldo JR. The biology of natural killer cells: Insight into the molecular basis of function. In: Lewis CE, McGee JOD, editors. The Natural Killer Cell. IRL Press; Oxford: 1992. pp. 1–40. [Google Scholar]
- Roper WL. Toxicological profile for tin. U.S. Department of Health and Human Services. Agency for Toxic Substances and Disease Registry; USA: 1992. [Google Scholar]
- Thomas LD, Shah H, Green SA, Bankhurst AD, Whalen MM. Tributyltin exposure causes decreased granzyme B and perforin levels in human natural killer cells. Toxicology. 2004;200:221–233. doi: 10.1016/j.tox.2004.04.002. [DOI] [PubMed] [Google Scholar]
- Trinchieri G. Biology of natural killer cells. Adv. Immunol. 1989;47:187–376. doi: 10.1016/S0065-2776(08)60664-1. [DOI] [PMC free article] [PubMed] [Google Scholar]
- Trotta R, Fettucciari K, Azzoni L, Abebe B, Puorro KA, Eisenlohr LC, Perussia B. Differential Role of p38 and c-Jun N-Termination Kinase 1 Mitogen-Activated Protein Kinases in NK Cell Cytotoxicity. Immunol. 2000;165:1782–1789. doi: 10.4049/jimmunol.165.4.1782. [DOI] [PubMed] [Google Scholar]
- Trotta R, Puorro K, Paroli M, Azzoni L, Abebe BA, Eisenlohr LC, Perussia B. Dependence of Both Spontaneous and Antibody-Dependent, granule exocytosis-mediated NK Cell Cytotoxicity on Extracellular Signal-Regulated Kinases. J. Immunology. 1998;152:6648–6656. [PubMed] [Google Scholar]
- Tryphonas H, Cooke G, Caldwell D, Bondy G, Parenteau M, Hayward S, Pulido O. Oral (gavage), in utero and post-natal exposure of Sprague-Dawley rats to low dosed of tributyltin chloride: Part II: effects on immune system. Food and Chemical Toxicol. 2004;42:221–235. doi: 10.1016/j.fct.2003.08.019. [DOI] [PubMed] [Google Scholar]
- Vivier E, Nunes JA, Vely F. Natural killer cell signaling pathways. Science. 2004;306:1517–1519. doi: 10.1126/science.1103478. [DOI] [PubMed] [Google Scholar]
- Wei S, Gamero AM, Liu JH, Daulton AA, Valkov NI, Trapani JA, Larner AC, Weber MJ, Djeu JY. Control of lytic function by mitogen-activated protein kinase/extracellular regulatory kinase 2 (ERK2) in a human natural killer cell line: identification of perforin and granzyme B mobilization by functional ERK2. J. Exp. Med. 1998;187:1753–1765. doi: 10.1084/jem.187.11.1753. [DOI] [PMC free article] [PubMed] [Google Scholar]
- Wester PW, Krajnc EI, van Leeuwen FX, Loeber JG, van der Heijden CA, Vaessen HA, Helleman PW. Chronic toxicity and carcinogenicity of bis(tri-n-butyltin)oxide (TBTO) in the rat. Food Chem. Toxicol. 1990;28:179–196. doi: 10.1016/0278-6915(90)90006-9. [DOI] [PubMed] [Google Scholar]
- Whalen MM, Loganathan BG, Kannan K. Immunotoxicity of environmentally relevant concentrations of butyltins on human natural killer cells in vitro. Environ. Res. 1999;81:108–116. doi: 10.1006/enrs.1999.3968. [DOI] [PubMed] [Google Scholar]
- Whalen MM, Ghazi S, Loganathan BG, Hatcher F. Expression of CD16, CD18 and CD56 in tributyltin-exposed human natural killer cells. Chemico-Biol. Interact. 2002;139:159–176. doi: 10.1016/s0009-2797(01)00297-6. [DOI] [PubMed] [Google Scholar]
- Whalen MM, Loganathan BG, Yamashita N, Saito T. Immunomodulation of Human Natural Killer Cell Cytotoxic Function by Triazine and Carbamate Pesticides. Chemico-Biological Interactions. 2003;145:311–319. doi: 10.1016/s0009-2797(03)00027-9. [DOI] [PubMed] [Google Scholar]
- Yamada S, Fuji Y, Mikami E, Kawamura N, Hayakawa J. Small-scale survey of organotin compounds in household commodities. J. AOAC Int. 1993;76:436–441. [Google Scholar]


