

Abstract
The aim of this study was to assess peripapillary sparing in patients with non-group I Stargardt disease. We suggest this as a useful clinical sign for formulating disease severity. Patients with a diagnosis of Stargardt disease were grouped by electroretinogram (ERG). Fundus autofluorescence was used to assess the peripapillary area for involvement in the Stargardt disease process. From a cohort of 32 patients (64 eyes), 17 patients (33 eyes) demonstrated loss of peripapillary sparing. One of 15 patients in Group I, six of 7 patients in group II and 9 of 10 patients in group III demonstrated peripapillary atrophy. One patient in group II had peripapillary flecks. All patients had at least one mutation detected in the ABCA4 gene. Both mutations were detected in 21 patients. Patients in groups II and III had the earliest ages of onset and the poorest visual acuities. Two novel disease causing mutation in the ABCA4 gene were detected. Our data supports the observation that peripapillary sparing is not universal finding for Stargardt disease and peripapillary atrophy is a useful clinical sign for identifying patients with Stargardt disease who fall into the more severe ERG groups, i.e. groups II and III. The presence of atrophy suggests a continuum of disease between groups II and III. Loss of peripapillary sparing is likely associated with the more deleterious mutations of the ABCA4 gene.
Keywords: Stargardt Disease, Peripapillary Sparing, Peripapillary Atrophy, ABCA4 Disease, Cone-rod dystrophy, Retinal Degeneration
1. Introduction
ABCA4 is the transporter of vitamin A derivatives in the outer segment disk membranes of photoreceptors. In the absence of a functional ABCA4 protein due to mutations in the gene, vitamin A aldehyde forms bisretinoid adducts that are deposited in retinal pigment epithelial (RPE) cells during the process of disc shedding and phagocytosis. Understanding the complex interaction of genotype and phenotype in Stargardt Disease has long frustrated ophthalmologists and geneticists not only because of large phenotypic variability or the description of over 500 disease causing mutations of the ABCA4 gene, but also because the most common mutations of the ABCA4 gene account for only 10% of disease genotypes (Gerth et al., 2002; Hargitai et al., 2005; Klevering et al., 2005; Lewis et al., 1999; Simonelli et al., 2005).
A number of methods for classifying patients with Stargardt disease have been described in the literature (Fishman et al., 1999; Aabert, 1986). Because the appearance of the fundus changes over time and does not correlate well with retinal function, patients have been subdivided into 3 groups based on the findings of the full-field Electroretinogram (ffERG): group I patients have normal rod and cone-mediated ERGs; group II patients have relative loss of generalized cone function; group III patients have both abnormal rod and cone ERGs (Fig. 1). These groups account for 68%, 14% and 17% of Stargardt Disease patients respectively (Lois et al., 2001). Group III patients (those with a combined cone-rod dysfunction) have a poorer visual prognosis as the damage caused by the disease process moves centrifugally and the peripheral retina is destroyed.
Fig. 1.
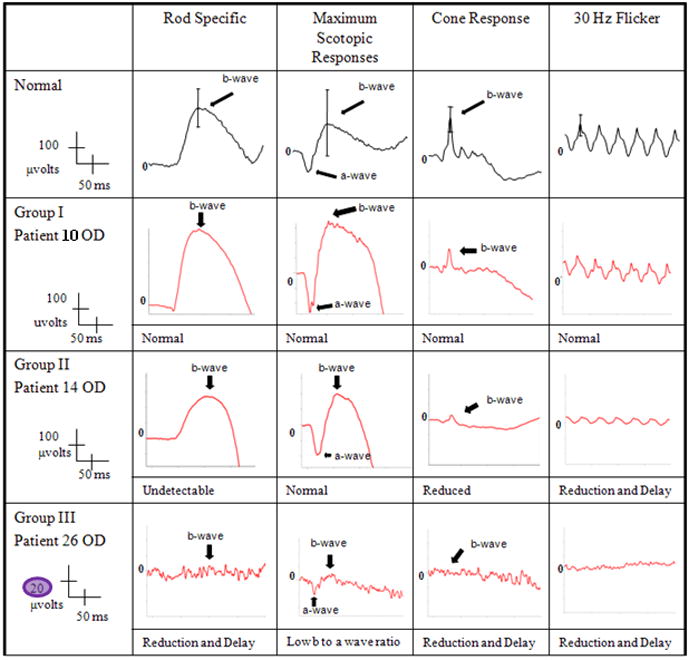
Unilateral electroretinogram tracings of patients with groups I – III Stargardt Disease and a normal control. Patient 10 (group I) demonstrated normal amplitudes and implicit times in both rod and cone systems. Patient 14 (group II) had a reduction in the cone waveforms and a significant implicit time delay. Patient 26 (group III) had subnormal amplitudes in both rods and cones and delay in implicit times. Note the difference in scaling required for visualization of the waveforms for Group III vs. I or II. While these waveforms were not “extinguished” they were markedly reduced. Blink artifact is noted in the in the cone responses of patients14.
As we move to the era of personalized medicine and gene directed therapy, it is younger patients with Stargardt disease, with 2 identified mutations of the ABCA4 gene, classified as belonging to Group III who will be the most appropriate candidates for the initial trials of experimental therapy, where poorer visual prognosis balances potential risk from experimental therapy.
It has long been believed that peripapillary sparing, characterized by absence of flecks and atrophy in this region of the retina, is a pathognomonic sign of Stargardt disease (Cideciyan et al., 2005; Schwoerer et al., 2000; Klein et al., 1978; Lois et al., 2004), although recent reports have shown a small percentage of Stargardt disease patients lose peripapillary sparing (Hwang et al., 2009; Jayasundera et al., 2010). In this case series we have studied patients with Stargardt disease grouped by ERG. We have assessed their peripapillary areas for evidence of involvement in the disease process using autofluorescence and sought to determine the prevalence of peripapillary atrophy in the different ERG groups. Due to the relative sparing of the peripapillary area in Stargardt disease this region has been suggested as a region of interest for monitoring treatment effect with future therapies (Cideciyan et al., 2005). In this instance it is important to correlate peripapillary structure with generalized retinal function i.e. autofluorescence with ERG.
2. Materials and methods
2.1. Subjects
We performed a retrospective chart review of patients in the Stargardt disease database at Columbia University. We included only patients with a diagnosis of Stargardt disease, grouped by ERG, who had at least one mutation in the ABCA4 gene detected. Patients without sufficient fundus autofluorescence views of the peripapillary area to identify sparing or atrophy were excluded. Patients with ocular co-morbidities which cause peripapillary atrophy, such as glaucoma or high myopia, were also excluded. All subjects were enrolled with the approval of the Institutional Review Board of Columbia University, and all research was carried out in accordance with the tenets set out in the Declaration of Helsinki. Informed consent was obtained from all patients before their enrollment.
The age of disease onset was recorded for each patient, and was defined as the age at onset of visual symptoms or of first ophthalmic consultation where a diagnosis of Stargardt disease was made – whichever came first. Disease duration (defined as the time past since age of onset/initial diagnosis and time of examination at Columbia University) was also recorded. As age of onset can be subjective we included age at acquisition of fundus autofluorescence images as an objective surrogate parameter for disease duration.
Full medical history and best-corrected Snellen visual acuity with subjective refraction were obtained on all patients. Dilated slit lamp bio-microscopy was performed following intraocular pressure measurement with Goldmann applanation tonometry, together with fundus auto-fluorescence and full-field scotopic and photopic ERGs. Spectral Domain OCT (SD-OCT) of the macula was obtained where available, otherwise Time-Domain OCT (TD-OCT) was used. Each patient had phlebotomy performed for genetic screening.
2.2. Fundus autofluorescence
Fundus autofluorescence imaging was performed using a confocal scanning laser ophthalmoscope (Heidelberg Retina Angiograph 2; Heidelberg Engineering, Dossenheim, Germany) after pupil dilation with topical tropicamide 1%. Fundus autofluorescence imaging was performed using a 30 degree field of view at a resolution of 1536 × 1536 pixels. An optically pumped solid-state laser (488 nm wavelength) was used for excitation and a 495 nm barrier filter was used to block reflected excitation light from the acquired autofluorescence image. A standard procedure was followed for the acquisition of autofluorescence images, including focus of the retinal image in the infrared reflection mode at 820nm, sensitivity adjustment at 488 nm, and acquisition of nine single 30 × 30 degree images which encompass the entire macula and optic disc. The nine single images were computationally averaged to produce a single frame with improved signal to noise ratio. The images from each patient were examined by 3 independent observers to assess the preservation of a uniform annulus of autofluorescence in the peripapillary area. Where there was not agreement the patient was removed from analysis. Absence of hyperfluorescent flecks or hypofluorescence in this area implied preservation of peripapillary sparing. Flecks or “patchy” hypofluorescence were present when the corresponding pattern of non-confluent RPE change was seen in the peripapillary area on autofluorescence. Where a complete or incomplete ring of peripapillary hyperfluorescence was intermittently narrowed and surrounded by confluent hypofluorescence on both sides, a “scalloped” pattern of atrophy was present. The location of these changes in the nasal and/or temporal peripapillary area was recorded. Complete peripapillary atrophy was present when only confluent hypofluorescence was observed in the peripapillary area. Examples of patients with peripapillary sparing and the various patterns of atrophy are shown in figures 2–6. Measurement of the area of geographic atrophy (GA) was also performed. The definition of GA included the criteria of being large (>150 microns in diameter), homogeneous and well demarcated areas of profound hypofluorescence (gray levels within three gray scale values of those found in the optic disc) to distinguish it from smaller areas of less pronounced hypofluorescence (Smith et al., 2009). Area of atrophy was measured by importing the autofluorescence image to Photoshop (Adobe Systems Inc., San Jose, CA). The distance between the central macula and optic disc edge was taken as 3000 microns. Using this as a reference the area of a pixel in microns squared was calculated for each image. The “wand” tool was used to select the area of GA in pixels. This was recorded in square millimeters (mm2). The location of GA and flecks were described as being macular and/or extramacular.
Fig. 2.
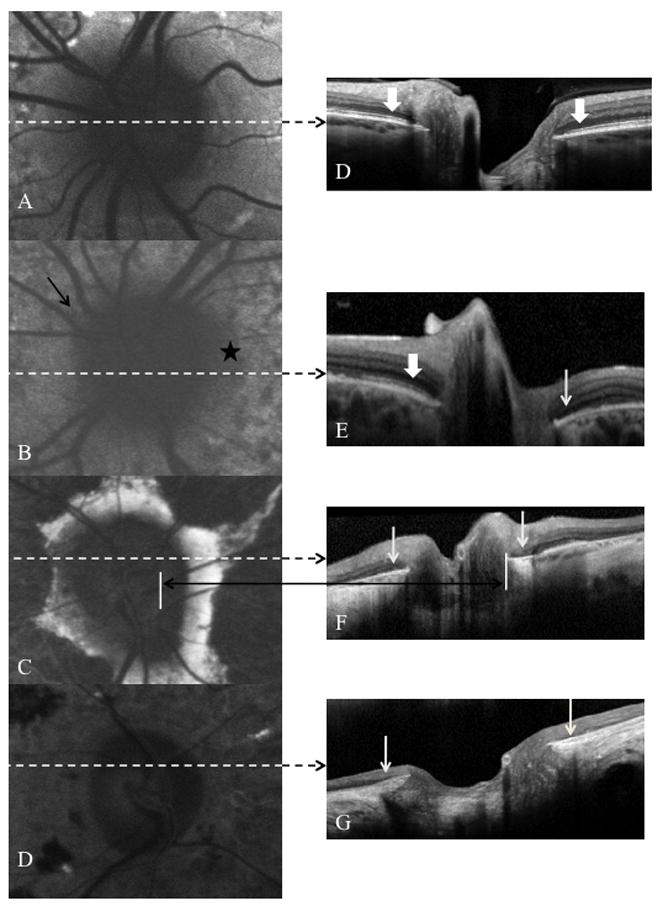
Fundus autofluorescence images A–D correlated with SD-OCT images E–H. Peripapillary sparing was demonstrated on autofluorescence in patient 9 (image A). Note the preservation of the inner segment-outer segment junction (IS-OS) of the photoreceptors on either side of the optic disc (thick white arrows). Images B–D demonstrate the various patterns of peripapillary atrophy and the corresponding loss of the IS-OS over abnormal RPE (slender white arrows) is shown in images E–H for patients 19, 24 and 26 respectively. The black arrow and star on image B indicate areas of “patchy” hypofluorescence. Image C demonstrates the “scalloped” pattern of peripapillary atrophy – note the hypofluorescence between the optic disc edge and the remaining peripapillary hyperfluorescence. Image D shows “complete” peripapillary atrophy.
Fig. 6.
Patient 27 had unilateral patchy peripapillary atrophy – white arrow head points to the superotemporal area of atrophy in the right eye (C). There was preservation of a complete annulus of uniform hyperfluorescence in the left eye (D). Image pair A and B were obtained 2 years earlier. Note the absence of peripapillary atrophy OD. Comparing images A and C, we see the progression of hypofluorescence beyond the superotemporal arcades and around the peripapillary annulus in the right eye over 2 years.
2.3. Ocular Coherence Tomography
SD-OCT scanning of the macula and peripapillary area was performed using the Heidelberg Spectralis (version 1.6.1) where available. Images were viewed with the contained Heidelberg software (Spectralis Viewing Module 4.0.0.0; Heidelberg Engineering). The point-to-point correlation feature of the Heidelberg Spectralis was used to find corresponding pathology between the autofluorescence and the SD-OCT image.
2.4. Electroretinogram
Ganzfield ffERGs (Diagnosys LLC, Lowell, USA) were recorded from both eyes with DTL electrodes according to the International Society for Clinical Electrophysiology of Vision (ISCEV) standards in both scotopic and photopic states to assess retinal function. (Hargitai et al., 2005, Marmor et al., 2004). The minimum protocol incorporates the rod-specific and standard bright flash ERGs, both recorded after a minimum of 20 min dark adaptation. Following 10 min of light adaptation, the photopic 30 Hz flicker cone and transient photopic cone ERGs were recorded. The amplitudes and implicit times obtained from both eyes of each patient were compared to values from age-matched normal controls. An amplitude reduction of 2 standard deviations from the mean for age-matched controls was considered abnormal. An implicit time delay of 2 milliseconds in the 30 Hz flicker was considered significant. Where a patient had normal ERG wave amplitudes but a delay in the implicit time of 2 milliseconds, then a patient was said to fall between ERG groups.
2.5. Genetic Analysis
Screening for mutations in the ABCA4 gene was carried out using the ABCR500 microarray which detects all known (>500) mutations in the ABCA4 gene, and detected mutations were confirmed by direct sequencing (Klevering et al., 2005; Jaakson et al., 2003). In the family with group III Stargardt disease the two affected siblings had their entire ABCA4 genes sequenced after only one mutation was detected with the array.
3. Results
Sixty four eyes of 32 patients were included in the study. Patients 3.1 and 3.2 were identical twin siblings while 3 other families with 2 non-identical siblings each were included (patients 4, 6 and 22). Information for age of onset, age at autofluorescence imaging and duration of disease is summarized in Tables 1 and 2. The mean ages of onset were 21.6, 14.1 and 11.7 years for groups I, II and III, respectively while mean ages at imaging were 32, 27.4 and 35.4 years respectively. Disease durations were 10.5, 13.3 and 23.7 years for the 3 groups, respectively. Visual acuity in group I ranged from 20/20 to 20/200 unilaterally. All visual acuities in group II were 20/150 or worse but for patient 18 who had visual acuities of CF in the right eye and 20/30 in the left eye, while all patients with ERG features of group III disease were below 20/200; 8 of these 10 patients had visual acuities 20/400 or worse bilaterally. All patients demonstrated similar ERG grouping in both eyes. A description of each patient’s ERG relative to age-matched controls is presented in Tables 3 with values from the eye with greatest deviation from normative data included (data from both eyes is presented for patient 27 where there is asymmetry in the pattern of peripapillary autofluorescence). Where rod and cone function was equally affected on ERG, a history of early macular involvement was consistent with cone-rod rather than rod-cone pattern of dysfunction.
Table 1.
Summary of clinical and genetic information for patients with ERG Group I Stargardt Disease.
| Case# | Sex | Mutation Allele 1 | Mutation Allele 2 | PPA | OA (years) | Duration (years) | Age at AF (years) | Visual Acuity | Flecks | Atrophy | GA (mm2) | PPA | |||||
|---|---|---|---|---|---|---|---|---|---|---|---|---|---|---|---|---|---|
| OD | OS | OD | OS | OD | OS | OD | OS | Pattern | RON | ||||||||
| 1 | Male | G1961E | G1961E | - | 19 | 13 | 32 | 20/70 | 20/70 | M | M | M | M | 1.6 | 0.2 | None | |
| 2 | Female | G1961E | * IVS43+1 G>T | - | 8 | 21 | 27 | 20/200 | 20/200 | M | M | M | M | na | na | None | |
| 3.1 | Male | L541P/A1038V | G1961E | - | 28 | 3 | 31 | 20/50 | 20/30 | M | M | M | M | na | na | None | |
| 3.2 | Male | L541P/A1038V | G1961E | - | 28 | 5 | 33 | 20/60 | 20/50 | M | M | M | M | na | na | None | |
| 4.1 | Female | L541P/A1038V | G1961E | - | 14 | 3 | 17 | 20/30 | 20/25 | None | None | None | None | na | na | None | |
| 4.2 | Female | L541P/A1038V | G1961E | - | 14 | 10 | 24 | 20/150 | 20/200 | M | M | M | M | na | na | None | |
| 5 | Female | G1961E | R2077W | - | 25 | 5 | 30 | 20/60 | 20/50 | None | None | M | M | na | na | None | |
| 6.1 | Female | G1961E | L541P/A1038V | - | 18 | 3 | 21 | 20/150 | 20/150 | None | None | M | M | na | na | None | |
| 6.2 | Female | G1961E | L541P/A1038V | - | 15 | 3 | 18 | 20/150 | 20/150 | None | None | M | M | na | na | None | |
| 7 | Female | R602Q | R602Q | - | 31 | 5 | 36 | 20/20 | 20/60 | M,EM | M,EM | M | M | 0.7 | 0.3 | None | |
| 8 | Male | L541P/A1038V | ND | - | 22 | 24 | 46 | 20/200 | 20/200 | M | M | M | M | 13.2 | 4.1 | None | |
| 9 | Femlae | A1038V | ND | - | 27 | 10 | 37 | 20/100 | 20/60 | M,EM | M,EM | M | M | na | na | None | |
| 10 | Female | G1961E | ND | - | 27 | 6 | 33 | 20/150 | 20/150 | M | M | M | M | na | na | None | |
| 11 | Female | G1961E | ND | - | 43 | 24 | 67 | 20/40 | 20/200 | M | M | M | M | 4.8 | na | None | |
| 12 | Male | R212C | ND | OU | 5 | 23 | 28 | 20/200 | 20/200 | M,EM | M,EM | M | M | 1.6 | 4.2 | Patchy | N,T |
Abbreviations: ERG, electroretinogram; PPA, peripapillary atrophy; OD, right eye; OS, left eye; OU, both eyes; OA, onset age; AF, autofluoresence; M, macula; EM, extramacular retina; GA, geographic atrophy; na, not available; RON, relation to optic nerve; N, nasal; T, temporal; ND, mutation was not detected by the ABCR array - suggesting the presence of a currently unknown mutant allele; and
newly described mutation.
Table 2.
Summary of clinical and genetic information for patients with ERG Groups II or III Stargardt Disease.
| Case # | Sex | Mutation Allele 1 | Mutation Allele 2 | PPA | ERG Group | OA (years) | Duration (years) | Age at AF (years) | Visual Acuity | Flecks | GA position | GA (mm2) | PPA | |||||
|---|---|---|---|---|---|---|---|---|---|---|---|---|---|---|---|---|---|---|
| OD | OS | OD | OS | OD | OS | OD | OS | Pattern | RON | |||||||||
| 13 | Female | P1380L | R1640Q | OU | II | 11 | 24 | 35 | HM | HM | EM | EM | M,EM | M,EM | na | na | Complete | - |
| 14 | Male | IVS38-10 T>C | IVS40+5 G>A | OU | II | 7 | 6 | 13 | 20/150 | 20/150 | M,EM | M,EM | M | M | na | na | Flecks | N |
| 15 | Female | M1V/R2030Q | P1380L | OU | II | 8 | 10 | 18 | 20/150 | 20/150 | M,EM | M,EM | M | M | 3.52 | na | Patchy | N,T |
| 16 | Female | P1380L | P1380L | OU | II | 18 | 8 | 26 | 20/400 | 20/400 | M,EM | M,EM | M | M | 0.25 | na | Patchy | N,T |
| 17 | Female | L541P/A1038V | L2027F | OU | II | 10 | 22 | 32 | CF | CF | M,EM | M,EM | M | M | 11.7 | 5.1 | Patchy | N,T |
| 18 | Male | A1773V | ND | - | II | 35 | 6 | 41 | CF | 20/30 | M,EM | M,EM | M | M | 4.2 | 3.7 | - | - |
| 19 | Female | L2027F | ND | OU | I/II | 10 | 17 | 27 | 20/400 | 20/400 | M,EM | M,EM | M | M | 1.6 | 0.1 | Patchy | N,T |
| 20 | Male | R602W | R1300X | OU | III | 8 | 18 | 26 | CF | CF | None | None | M,EM | M,EM | na | na | Scalloped | N,T |
| 21 | Female | C54Y | IVS14+1 G>C | OU | III | 8 | 55 | 63 | CF | HM | EM | None | M,EM | M,EM | na | na | Complete | - |
| 22.1 | Male | 4537delC | * R107X | OU | III | 5 | 8 | 13 | 20/200 | 20/200 | EM | EM | M | M | 2.3 | 1.7 | Patchy | N,T |
| 22.2 | Female | 4537delC | * R107X | - | III | 6 | 2 | 8 | 20/200 | 20/200 | M,EM | M,EM | M | M | na | na | - | - |
| 23 | Male | P1380L | IVS40+5 G>A | OU | III | 29 | 26 | 55 | 20/400 | 20/400 | EM | EM | M,EM | M,EM | na | na | Complete | - |
| 24 | Male | A1598D | A1598D | OU | III | 13 | 40 | 53 | 20/400 | 20/400 | NA | NA | M,EM | M,EM | na | na | Scalloped | N,T |
| 25 | Male | G172S | ND | OU | III | 25 | 7 | 32 | CF | CF | None | None | M,EM | M,EM | na | na | Complete | - |
| 26 | Female | R1108C | ND | OU | III | 9 | 50 | 59 | 20/400 | 20/400 | EM | EM | M,EM | M,EM | na | na | Complete | - |
| 27 | Male | V767D | ND | OD | III | 5 | 10 | 15 | 20/400 | 20/400 | EM | EM | M | M | na | na | Patchy | T |
| 28 | Male | P1380L | ND | OU | II/III | 9 | 21 | 30 | 20/400 | 20/400 | EM | EM | M | M | na | na | Patchy | N,T |
Abbreviations: ERG, electroretinogram; PPA, peripapillary atrophy; OD, right eye; OS, left eye; OU, both eyes; OA, onset age; AF, autofluoresence; M, macula; EM, extramacular retina; GA, geographic atrophy; na, not available; RON, relation to optic nerve; N, nasal; T, temporal; ND, mutation was not detected by the ABCR array, suggesting the presence of a currently unknown mutant allele; and
newly described mutation.
Table 3.
Summary of individual ERGs.
| Photopic Responses |
Scotopic Responses |
|||||||||||||
|---|---|---|---|---|---|---|---|---|---|---|---|---|---|---|
| 30 Hz Flicker | Cone b-wave | Rod b-Wave | Max a-wave | Max b-wave | ||||||||||
| Case # | ERG Group | PPA | Latency (ms) | Delay (ms) | Peak Amp (μV) | Mean - 2 SD | Amp (μV) | Mean - 2 SD | Amp (μV) | Mean - 2 SD | Amp (μV) | Mean - 2 SD | Amp (μV) | Mean - 2 SD |
| 1 | I | - | 27 | NSD | 79.24 | NL | 94.77 | NL | 171.3 | NL | −202.2 | NL | 330.7 | NL |
| 2 | I | - | 26 | NSD | 199.1 | NL | 203.8 | NL | 354.7 | NL | −298.1 | NL | 511.9 | NL |
| 3.1 | I | - | 26 | NSD | 83.22 | NL | 86.25 | NL | 140.6 | NL | −168.7 | NL | 295.3 | NL |
| 3.2 | I | - | 26 | NSD | 216.4 | NL | 129.7 | NL | 247.4 | NL | −206.8 | NL | 415.5 | NL |
| 4.1 | I | - | 27 | NSD | 101.4 | NL | 100.5 | NL | 258.6 | NL | −206.7 | NL | 445.1 | NL |
| 4.2 | I | - | 29 | NSD | 64.4 | NL | 50.39 | NL | 170.4 | NL | −152.6 | NL | 280.2 | NL |
| 5 | I | - | 26 | NSD | 102.7 | NL | 113.7 | NL | 279.4 | NL | −189.2 | NL | 379 | NL |
| 6.1 | I | - | 26 | NSD | 169.6 | NL | 216.6 | NL | 484.5 | NL | −339.6 | NL | 770.5 | NL |
| 6.2 | I | - | 26 | NSD | 136.9 | NL | 214.6 | NL | 515.9 | NL | −481.4 | NL | 935.2 | NL |
| 7 | I | - | 29 | NSD | 150.5 | NL | 205.2 | NL | 250.3 | NL | −189.7 | NL | 366.2 | NL |
| 8 | I | - | 28 | NSD | 148.7 | NL | 169.1 | NL | 254.6 | NL | −225.9 | NL | 400.3 | NL |
| 9 | I | - | 27 | NSD | 126.3 | NL | 152.6 | NL | 259.9 | NL | −342 | NL | 406.7 | NL |
| 10 | I | - | 27 | NSD | 180.1 | NL | 217.2 | NL | 577.7 | NL | −349.1 | NL | 810.1 | NL |
| 11 | I | - | 28 | NSD | 86.54 | NL | 87.44 | NL | 209.1 | NL | −109.8 | NL | 294.9 | NL |
| 12 | I | OU | 29 | NSD | 70.99 | NL | 63.95 | NL | 240.8 | NL | −201.3 | NL | 343.3 | NL |
| 13 | II | OU | 48 | 20 | 4.261 | 92% | 40.35 | 37% | 144 | NL | −33.74 | NL | 62.31 | NL |
| 14 | II | OU | 30 | 2 | 39.47 | 19% | 48.94 | 21% | 279.6 | NL | −193.5 | NL | 390.3 | NL |
| 15 | II | OU | 30.5 | 2.5 | 39.47 | 9% | 67.93 | 5% | 150.5 | NL | −194.2 | NL | 256.3 | NL |
| 16 | II | OU | 33 | 5 | 89.49 | NL | 98.62 | NL | 363.5 | NL | −232.9 | NL | 451.3 | NL |
| 17 | II | OU | 30.5 | 2.5 | 48.6 | 40% | 63.4 | 19% | 197.8 | NL | −152.2 | NL | 274.2 | NL |
| 18 | II | OU | 31 | 3 | 62.32 | NL | 55.46 | 13% | 100.4 | NL | −108.5 | NL | 234.2 | NL |
| 19 | I/II | OU | 30 | 2 | 56.7 | NL | 69.33 | NL | 148.9 | NL | −150.2 | NL | 250.7 | NL |
| 20 | III | OU | 46 | 18 | 5.925 | −89% | 5.105 | −94% | 18.81 | −80% | −49.81 | −46% | 8.2 | −95% |
| 21 | III | OU | 40 | 12 | 5.295 | −93% | 6.719 | −92% | 6.263 | −95% | −8.328 | −97% | 17.27 | −87% |
| 22.1 | III | OU | 40 | 12 | 12.66 | −74% | 10.59 | −83% | 41.9 | −56% | −43.88 | −56% | 64.64 | NL |
| 22.2 | III | - | 40 | 12 | 48.61 | −1% | 57.85 | −7% | 75.36 | −21% | −72.39 | NL | 75.71 | NL |
| 23 | III | OU | 35 | 7 | 23.97 | NL | 23.43 | −72% | 44.15 | −41% | −50.48 | −35% | 55.48 | −58% |
| 24 | III | OU | 32 | 4 | 10.68 | −85% | 9.525 | −88% | 37.86 | −70% | −36.66 | −50% | 12.8 | −90% |
| 25 | III | OU | 40 | 12 | 6.347 | −85% | 7.639 | −90% | 16.45 | −83% | 0 | −100% | 22.85 | −86% |
| 26 | III | OU | 40 | 12 | 4.049 | −94% | 4.576 | −94% | 18.55 | −83% | −24.61 | −66% | 30.43 | −77% |
| 27 OD | III | OD | 30 | 2 | 9.751 | −80% | 13.57 | −78% | 58.83 | −38% | −86.17 | NL | 189.3 | NL |
| 27 OS | - | 30 | 2 | 7.164 | −85% | 7.964 | −87% | 84.39 | −12% | −76.04 | NL | 222.4 | NL | |
| 28 | III | OU | 30 | 2 | 0 | −100% | 7.521 | −12% | 77.49 | −19% | −108.3 | NL | 116.5 | −30% |
Abbreviations: ERG, electroretinogram; PPA, peripapillary atrophy; OD, right eye, OS, left eye; OU, both eyes; ms, milleseconds; Amp, amplitude; NSD, no signficant delay; ND, nondetectable; NL, normal; and SD, standard deviations.
3.1. Genetic Analysis
Disease-associated ABCA4 mutations are listed in Table 1 and 2 for all cases. Both mutations were detected in 21 patients. Only one of the two mutations was identified in 11 other patients. Eight patients had 3 mutations detected, two of these formed a complex allele; i.e., were on the same chromosome. Five patients were homozygous for mutations in the ABCA4 gene, three in group I and one in each of the other ERG groups.
3.2. Electroretinogram Groups
A summary of the latencies and amplitudes for each ERG group are presented in table 4.
Table 4.
Mean Amplitudes and Latencies for ERG Groups
| Mean (+/− SD) | ||||||
|---|---|---|---|---|---|---|
| 30 Hz Flicker | Cone b-wave | Rod b-wave | Max a-wave | Max b-wave | ||
| ERG Group | Lat, ms | Amp, μV | Amp, μV | Amp, μV | Amp, μV | Amp, μV |
| I | 27.1 (1.2) | 127.7 (48.6) | 140.4 (60.1) | 294.3 (131.4) | −244.2 (97.7) | 465.7 (204.9) |
| II | 33.3 (5.5) | 48.6 (57.1) | 63.4 (64.5) | 197.8 (133.4) | −152.2 (111.6) | 274.2 (228) |
| III | 37.3 (5.3) | 12.7 (14.2) | 14.7 (16.1) | 39.6 (25) | − 48.0 (33.8) | 59.3 (56.9) |
Abbreviations: ERG, electroretinogram; Lat, latency; ms, milliseconds; Amp, amplitude; μV, microvolt
3.2.1. Group I
Only one of the 15 patients in this group demonstrated loss of peripapillary sparing. This male patient has the lowest age of onset in the group (5 years of age) and demonstrated widespread involvement of the retina in the Stargardt disease process. Disease duration was 23 years and bilateral visual acuity was 20/200, equal to the lowest in the group. He was 1 of 3 patients in this group with flecks extending to the extramacular retina. He was one of the 5 patients in the group where the areas of atrophy met the criteria for a diagnosis of GA (Table 1). In patient 2 the common missense mutation G1961E co-occurs with the splice site mutation IVS 43+1G>T has not been reported before. Given the predicted effect of the mutation, which is likely to abolish splicing completely and cause a frameshift, we suggest a severe protein dysfunction as a result. This suggestion is strengthened by the observed early age of onset of the disease in this patient. Mean GA areas for the group were 2.2 mm2 and 4.4 mms2 for the right and left eye respectively. The GA area in his right eye was less than the group mean, while that of his left eye was greater than the group mean, suggesting no correlation of GA area with peripapillary atrophy.
3.2.2. Group II
Six of the 7 patients in group II demonstrated peripapillary atrophy and one patient had peripapillary flecks bilaterally (Table 2). These 6 patients had ages of onset of 18 years or less, with five patients diagnosed in the first decade of life. The patients with the best bilateral visual acuity, 20/150 OU, had the youngest ages of onset in the group. Patient 15 had 3 changes of the ABCA4 gene detected: M1V, R2030Q and P1380L. M1V and R2030Q have been previously reported to be synthenic; i.e., form a complex allele, however segregation analysis was not performed in this family due to unavailability of parental DNA. Patient 14, who had the youngest age of onset and duration of disease equal to the shortest in the group, demonstrated no RPE atrophy in the peripapillary area. Instead confluent flecks were seen bilaterally in these areas nasal to the optic discs (Fig. 3). Patient 18 had the best unilateral visual acuity in the group (right eye: CF, left eye: 20/30). SD-OCT demonstrated a residual island of photoreceptors at the fovea of the left eye explaining his visual acuity in this eye. Mean GA areas for the group were 4.3 mm2 and 3 mm2 for the right and left eyes respectively. The GA area of his right and left eyes were close to the means for the group. Hence, the area of GA does not appear to correlate with the presence of peripapillary atrophy, although it is acknowledged by the authors that the number of patients in this group is small.
Fig. 3.
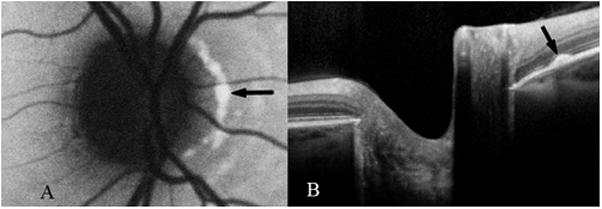
Confluent peripapillary flecks (black arrows) in the right eye of patient 14 (group II) on autofluorescence (A) and SD-OCT (B) images.
3.2.3. Group III
Nine of 10 patients in group III demonstrated peripapillary atrophy. Four patients in this group demonstrated complete loss of autofluorescence in the peripapillary area in the context of extensive RPE atrophy extending outside the macula (Fig. 4). Of these, one patient had disease duration of 7 years while the others had disease duration of 26 years or more. Two patients (20 and 24) demonstrated a scalloped pattern of RPE atrophy, again in the context of widespread atrophy of the RPE, while 3 patients demonstrated patchy peripapillary atrophy. One patient in this group, patient 22.1, had bilateral peripapillary sparing. She was the younger sibling of patient 22.2 who demonstrated patchy peripapillary atrophy. Both of these patients had a frame-shifting deletion, 4537delC, in the ABCA4 gene on one chromosome and previously not reported R107X nonsense mutation on the other chromosome. The combination of the two mutations suggests that these individuals have likely no functional ABCA4 protein. Patient 22.1 had bull’s eye maculopathy bilaterally. Her brother also had evidence of bull’s eye maculopathy with a more uniform hyperfluorescence extending peripherally beyond the arcades, interspersed with areas of hypofluorescence (Fig. 5). He was the only patient in this group where quantification of the area of GA was possible. The six patients with either scalloped or complete peripapillary atrophy in this group had GA extending outside the vascular arcades which made accurate assessment of the area of GA impossible. Patient 27 had unilateral peripapillary atrophy in the right eye with patchy atrophy temporally (Fig. 6). He had evidence of sparing in this region on fundus autofluorescence images from two years earlier. The development of peripapillary atrophy in this patient was seen in the context of centrifugal spread of generalized RPE atrophy over time.
Fig. 4.

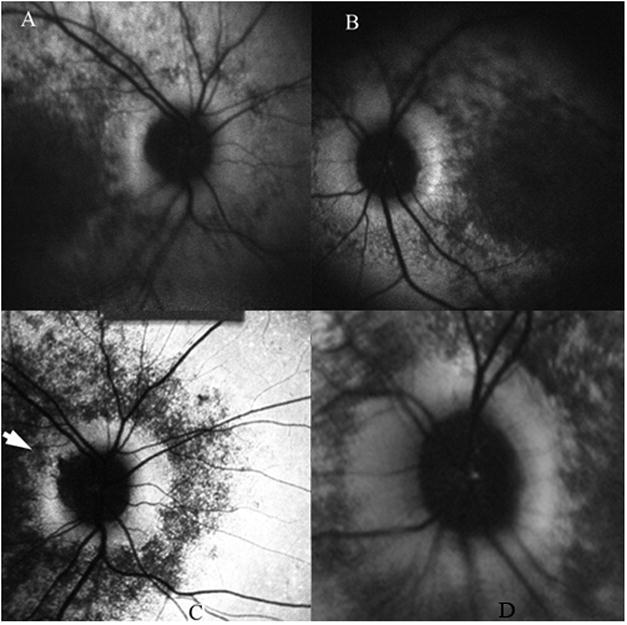
Patient 21 (group III) demonstrated complete atrophy of the RPE and peripapillary atrophy bilaterally on fundus autofluorescence (images A and B). Image C demonstrates pigment migration and clumping against a background of RPE atrophy on fundus photography. These findings correlated with absence of the inner segment-outer segment junction of the photoreceptors and atrophy of the RPE on SD-OCT (image D).
Fig. 5.

Non-identical siblings, patients 22.1 and 22.2 (group III), had bilateral bull’s eye maculopathy. Patient 22.1 (images A and B) had bilateral patchy peripapillary atrophy. Patient 22.2 had no involvement of the peripapillary areas i.e. peripapillary sparing.
4. Discussion
Two recently published case series demonstrated loss of peripapillary sparing in Stargardt disease. One found peripapillary atrophy in 3 of 150 (2%) subjects with Stargardt disease (Hwang et al., 2009). Another series described peripapillary flecks or RPE atrophy in 9 of 135 (7%) Stargardt disease patients. (Jayasundera et al., 2010). ERG groupings were not reported in either series. These findings challenged the previously held consensus that peripapillary sparing, even in the presence of widespread RPE and photoreceptor atrophy, was a consistent finding for Stargardt Disease (Cideciyan et al., 2005; Schwoerer et al., 2000; Klein et al., 1978; Lois et al., 2004). In this study we report loss of peripapillary sparing in 17 of 32 patients (33 of 64 eyes) with various genotypes i.e. 6.7%, 100% and 90% of patients with ERG diagnoses of groups I, II and III Stargardt disease lost peripapillary sparing. If we consider that patients with group I disease have a more favorable prognosis, it is not surprising that peripapillary sparing is almost universal in this group. Also, the type of involvement of the peripapillary area that we see in the single patient with peripapillary loss of sparing in group I disease is not widespread confluent atrophy, but intermittent patchy RPE atrophy, perhaps reflecting resorbed hyperfluorescent flecks as seen in the more peripheral retina.
Contrasting this, the one patient with Group III disease who demonstrated bilateral peripapillary sparing is a younger female sibling of a patient with peripapillary atrophy. While genetically relatively homogenous, her disease duration is 25% (2 vs. 8 years) of that of her affected older sibling. Follow-up imaging of her peripapillary regions will be informative to assess for development of atrophy.
We have shown, contrary to the common conception, a large group of Stargardt disease patients with peripapillary involvement. Interestingly, however, our data still supports the idea that the peripapillary area may be more resilient to the deleterious effects of the defective ABCA4 gene, possibly reflecting the reduced photoreceptor turnover in this area and the more favorable RPE:Photoreceptor ratio (Cideciyan et al., 2005). It is noteworthy that of the 17 patients reported with peripapillary involvement, only 4 had complete loss of peripapillary autofluorescence. Nine patients demonstrated a patchy pattern of hypofluorescence, three had a scalloped pattern of atrophy and 1 demonstrated flecks in the peripapillary area. Furthermore, although our time sequence data is incomplete, two examples are illustrative. Patient 27 developed extensive atrophy of the RPE extending beyond the vascular arcades over a 2 year period, but only the beginning of peripapillary atrophy superotemporally in the right eye (Fig. 6), again suggesting resistance of the peripapillary region. Similarly, patient 20 showed no change in the pattern of peripapillary atrophy over a 2 year period despite progression of peripheral RPE atrophy.
In figure 2 we see an example of loss of the photoreceptor inner segment-outer segment junctions in the peripapillary area corresponding with atrophic hypofluorescence of the RPE. We cannot determine whether the photoreceptor loss preceded development of atrophy of the RPE, however comprehensive fundus autofluorescence and SD-OCT follow-up of the peripapillary area in patients with peripapillary sparing with groups II or III Stargardt disease would be useful in further elucidating this sequence of events.
While ERG group I Stargardt disease can be considered a localized retinal dysfunction based on the electrophysiological findings, widespread hyperfluorescent flecks were seen in 3 patients with group I disease. Of these, it was patient 12 who had the youngest age of onset (5 years of age) and had peripapillary involvement. Where group I patients demonstrate loss of peripapillary sparing, we suggest these patients will have had an earlier age of onset.
There is some debate as to the use of the term Stargardt group III vs. cone-rod dystrophy. In our case series all of the patients in group III had flecks or alternating areas of hyper or hypofluorescence seen on fundus autofluorescence. These findings were consistent with a diagnosis of Stargardt disease primarily with the ERG serving to characterize the extent of photoreceptor dysfunction. Also, as stated above, at least one mutation in the ABCA4 gene was detected in all patients with group III disease, with both mutations detected in 6 patients.
In all three groups the area of GA appears variable and does not correlate well with the presence of peripapillary atrophy. It is important to note, however, that in 1 patient with group II and 6 patients with group III disease with complete or scalloped pattern of peripapillary atrophy, the extensive GA could not be quantified. However, the area of atrophy in these patients is clearly greater than those with peripapillary sparing.
As we enter the era of gene therapy for retinal dystrophies such as Stargardt disease we must begin to ask the question: which patients would be most suitable for Phase I clinical trials? As in ongoing trials for Leber congenital amaurosis, it is appropriate to offer treatment to patients who have a poor visual prognosis, especially since inducing macular detachment will be necessary for appropriate delivery of the therapeutic vector. It may be most appropriate to offer gene therapy to rapidly progressing group III Stargardt disease patients in their early twenties because these patients have, visually, “nothing to lose”. In addition to prospective analysis of the visual field change and electrophysiological progression, the presence of peripapillary atrophy may be a useful clinical sign for a more aggressive ABCA4 disease process.
The loss of peripapillary sparing in all three Stargardt disease groups again raises the question of the phenotype of the disease being a continuum. A recent longitudinal study described ERG progression in Stargardt disease. Three of 13 patients from group I progressed to group II, and one patient to group III. Five of 8 patients from group II progressed to group III (Fujinami et al., 2010). As in our cohort, the number of patients in group II was the smallest of the three groups. We also see that the patients in group II had the lowest average age of onset of the disease. These demographic characteristics support the hypothesis that group II can progress to group III. Prospective studies to correlate loss of peripapillary sparing with progressive ERG changes would be useful in assessing the prognostic value of this clinical sign.
Acknowledgments
The authors wish to thank Ms. Neeco Palmer for performing the electroretinograms presented in this study.
Supported in part by: NIH/NEI (Bethesda, MD) grants EY017404 and EY13435 (RA), R01 EY015520 (RTS), EY015293 (PG), R01 EY018213 (SHT), Eye Surgery Fund (TB), Foundation Fighting Blindness (Owings Mills, MD), New York Community Trust and an unrestricted grant to the Department of Ophthalmology, Columbia University, from Research to Prevent Blindness Inc. (New York, NY), Foundation Fighting Blindness, Schneeweiss Stargardt Fund, and The Starr Foundation. SHT is a Fellow of the Burroughs-Wellcome Program in Biomedical Sciences, and has been supported by the Bernard Becker-Association of University Professors in Ophthalmology-Research to Prevent Blindness Award and Foundation Fighting Blindness, Dennis W. Jahnigen Award of the American Geriatrics Society, Crowley Family Fund, Joel Hoffman Fund, Gale and Richard Siegel Stem Cell Fund, Charles Culpeper Scholarship, Schneeweiss Stem Cell Fund, Irma T. Hirschl Charitable Trust, and Bernard and Anne Spitzer Stem Cell Fund, Barbara & Donald Jonas Family Fund, and Professor Gertrude Rothschild Stem Cell Foundation.
Bibliography
- Aaberg TM. Stargardt’s disease and fundus flavimaculatus: evaluation of morphologic progression and intrafamilial co-existence. Trans Am Ophthalmol Soc. 1986;84:453–487. [PMC free article] [PubMed] [Google Scholar]
- Cideciyan AV, Swider M, Aleman TS, Sumaroka A, Schwartz SB, Roman MI, Milam AH, Bennett J, Stone EM, Jacobson SG. ABCA4-associated retinal degenerations spare structure and function of the human parapapillary retina. Invest Ophthalmol Vis Sci. 2005;46:4739–4746. doi: 10.1167/iovs.05-0805. [DOI] [PMC free article] [PubMed] [Google Scholar]
- Fishman GA, Stone EM, Grover S, Derlacki DJ, Haines HL, Hockey RR. Variation of clinical expression in patients with Stargardt dystrophy and sequence variations in the ABCR gene. Arch Ophthalmol. 1999;117:504–510. doi: 10.1001/archopht.117.4.504. [DOI] [PubMed] [Google Scholar]
- Fujinami K, Michaelides M, Webster AR, Moore AT, Robson AG, Holder GE. A Longitudinal Study of the Electroretinogram Responses in Stargardt-Fundus Flavimaculatus. ARVO E-Abstract. 2010:3272. [Google Scholar]
- Gerth C, Andrassi-Darida M, Bock M, Preising MN, Weber BH, Lorenz B. Phenotypes of 16 Stargardt macular dystrophy/fundus flavimaculatus patients with known ABCA4 mutations and evaluation of genotype-phenotype correlation. Graefes Arch Clin Exp Ophthalmol. 2002;240:628–638. doi: 10.1007/s00417-002-0502-y. [DOI] [PubMed] [Google Scholar]
- Hargitai J, Zernant J, Somfai GM, Vamos R, Farkas A, Salacz G, Allikmets R. Correlation of clinical and genetic findings in Hungarian patients with Stargardt disease. Invest Ophthalmol Vis Sci. 2005;46:4402–4408. doi: 10.1167/iovs.05-0504. [DOI] [PubMed] [Google Scholar]
- Hwang JC, Zernant J, Allikmets R, Barile GR, Chang S, Smith RT, et al. Peripapillary atrophy in Stargardt disease. Retina. 2009;29:181–186. doi: 10.1097/IAE.0b013e31818a2c01. [DOI] [PMC free article] [PubMed] [Google Scholar]
- Jaakson K, Zernant J, Külm M, Hutchinson A, Tonisson N, Glavac D, Ravnik-Glavac M, Hawlina M, Meltzer MR, Caruso RC, Testa F, Maugeri A, Hoyng CB, Gouras P, Simonelli F, Lewis RA, Lupski JR, Cremers FP, Allikmets R. Genotyping microarray (gene chip) for the ABCR (ABCA4) gene. Hum Mutat. 2003;22:395–403. doi: 10.1002/humu.10263. [DOI] [PubMed] [Google Scholar]
- Jayasundera T, Rhoades W, Branham K, Niziol LM, Musch DC, Heckenlively JR. Peripapillary dark choroid ring as a helpful diagnostic sign in advanced stargardt disease. Am J Ophthalmol. 2010;149:656–660. doi: 10.1016/j.ajo.2009.11.005. [DOI] [PubMed] [Google Scholar]
- Klein R, Lewis RA, Meyers SM, Myers FL. Subretinal neovascularization associated with fundus flavimaculatus. Arch Ophthalmol. 1978;96:2054–2057. doi: 10.1001/archopht.1978.03910060442009. [DOI] [PubMed] [Google Scholar]
- Klevering BJ, Deutman AF, Maugeri A, Cremers FP, Hoyng CB. The spectrum of retinal phenotypes caused by mutations in the ABCA4 gene. Graefes Arch Clin Exp Ophthalmol. 2005;243:90–100. doi: 10.1007/s00417-004-1079-4. [DOI] [PubMed] [Google Scholar]
- Lewis RA, Shroyer NF, Singh N, Allikmets R, Hutchinson A, Li Y, Lupski JR, Leppert M, Dean M. Genotype/Phenotype analysis of a photoreceptor-specific ATP-binding cassette transporter gene, ABCR, in Stargardt disease. Am J Hum Genet. 1999;62:422–434. doi: 10.1086/302251. [DOI] [PMC free article] [PubMed] [Google Scholar]
- Lois N, Holder GE, Bunce C, Fitzke FW, Bird AC. Phenotypic subtypes of Stargardt macular dystrophy-fundus flavimaculatus. Arch Ophthalmol. 2001;119:359–369. doi: 10.1001/archopht.119.3.359. [DOI] [PubMed] [Google Scholar]
- Lois N, Halfyard AS, Bird AC, Holder GE, Fitzke FW. Fundus autofluorescence in Stargardt macular dystrophy-fundus flavimaculatus. Am J Ophthalmol. 2004;138:55–63. doi: 10.1016/j.ajo.2004.02.056. [DOI] [PubMed] [Google Scholar]
- Marmor MF, Holder GE, Seeliger MW, Yamamoto S. International Society for Clinical Electrophysiology of Vision. Standard for clinical electroretinography (2004 update) Doc Ophthalmol. 2004;108:107–114. doi: 10.1023/b:doop.0000036793.44912.45. [DOI] [PubMed] [Google Scholar]
- Schwoerer J, Secrétan M, Zografos L, Piguet B. Indocyanine green angiography in Fundus flavimaculatus. Ophthalmologica. 2000;214:240–245. doi: 10.1159/000027498. [DOI] [PubMed] [Google Scholar]
- Simonelli F, Testa F, Zernant J, Nesti A, Rossi S, Allikmets R, Rinaldi E. Genotype-phenotype correlation in Italian families with Stargardt disease. Ophthalmic Res. 2005;37:159–167. doi: 10.1159/000086073. [DOI] [PubMed] [Google Scholar]
- Smith RT, Gomes NL, Barile G, Busuioc M, Lee N, Laine A. Lipofuscin and autofluorescence metrics in progressive Stargardt disease. Invest Ophthalmol Vis Sci. 2009;50:3907–3914. doi: 10.1167/iovs.08-2448. [DOI] [PMC free article] [PubMed] [Google Scholar]