

Abstract
Three dimensional (3D) ophthalmic imaging using optical coherence tomography (OCT) has revolutionized assessment of the eye, the retina in particular. Recent technological improvements have made the acquisition of 3D-OCT datasets feasible. However, while volumetric data can improve disease diagnosis and follow-up, novel image analysis techniques are now necessary in order to process the dense 3D-OCT dataset. Fundamental software improvements include methods for correcting subject eye motion, segmenting structures or volumes of interest, extracting relevant data post hoc and signal averaging to improve delineation of retinal layers. In addition, innovative methods for image display, such as C-mode sectioning, provide a unique viewing perspective and may improve interpretation of OCT images of pathologic structures. While all of these methods are being developed, most remain in an immature state. This review describes the current status of 3D-OCT scanning and interpretation, and discusses the need for standardization of clinical protocols as well as the potential benefits of 3D-OCT scanning that could come when software methods for fully exploiting these rich data sets are available clinically. The implications of new image analysis approaches include improved reproducibility of measurements garnered from 3D-OCT, which may then help improve disease discrimination and progression detection. In addition, 3D-OCT offers the potential for preoperative surgical planning and intraoperative surgical guidance.
1. Introduction
Optical coherence tomography (OCT) has grown to be a clinical standard of care for the assessment of ocular structure since becoming commercially available more than a decade and a half ago. OCT is based on the principles of interferometric detection, in which light echoes backscattered from the retina interfere with light that has traveled to a reference mirror at a known time delay. Echoes from a single point on the retina represent an axial scan (A-scan), and optical cross-sections (B-scans) are obtained by scanning the OCT beam in the transverse direction.
The center wavelength of the light source used for OCT imaging dictates depth of penetration into the retina, and the bandwidth of the light source governs axial resolution. Traditionally, center wavelengths of ~820 nm and bandwidths of ~25 nm have been used for ocular imaging to provide structural details of the inner retina at a resolution of ~8–10 μm. Recently, light sources with longer center wavelengths (1050 nm, 1310 nm) have been employed in addition to the 830 nm sources for enhanced depth penetration (e.g., lamina cribrosa and choroidal imaging) and improved signal quality in subjects with lens opacities.(de Bruin et al., 2008; Huber et al., 2007; Povazay et al., 2007; Puvanathasan et al., 2008; Srinivasan et al., 2008) In addition, broader bandwidth light sources have been integrated into OCT systems to improve axial resolution (Drexler et al., 1999; Lim et al., 2005; Unterhuber et al., 2004) and high-speed scanning is now possible.(Choma et al., 2005; de Boer et al., 2003; Leitgeb et al., 2000; Nassif et al., 2004; Wojtkowski et al., 2005; Zhang et al., 2005) This review focuses on the use of rapid scanning, high-resolution OCT systems for the collection of three-dimensional scans of the retina using systems with center wavelengths in the 800–900 nm range.
1.1. 2D Imaging
Two-dimensional collection of intensity information involves transverse scanning across the retinal region of interest to gradually acquire a series of neighboring A-scans. Taken together, these A-scans comprise B-scans or optical cross-sections of tissue (Figure 1).
Figure 1.
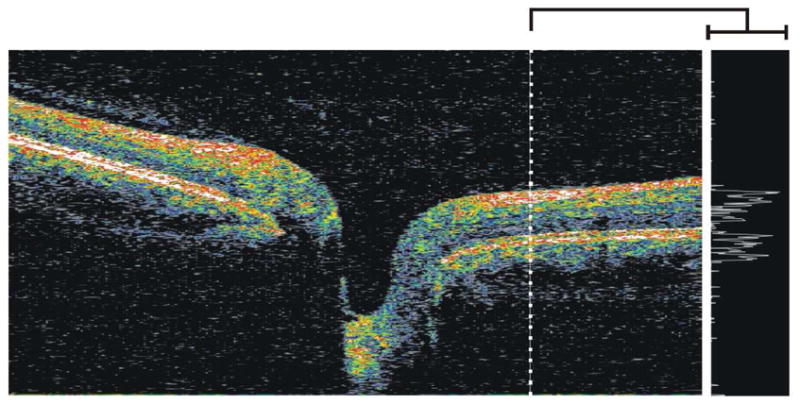
(left) Cross-sectional B-scan through the optic nerve head acquired using SD-OCT, with the white dashed line denoting the location of the single A-scan (right) intensity profile
1.1.1. Time-Domain OCT
The first commercially available OCT device, which uses TD-OCT detection, has an axial resolution of ~10 μm and uses a superluminescent diode centered at 820 nm with a bandwidth of 25 nm. This system acquires two-dimensional optical B-scans at a speed of 400 Hz (400 A-scans/sec). Scanning speed is limited by the speed at which the reference mirror can physically be moved: in time-domain detection, reference mirror position controls the collection of intensity information in depth (A-scan) and defines the spatial location of reflectance data. As neighboring A-scans are acquired, B-scans are generated that consist of 128, 256 or 512 A-scans taken around the optic nerve (peripapillary scan; Figure 2a) or radially through the optic nerve head (ONH) or macula (Figure 2b).
Figure 2.

(A) Location of TD-OCT peripapillary scan shown on fundus photograph (left), and single cross-section OCT B-scan (right). (B) Location of TD-OCT radial macular scan shown on fundus photograph, with six corresponding OCT B-scans and their respective locations
The most common clinically used peripapillary scan protocol in the commercial TD-OCT device acquires three consecutive scans; retinal nerve fiber layer (RNFL) thickness is then measured using automated segmentation analysis and the values of the three scans are averaged. The typical radial scan protocol consists of six B-scans centered on the fovea or optic nerve head, equally separated by 30°, six (macular scan) or four (ONH scan) millimeters long. Similarly, radial scanning through the macular region is used to obtain retinal thickness measurements. Unlike the circumpapillary scan, no averaging of measurements takes place with the radial scan protocol. However, like RNFL measurements, retinal thickness measurements are automatically obtained using automated image segmentation. Scans through the optic nerve are used to derive parameters describing the optic nerve head (ONH), such as cup area, disc area, rim area, cup diameter and disc diameter. ONH measurements require a small amount of user input to ensure that the tips of the retinal pigment epithelium (RPE) or Bruch’s Membrane (BM) are properly delineated.
B-scans acquired with TD-OCT provide qualitative anatomical information that can be used to identify structural abnormalities, as are often observed in retinal pathologies. Quantitative measurements from TD-OCT have been used to detect and monitor diseases such as glaucoma, as described below. One limitation of quantitative measurements obtained with TD-OCT, however, is that very few B-scans comprise the OCT image and those B-scans can be spread out over a relatively broad retinal area. Thus, focal defects or small changes in the retina might not be sampled and can go unnoticed. In addition, when sampling as few as 128 A-scans in a B-scan that is spread out over as much as six millimeters on the retina, interpolation of data is necessary and, again, anatomically important information may be missed.
1.1.2. Fourier-Domain OCT
Fourier-domain detection, which consists of both spectral-domain (SD-OCT) and swept-source (SS-OCT) methods, does not require a moving reference mirror to collect A-scan profiles (Figure 1).(Choma et al., 2005; de Boer et al., 2003; Leitgeb et al., 2000; Nassif et al., 2004; Srinivasan et al., 2008; Wojtkowski et al., 2005; Zhang et al., 2005) Instead, frequency information from all depths at a given point on the retina is acquired simultaneously by a CCD camera and spectrometer (SD-OCT), or by sweeping through a range of frequencies (SS-OCT); frequency data are subsequently translated into intensity information using a Fourier transform. Speeds of up to 312.5 kHz have been accomplished with SD-OCT (Potsaid et al., 2008) and 249 kHz with SS-OCT.(Srinivasan et al., 2008) At the time of this writing, all of the commercially available frequency-domain systems use SD-OCT detection and have superluminescent diode light sources with a corresponding axial resolution of ~5–6 μm and a scanning speed of at most 55 kHz, with the majority scanning at a speed of approximately 27 kHz.
Given the ability for extremely rapid acquisition, 2D B-scans consisting of 1000 A-scans or more can readily be acquired. Most of the commercial SD-OCT systems are taking advantage of the faster scanning speed to acquire high-density cross-sections for improved visualization of retinal structures. This cannot readily be done with TD-OCT due to limitations such as eye movements that take place over the course of the relatively slow scanning.
1.2. 3D Imaging
In three-dimensional OCT (3D-OCT), the collection of intensity information involves the acquisition of several neighboring B-scans. Volumes of data consist of multiple A-scans per B-scan and multiple B-scans per 3D volume. Once a 3D volume has been acquired, an OCT enface (OCT fundus) image can be created by integrating intensity information along the axial direction, such that one summed A-scan represents a single pixel in the OCT fundus image (Figure 3). (Wojtkowski et al., 2005) Much as a photograph contains all backreflected light, an OCT fundus image contains all light backscattered from the retina. Unlike a photograph, however, the OCT fundus image contains the depth information at each pixel, as well as the summed A-scans themselves.
Figure 3.
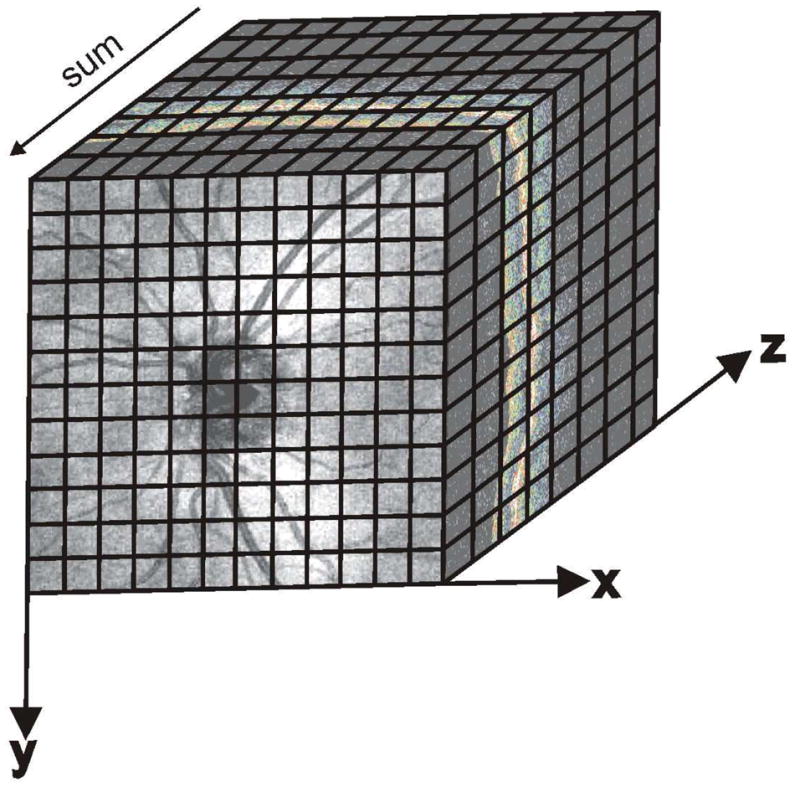
Three-dimensional data cube of the optic nerve head region acquired using SD-OCT, showing Cartesian coordinates of scan location for reference. While this image consisted of 200×200 A-scans, the black lines represent the idea of voxels. The OCT enface image is created by summing individual A-scans.
OCT fundus images make possible a quick assessment of OCT image quality in terms of signal strength, blinking and eye movements. Uneven signal strength is evident in OCT fundus images as regions of low or high reflectivity, while blinking blocks reflectivity signals completely. Continuous structures within the OCT fundus, such as blood vessels, help reveal large eye movements. Eye movement artifact causes vessels appear to be disconnected or distorted. An example of a poor quality OCT fundus image of the ONH region, acquired with SD-OCT, is shown in Figure 4. Large eye movements as well as uneven signal strength are apparent in this image.
Figure 4.
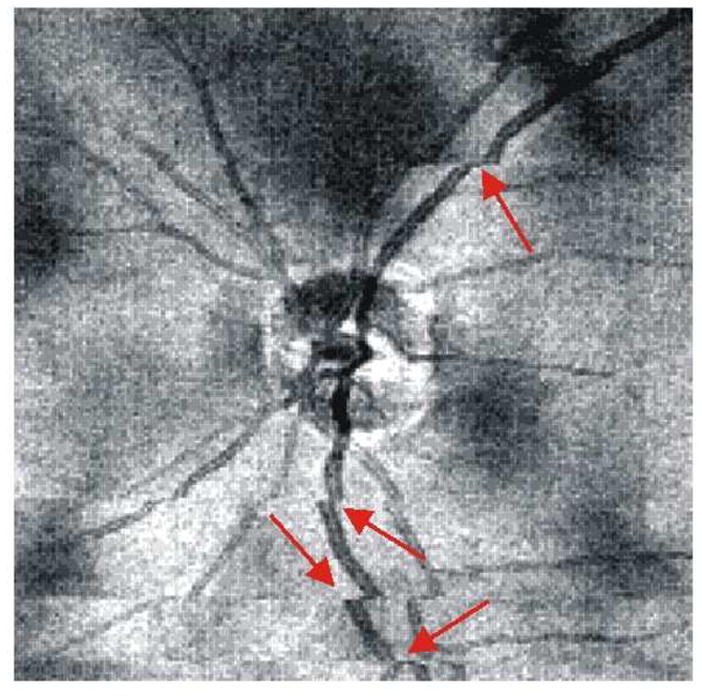
OCT fundus image showing uneven signal strength (dark patches scattered throughout image) and large eye movements (red arrows)
In addition to enabling a quick assessment of eye motion and signal quality, OCT fundus images can be used to precisely register OCT frames to structures present on the image. For example, if a structural abnormality is apparent on an OCT fundus image, the corresponding A-scan information can easily be accessed and evaluated cross-sectionally because the OCT fundus image shows precisely where the cross-sectional image was acquired.
1.2.1. Time-Domain OCT
While the 400 Hz scanning rate used in TD-OCT is convenient for taking peripapillary and radial optical cross-sections, acquiring clinically useful 3D volumes requires several minutes. Figure 5 shows a TD-OCT 3D scan that consisted of 256 × 256 A-scans in a 5 × 5 mm area, which took almost 3 min to acquire. Limitations such as eye movements and blinking throughout acquisition make 3D imaging with TD-OCT impractical. If a subject was able to fixate without blinking for the entire duration of the scan, OCT signal quality would naturally degrade as the cornea dried out during scanning.(Stein et al., 2006) In addition, even with perfect fixation, small eye movements such as tremor, drift and microsaccades occur throughout fixation, and 3D TD-OCT images will have several motion artifacts (see Section 2.1). All of these limitations are evident in Figure 5.
Figure 5.
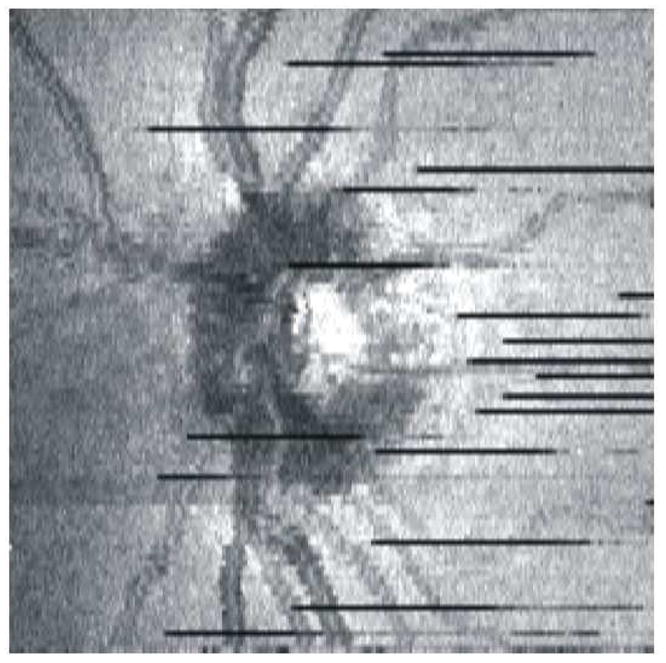
OCT fundus image generated from TD-OCT volumetric data (256×256 A-scans). The scan took almost 3 minutes to acquire, and there are several blinking artifacts (black lines) as well as eye movements.
While it is possible, as an alternative to the 256 × 256 A-scan protocol, to acquire fewer A-scans when capturing a 3D image with TD-OCT, a tradeoff between scan time and scan density exists that would limit the usefulness of a significantly sparser scan. When a denser scan is acquired, the scan duration is longer but more retinal locations are sampled. The scan could be scaled back to 50 × 50 A-scans spread over the same area and would only take 6.25 sec to acquire. However, each A-scan would be 100 μm apart and structural information between neighboring A-scans would be overlooked. Denser scans reduce the need for interpolation between sampling locations by offering more structural detail.
1.2.2. Fourier-Domain OCT
In Fourier-domain imaging, 3D data volumes can be acquired in a matter of seconds, and the effect of eye movements and corneal drying during acquisition is minimized. While there remains a tradeoff between scan time and scan density that is inherent to interferometric detection, as observed in TD-OCT imaging, the much more rapid scanning capabilities afforded by Fourier-domain OCT make 3D acquisition feasible. As such, for the remainder of this review, we will refer to 3D volumetric datasets acquired using Fourier-domain detection as “3D-OCT” images.
An example 3D data volume acquired using SD-OCT can be seen in Figure 3; this image consists of 200 × 200 A-scans spaced over a 6 × 6 mm area, and took 1.48 seconds to acquire. This scan density and acquisition time provide a reasonable compromise for 3D-OCT scanning. Cartesian axes of scanning – x (horizontal), y (vertical) and z (axial) – are presented in Figure 3 for reference. Individual data points within a 3D-OCT image represent one voxel in the 3D data cube, and scanning of a 3D region of interest typically involves scanning in the horizontal direction (fast axis) followed by scanning in the vertical direction (slow axis).
2. Image Analysis and Display
The OCT fundus image is one way to generally assess image quality and visualize the 3D volume of data as whole. While it offers a unique way to visualize pathological conditions, more sophisticated software is required for summarizing 3D data in a meaningful way. Software-based methods for correcting eye motion, registering multiple images from the same eye, segmenting retinal layers, sampling the 3D data volume post hoc and image averaging are all being examined in attempts to extract as much quantitative information as possible. In addition, novel methods to display these 3D-OCT datasets are being developed.
2.1. Eye Motion Compensation
Eye movements such as rapid microsaccades, slow drift, and high-frequency, low-amplitude tremor take place while subjects are fixating in order to keep a target centered on the fovea.(Ditchburn and Foley-Fisher, 1967; Ditchburn and Ginsborg, 1953; Moller et al., 2006; Moller et al., 2002; Ratliff and Riggs, 1950; Schulz, 1984) It is well known that these movements can create artifacts within OCT images by altering the intended location of a scan, and that such artifacts can affect quantitative measurements.(Ferguson et al., 2004; Hammer et al., 2005; Ishikawa et al., 2006)
The effect of eye motion in TD-OCT imaging is difficult to assess because relatively few B-scans are acquired. However, the relatively slow scanning speed with respect to saccade frequency makes TD-OCT images highly susceptible to eye motion artifacts. Eye motion is easier to recognize in 3D-OCT imaging. The OCT fundus images seen in Figures 4 and 5 illustrate that saccades in the x-direction can appear as disconnected blood vessels and shifted tissue. These eye movements follow the fast axis of scanning and can readily be seen on the OCT fundus image. Eye movements in the axial (z-) direction, however, become clear when looking at a vertical frame from the 3D data volume, which is resampled after the data are acquired (see section 2.4). Figure 6 shows a waviness in the resampled vertical OCT scan that can be attributed to the relatively slow acquisition of that post hoc B-scan, which is gradually sampled along the slow scanning axis (y-direction) over the course of many eye movements in the axial direction.
Figure 6.
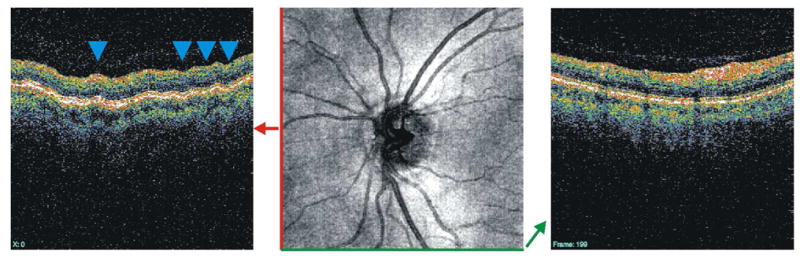
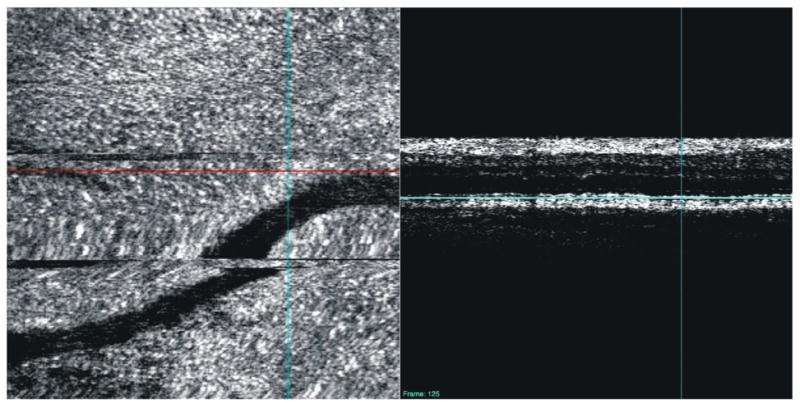
Vertical (left) and horizontal (right) OCT B-scans. The horizontal B-scan is taken along the fast scanning axis, while the vertical B-scan is resampled after the 3D volume has been acquired. The blue arrows point out the waviness that is attributed to axial eye movements that occur while the vertical section is acquired.
2.1.1. Alignment
Eye motion in the horizontal and vertical directions may be addressed using an eye tracking system that recognizes and corrects eye movements by maintaining the stability of scan location throughout eye movements.(Ferguson et al., 2004; Hammer et al., 2005; Ishikawa et al., 2006; Wolf-Schnurrbusch et al., 2008) Once a dataset has been acquired, however, horizontal and vertical eye motion may be corrected by adjusting the location of B-scans using structural landmarks (see section 2.1.2).
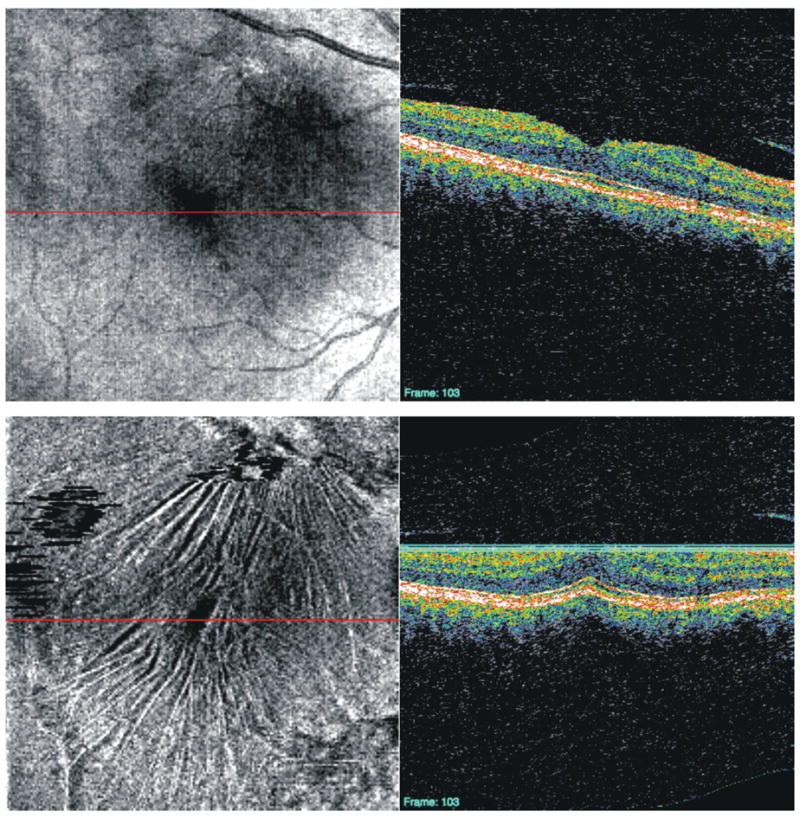
Correcting for motion in the axial direction is more difficult. One way to address axial movements is aligning individual A-scans to a given structure, such as the internal limiting membrane (ILM; Figures 7 and 8) or RPE (Figures 9 and 10), after the image has been acquired. This type of alignment is particularly useful for C-mode sectioning of structures and retinal pathologies (see Section 2.5).(Ishikawa et al., 2009) In addition, cross-correlation techniques can be used to align B-scans and remove axial eye movement artifacts post hoc.(Jorgensen et al., 2007) It is also possible to align individual A-scans within a B-scan frame using cross-correlation.(Sander et al., 2005) This method retains the overall retinal shape and helps improve results of signal averaging across B-scans by aligning structures in the axial direction (see section 2.4).
Figure 7.
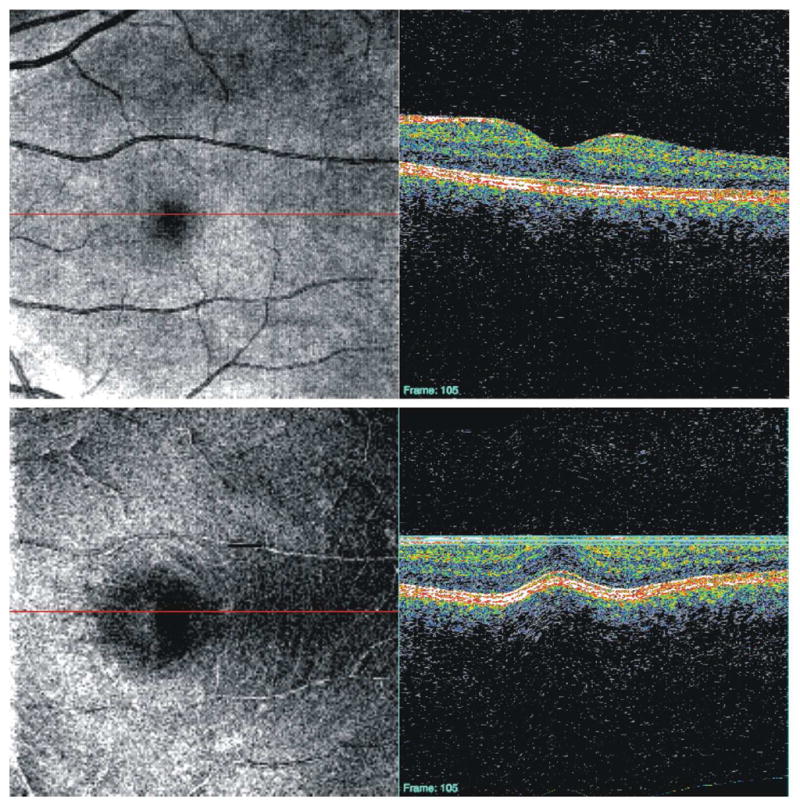
Original 3D-OCT enface image of healthy subject (top), C-mode slice taken after aligning each frame of the 3D-OCT image to the ILM (bottom). The red lines indicate the location of the corresponding cross-sectional scan; the three blue lines indicate the depth of the C-mode section.
Figure 8.
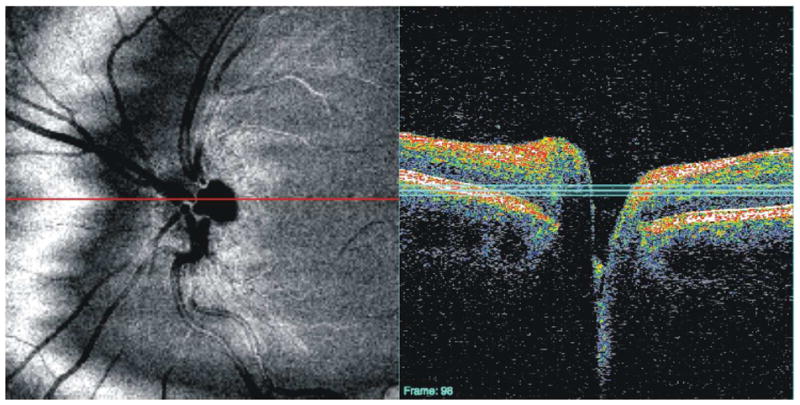
Original 3D-OCT enface image of subject with vitreomacular traction (top), C-mode slice taken after aligning each frame of the 3D-OCT image to the ILM (bottom). The red lines indicate the location of the corresponding cross-sectional scan; the three blue lines indicate the depth of the C-mode section.
Figure 9.
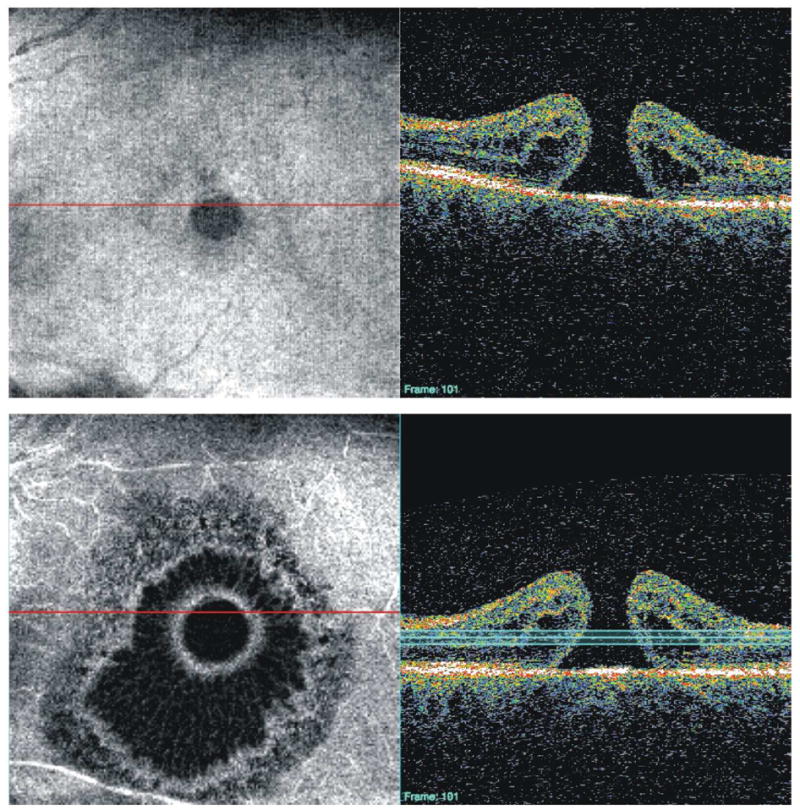
Original 3D-OCT enface image of patient with macular hole (top), C-mode slice taken after aligning each frame of the 3D-OCT image to the RPE (bottom). The red lines indicate the location of the corresponding cross-sectional scan; the three blue lines indicate the depth of the C-mode section.
Figure 10.
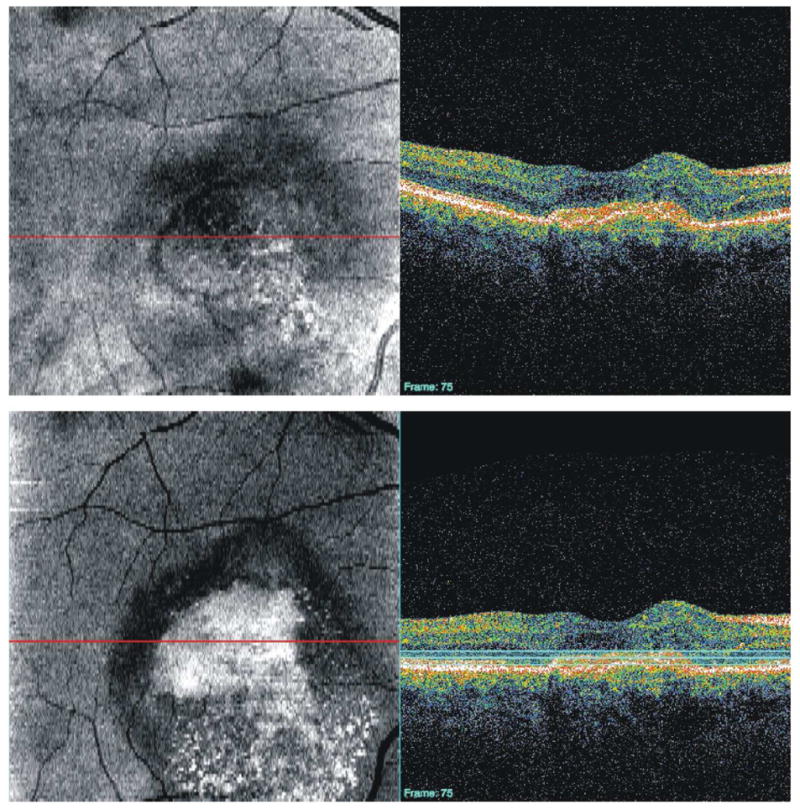
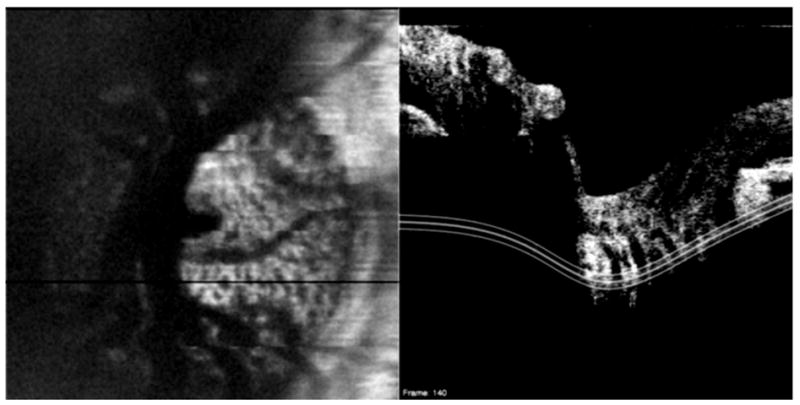
Original 3D-OCT enface image of patient a disciform scar as a result of a wet age-related macular degeneration lesion (top), C-mode slice taken after aligning each frame of the 3D-OCT image to the RPE (bottom). The red lines indicate the location of the corresponding cross-sectional scan; the three blue lines indicate the depth of the C-mode section.
2.1.2. Registration
The commercially available method for glaucoma progression analysis in TD-OCT simply superimposes RNFL profiles taken at different times and displays them on one plot (Figure 11), looking at linear changes in average thickness measurements occurring over time. This method does not account for the variability of the 3.4mm peripapillary scan location that is associated with manual placement of the scan around the ONH by the device operator(s). Varying the location of the peripapillary scan circles has been shown to affect measurement reproducibility, especially when the scan is displaced in the temporal and nasal directions.(Gabriele et al., 2008; Vizzeri et al., 2008)
Figure 11.
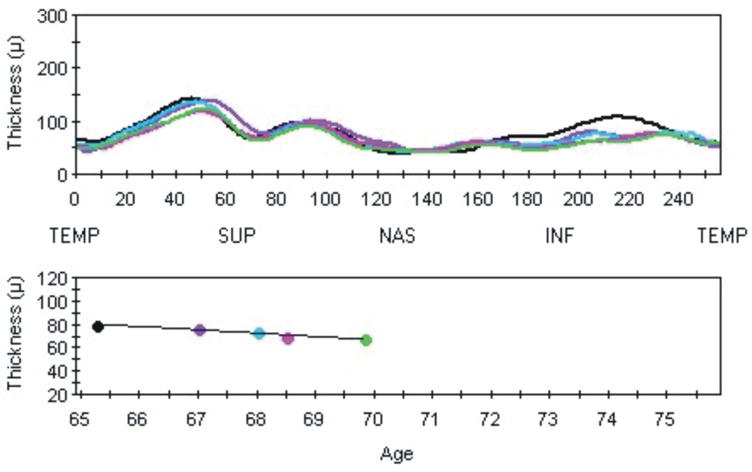
Longitudinal assessment available on the commercial TD-OCT software: a plot of RNFL thickness profiles from successive visits (top), and mean RNFL thickness values (bottom). This does not take into account operator-dependent variability of scan placement.
To improve the consistency of repeated scans, different methods for OCT image registration - the spatial alignment of scans - have been introduced.(Bernardes et al., 2008; Jorgensen et al., 2007; Ramrath et al., 2008; Xu et al., 2008b) A common approach involves acquiring multiple B-scans at the same or neighboring location, and using inter-image correlation to register these frames.(Jorgensen et al., 2007; Ramrath et al., 2008) Using the structural information provided by 3D-OCT fundus images, however, may offer an alternative method for registration.
A recently proposed approach takes advantage of blood vessel locations within a scanning laser ophthalmoscopy (SLO) images taken by an SD-OCT device immediately after the OCT data are acquired.(Ricco et al., 2009; Xu et al., 2008b) Because the SLO image is acquired instantaneously, vessel location does not vary as it can with 3D-OCT images acquired over multiple seconds. Using landmarks such as blood vessels, A-scans and B-scans within the 3D-OCT volumes of data can be realigned and adjusted in the horizontal and axial directions.(Figure 12; Xu J, et al. IOVS 2009;50:ARVO E-Abstract 1104) This method has the potential to be useful in correcting eye motion artifacts and therefore improve the reproducibility of sampling location for longitudinal patient follow-up, as well as to improve cross-sectional comparisons of patient data with normative data.
Figure 12.
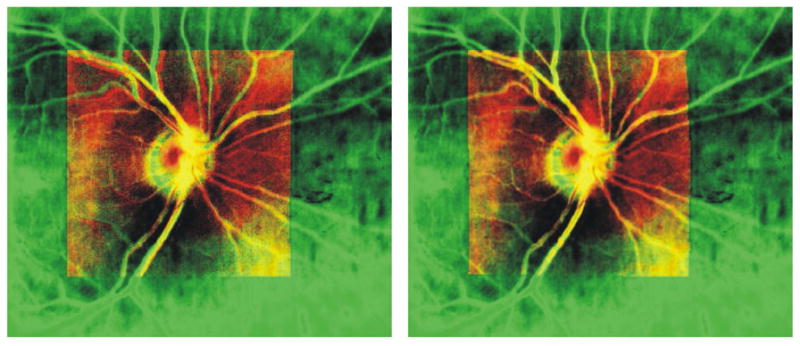
Registration of 3D-OCT (red) image to SLO image (green) using blood vessel location. Left: before registration. Right: after registration. Yellow regions are areas of overlap between the images.
Another promising method for image registration is orthogonal scanning, or scanning rapidly in both the horizontal and vertical directions and coregistering those images.(Potsaid et al., 2008) This approach helps preserve the structural integrity of the retina and ensures gross structural information is not limited to only the horizontal axis of scanning, which has traditionally been the fast scanning axis.
2.2. Segmentation
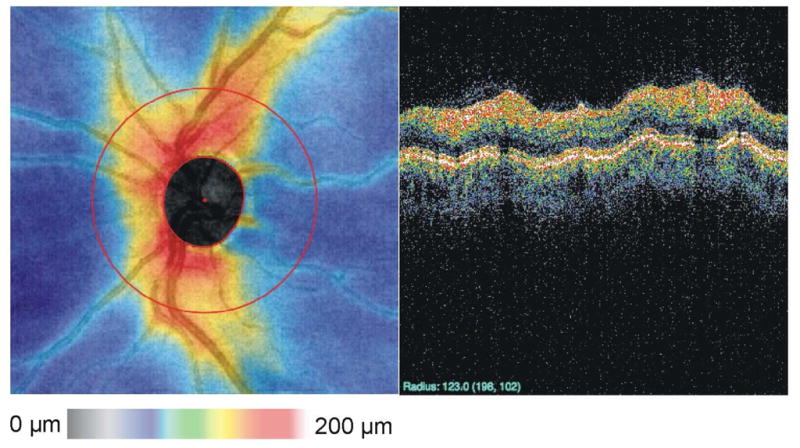
Segmentation of the RNFL has been shown to be a highly sensitive and specific parameter for distinguishing glaucomatous from healthy eyes in TD-OCT (Figure 2).(Bowd et al., 2001; Budenz et al., 2005b; Greaney et al., 2002; Guedes et al., 2003; Liu et al., 2001; Medeiros et al., 2004; Nouri-Mahdavi et al., 2004; Wollstein et al., 2005a; Wollstein et al., 2004) Whereas peripapillary RNFL measurements in TD-OCT imaging consisted of just three successive RNFL scans, 3D-OCT scans require segmentation on numerous frames. Once individual frames have been segmented, however, a 2D RNFL thickness map summarizing RNFL thickness across the region of interest can be generated (Figure 13). In this map, thicker areas are represented by hotter colors and thinner areas are cooler colors.
Figure 13.
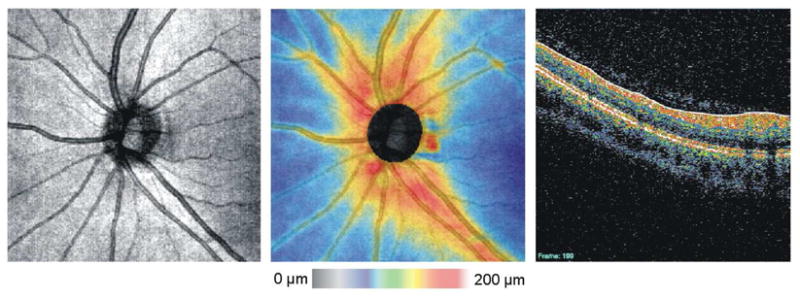
OCT fundus image (left), RNFL thickness map (center) and individual frame showing segmentation of the RNFL (solid blue line and solid white line) on one frame (right).
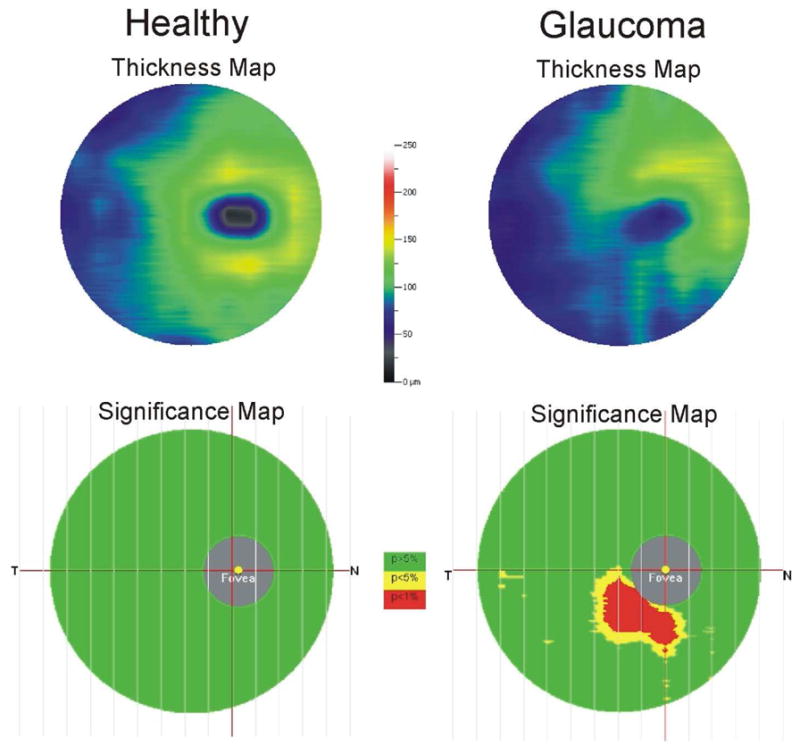
Thickness maps can be useful for visualizing the overall thinning of the RNFL that is seen in glaucoma (Figures 14 and 15). In addition, localized RNFL defects can be readily visualized using this display. A focal inferotemporal defect can clearly be seen on the RNFL thickness map shown in Figure 15. The shape of the RNFL abnormality, which should expand in the X–Y dimension with greater distance from the ONH and should proceed in an arcuate pattern toward the macula in glaucoma, can be useful in discriminating true glaucomatous abnormalities from artifact. RNFL thickness maps allow the clinician to go “beyond the circle” in interpretation of 3D-OCT for glaucomatous abnormalities, as well as for progression analysis (see below).
Figure 14.
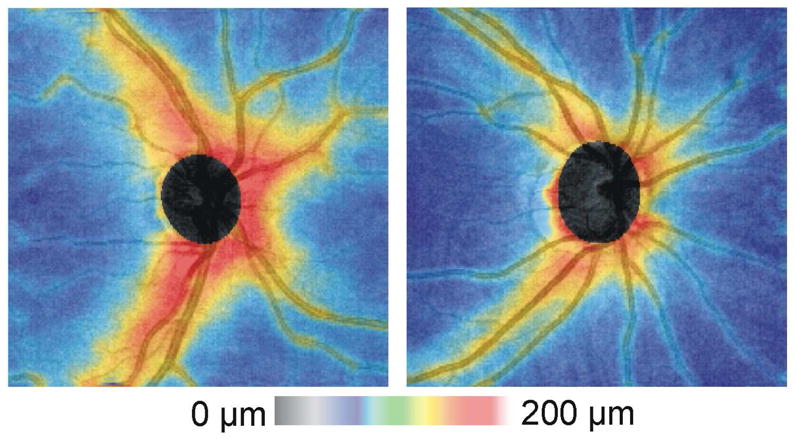
RNFL thickness maps from the right eye of a healthy subject (left) and subject with glaucoma (right)
Figure 15.
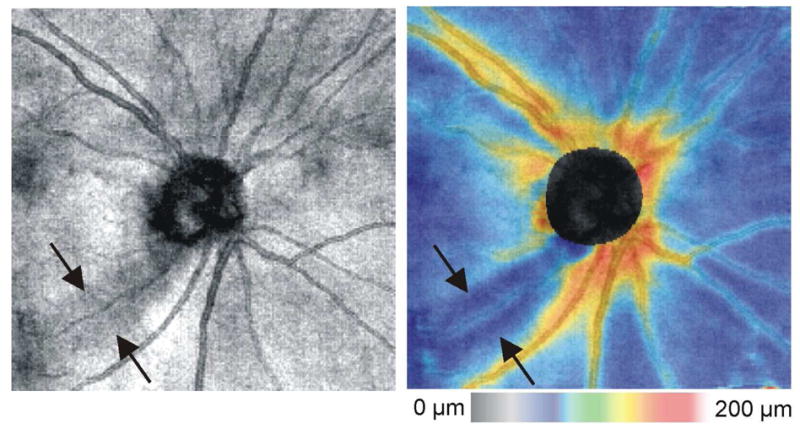
OCT fundus image (left) and RNFL thickness map (right) from a glaucoma subject with a localized inferotemporal defect (arrows)
RNFL thickness map data have been used to investigate the profile of RNFL thickness moving away the ONH in a radial direction. (Gabriele et al., 2007) The slope of the thickness profile in healthy eyes was shown to increase near the ONH margin, peak, and decrease as radial distance from the ONH center increased. This was true in all but the nasal quadrant, which linearly decreased without plateau. This form of RNFL radial profile analysis offers a unique way of summarizing all available RNFL thickness measurements, as opposed to looking only at a 3.4 mm peripapillary scan, and may be helpful for detecting glaucomatous damage, again allowing the clinician to go “beyond the circle”.
As initially postulated by Zeimer and later shown by others, thinning of the macular region has been shown to be associated with glaucoma in TD-OCT imaging (Giovannini et al., 2002; Greenfield et al., 2003; Guedes et al., 2003; Wollstein et al., 2004; Zeimer et al., 1998), and this is likely due to loss of retinal ganglion cells and RNFL, which comprise a large percentage of macular thickness. Conventional measurements with TD-OCT focused on total retinal thickness, but automated segmentation of complexes within the macular region permitted better discrimination of glaucoma versus healthy eyes in TD-OCT radial macular sections.(Ishikawa et al., 2005) Within these radial sections, segmentation of the macular nerve fiber layer together with the inner retinal complex (IRC: retinal ganglion cell layer, inner plexiform and inner nuclear layers) performed the best in discriminating between healthy and glaucomatous eyes. However, one limitation of that study was that segmentation of individual layers with TD-OCT was difficult – some layers could not be isolated – possibly due to the resolution of the device (10μm) and the density of the scans (6 radial sections spaced 300 apart could lead to missed information between sections). Bagci et al have shown segmentation of up to six retinal layers in healthy eyes with TD-OCT and SD-OCT radial sections.(Bagci et al., 2008)
With 3D OCT, better resolution (~2μm in some systems) and denser scanning have the potential to lead to improved intraretinal layer segmentation. An example of a macular thickness map of the IRC from a healthy subject is shown in Figure 16. This 3D scan consisted of 200 × 200 A-scans. Figure 17 shows a comparison of an IRC thickness map from a healthy subject with a subject with glaucoma. The 3D IRC thickness map mimics the traditional TD-OCT macular thickness map display, with the advantage of sampling much more densely than just the six radial scans. Whereas data are interpolated to create a thickness map in TD-OCT, interpolation can be markedly reduced in 3D imaging due to increased scan density.
Figure 16.
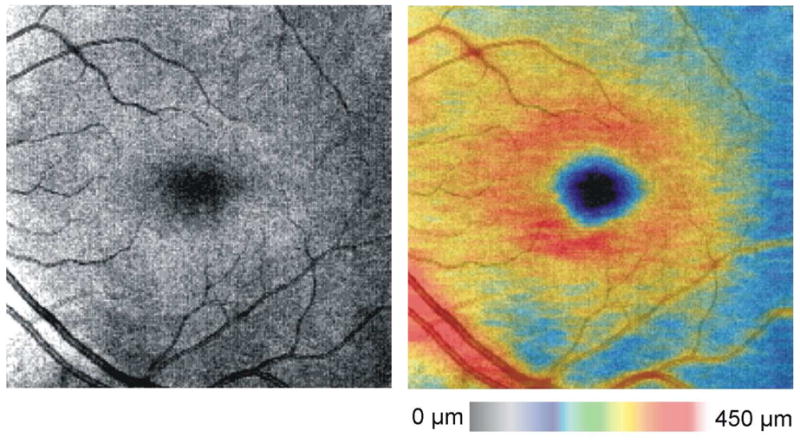
OCT fundus image (left) and macular thickness map (right) from a healthy subject
Figure 17.
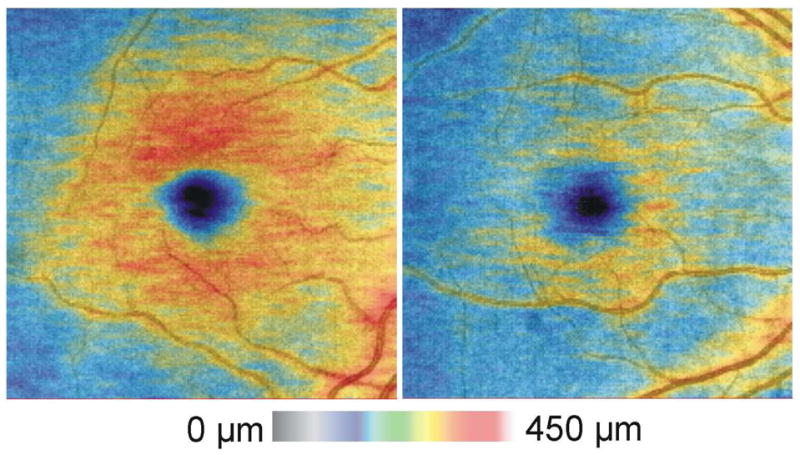
Macular thickness maps (IRC segmentation) from the right eye of a healthy subject (left) and subject with glaucoma (right)
An example of a commercially available macular thickness map of the Ganglion Cell Complex (GCC, RTVue, Optovue, Inc, Fremont, CA, same layers as IRC – cell bodies, axons and dendrites of the retinal ganglion cells) from a healthy subject and a subject with glaucoma is shown in Figure 18. The GCC is a marked advancement in the assessment of glaucoma patients, revealing subtle abnormalities heretofore invisible to imaging or difficult to detect using total retinal thickness.(Tan et al., 2009) Even fine focal RNFL defects may be brought out in sharp relief through the use of the GCC, which highlights the abnormalities in the tissues relevant to the disease (Figure 18). By the use of direct thickness, difference and significance maps, the validity and the importance of the abnormality detected are readily visible to the clinician. In addition, progression assessment algorithms have been applied to this technique and can determine the statistical significance of changes in GCC thickness over time. While registration algorithms remain primitive, the discussion above regarding alignment and registration suggests that these will improve, heightening reproducibility, sensitivity and specificity in detection of disease and its progression.
Figure 18.
Examples of GCC thickness and significance maps in healthy and glaucoma subjects. The GCC consists of cell bodies, axons and dendrites of retinal ganglion cells.
Segmentation in eyes with retinal pathologies has traditionally been difficult because these images often exhibit algorithm failure. Patel et al found a high rate of segmentation errors in TD-OCT retinal thickness measurements from patients with neovascular age-related macular degeneration (Patel et al., 2009), and Sadda et al found errors in eyes with subretinal pathologies.(Sadda et al., 2006) These findings are likely due to the segmentation algorithm’s dependence on finding the boundary between the photoreceptor inner and outer segments, as this is often obscured by subretinal fluid or physically disrupted in patients with retinal pathology. The manual placement of boundaries was successfully used to obtain quantitative measurements, (Costa et al., 2004; Liakopoulos et al., 2008; Sanchez-Tocino et al., 2002) but operator-dependence adds a layer of subjectivity to quantitative measurements.
With 3D OCT imaging, unprecedented visualization of eyes with retinal pathology is possible.(Gupta et al., 2008; Koizumi et al., 2008; Mojana et al., 2008; Punjabi et al., 2008; Schmidt-Erfurth et al., 2005; Srinivasan et al., 2006) Automated segmentation of pathologies remains difficult due to the same imaging constraints as in TD-OCT: obscuring of different structures by shadowing artifacts from subretinal fluid or physical discontinuities in tissue. Cross-sectional images with more A-scans may help improve algorithm performance, but the effect of scan density on segmentation in retinal pathologies has yet to be investigated. In addition, because the center wavelength of the light source in OCT imaging governs visualization of deeper structures, using longer wavelength sources for 3D imaging may provide better images of outer retinal layer pathologies, and potentially improve segmentation results.(de Bruin et al., 2008; Yasuno et al., 2009)
2.3. Resampling
3D volumes can be resampled – “virtually” sectioned – after a data set has been acquired in order to visualize oblique sections, areas or volumes of interest. Resampled sections can also provide more consistent measurements on repeated scans because they do not rely on a user subjectively placing a peripapillary scan around the ONH or placing radial scans through the center of the macula or ONH.
Figure 19 shows one 3D volume from a glaucoma patient with a localized RNFL wedge defect, resampled in four directions (vertical, horizontal, oblique and peripapillary) after acquisition. This image was not corrected for eye motion before resampling, and those eye movements are apparent in both the vertical and peripapillary samples. Localized RNFL thinning is clear in the oblique section. In the peripapillary section, a circle with arbitrary diameter was selected. However, choosing a diameter of 3.4 mm to match the conventional TD-OCT scan diameter is also possible.
Figure 19.

Resampling a single 3D data volume. The top frame shows a vertical cross-section through the optic nerve, while the second frame shows a horizontal section through the optic nerve. The horizontal section is acquired along the fast axis of scanning, while the vertical section is acquired in the slow direction. The third frame shows an oblique section taken at the location of a nerve fiber layer defect. The bottom frame shows a resampled peripapillary scan with a diameter of 3.4 mm. Blue arrows indicate eye motion from scanning in the slow axis, and yellow arrows indicate the location of the nerve fiber layer defect.
Using 3D-OCT data to resample the traditional peripapillary and radial scans provides a means of comparing measurements taken with TD-OCT. The peripapillary sample in Figure 20 was generated by manually defining the boundary of the optic nerve, taking the geometric center, and sampling at a diameter of 3.4 mm from the center. This method has higher reproducibility than peripapillary measurements acquired with TD-OCT,(Kim et al., 2009; Schuman, 2008) most likely because eye motion can be evaluated before resampling and because defining the center of the ONH this way is more consistent. Methods for automatically defining the ONH margin have been developed, and this will further increase the objectivity of those measurements. (Xu et al., 2008a) Figure 21 shows an example of an automatically detected ONH margin superimposed onto an OCT fundus image from the commercially available Cirrus HD-OCT (Carl Zeiss, Meditec, Inc, Dublin, CA).
Figure 20.
Peripapillary scan extracted from 3D volume by manually marking the boundary of the optic nerve head, calculating the geometric center and resampling at a diameter of 3.4 mm.
Figure 21.
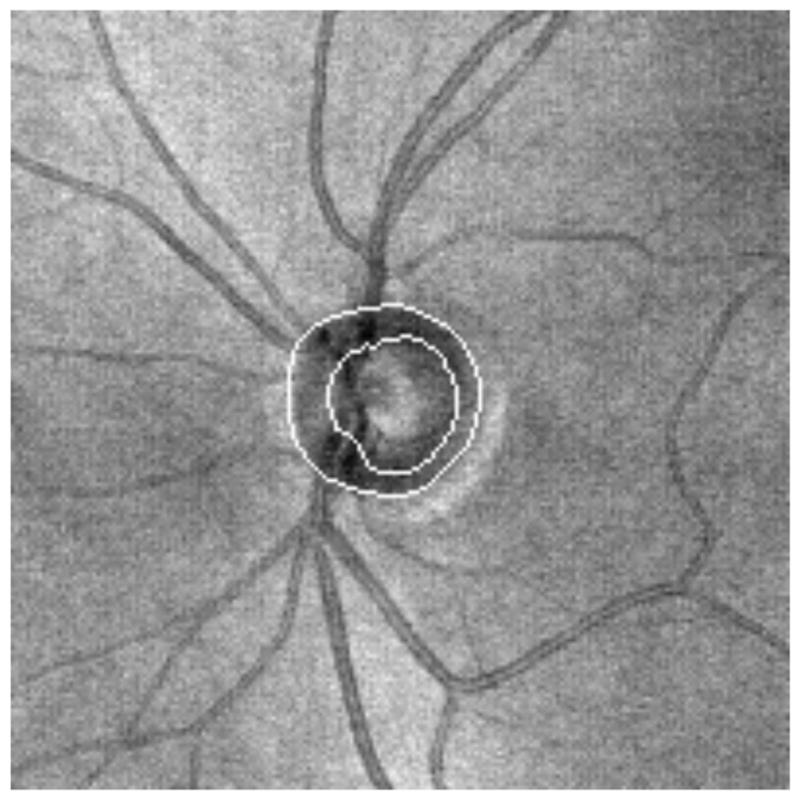
Enface image showing automated detection of the ONH
Interestingly, SD-OCT measurements taken using automated assessment of the ONH have sensitivities and specificities in glaucoma diagnosis similar to RNFL thickness, much as was seen using TD-OCT.(Chang et al., 2009; Leung et al., 2009; Schuman, 2008; Sehi et al., 2009)
2.4. Signal Averaging
Speckle is a source of noise inherent to the OCT technique, and results from the detection of electromagnetic waves exhibiting coherence.(Schmitt et al., 1999) A common method for reducing image artifacts such as speckle is signal averaging; this improves signal-to-noise levels because, while tissue reflectivity values are consistent from A-scan to A-scan, speckle is not. In OCT, this means averaging multiple A-scans or B-scans from a given location in order to suppress noise and improve structural definition. Sander et al showed that the quality of TD-OCT B-scans can be improved by aligning and then averaging multiple B-scan sections.(Sander et al., 2005) Subject eye motion and speckle noise within OCT images are artifacts that can be reduced by alignment and averaging B-scan intensity information acquired from the same location multiple times.
The use of broad-bandwidth light sources improves axial resolution and structural definition within OCT B-scans (Drexler et al., 2001; Drexler et al., 1999) but, at present, most of the commercially available OCT systems have an axial resolution ~5–6 μm. Averaging to remove speckle noise and improve signal-to-noise ratio is one feasible method for enhancing structural definition within fast-scanning SD-OCT systems. Sakamoto et al showed that averaging multiple B-scans improves the definition of retinal structures and layers.(Sakamoto et al., 2008) This technique may be used to improve visualization of retinal pathology or may help with delineation of layer boundaries for segmentation. Figure 22 shows the effect of averaging 9 B-scan frames taken at the same location within the retina using the commercially available Spectralis OCT (Heidelberg Engineering, Heidelberg, Germany). Intraretinal layers, such as the photoreceptor inner segment / outer segment and the borders of all layers, are substantially better pronounced.
Figure 22.
Single OCT B-scan (left) and composite B-scan image generated by averaging 9 frames (right)
An alternative to individual frame averaging is A-scan averaging during acquisition. This type of averaging takes full advantage of rapid scanning speeds and avoids the delay that exists returning to the same location within successive B-scans. For example, the time required to obtain 10 successive A-scans at one location is 0.4 msec in a system with a scanning speed of 27 kHz, but if acquiring and averaging a full B-scan frame of 200 A-scans, 7.4 msec would pass before the same location is reached, meaning 74 msec would have to pass before 10 A-scans could be averaged and leaving much more time for eye motion artifacts.
2.5. C-Mode Display
In addition to the arbitrary sectioning described in Section 2.3, a clear advantage of 3D-OCT images is that data can be virtually sectioned along arbitrary planes relative to the direction in which the scan is acquired, as in C-mode display.(Alam et al., 2006; Cucu et al., 2006; Ishikawa et al., 2009) Because planes can be of any thickness, this method for visualizing 3D data is convenient for isolating specific layers of the retina or certain pathologic structures that may be overlooked on an OCT fundus image. One problem with exact perpendicular sections of the retina, however, is that the curvature of eye isn’t followed and several layers are sliced through (Figure 23).(Alam et al., 2006; Cucu et al., 2006) Some of the commercial 3D-OCT systems have incorporated C-mode visualization of segmented structures. This approach for C-mode display may provide an alternative way to view retinal pathologies, but it would be difficult to use in conditions that exhibit automated segmentation algorithm failure. Aligning all frames of a 3D-OCT image to either the ILM (Figures 7 and 8) or RPE (Figures 9 and 10), however, provides an alternative “quick and dirty” method for isolating certain layers or structures with C-mode sectioning, even in eyes with retinal pathology.
Figure 23.
C-mode section perpendicular to the direction of scanning; this section appears distorted because several layers are sliced through. The red line indicates the location of the cross-sectional scan; the three blue lines indicate the depth of the C-mode section.
3. Clinical Implications
With the software improvements discussed above, 3D OCT has the potential to provide more sensitive, specific and reproducible measurements and enhance longitudinal follow-up of patients with diseases that cause structural damage, such as glaucoma, macular hole, age related macular degeneration, macular edema and others. Similarly, visualization of pathological conditions with 3D OCT may help improve surgical planning and follow-up, as well as introduce the opportunity for intraoperative OCT.
3.1. Reproducibility
To accurately detect small changes associated with disease over time, devices must exhibit reproducible measurements from visit to visit. Longitudinal changes exceeding the reproducibility error of the device can be related to the pathological process. TD-OCT RNFL, macular and optic nerve head measurements have been shown to be reproducible.(Budenz et al., 2005a; Budenz et al., 2008; Paunescu et al., 2004) RNFL and optic nerve measurements acquired with 3D-OCT are also reproducible in healthy eyes and eyes with glaucoma.(Gonzalez-Garcia et al., 2009; Menke et al., 2008; Schuman, 2008)
One study specifically comparing TD- and SD-OCT methods showed that SD-OCT 3D imaging exhibited a statistically significant improvement in reproducibility in sectoral RNFL and macular thickness measurements.(Kim et al., 2009; Schuman, 2008) This is likely due, in part, to the higher resolution and faster scanning speed available with SD-OCT. It also may be related to the more consistent method of sampling from the 3D data cube after it has been collected: instead of relying on a 3.4 mm diameter scan circle placed around the ONH by an operator, the 3.4 mm scan was instead resampled relative to the geometric center of the ONH. Whereas in TD-OCT, subject eye motion and manual positioning of the scan by an operator could greatly alter the location of the scan, in 3D-OCT, the scan is sampled after acquisition and placement can be more consistent. An eye tracking SD-OCT system has been shown to exhibit reproducible measurements,(Menke et al., 2009) but it has yet to be shown whether this improves reproducibility in SD-OCT. Previous studies using TD-OCT did not improve reproducibility of RNFL measurements.(Ishikawa et al., 2006)
3.2. Disease Discrimination
In addition to device reproducibility, it is essential that the objective measurements taken with 3D-OCT be sensitive and specific to changes associated with disease in order to be clinically useful. Several studies have demonstrated that RNFL, ONH and macular thickness measurements obtained with TD-OCT can be used to distinguish healthy from glaucomatous eyes.(Bowd et al., 2000; Bowd et al., 2001; Guedes et al., 2003; Hoh et al., 2000; Kanamori et al., 2003; Mistlberger et al., 1999; Pieroth et al., 1999; Schuman et al., 1995; Zangwill et al., 2000)
3D-OCT offers increased density of sampling of broader regions and may provide improved sensitivity and specificity for disease discrimination. One study found that RNFL and macular thickness measurements acquired using SD-OCT 3D scans showed similar glaucoma discrimination capabilities as compared to TD-OCT RNFL and macular thickness measurements.(Schuman, 2008) It is possible that these 3D-OCT scans do not show improved discrimination capabilities because only a subset of the 3D data is being used. This subset is essentially equivalent to that used in TD-OCT scanning, as it was resampled 3.4 mm RNFL thickness information. New methods for summarizing all of the available 3D-OCT measurements as well as establishing a 3D-OCT normative database for 3D-OCT data may help improve discrimination ability (see Section 4.2).
3.3. Glaucoma Progression Detection
Measurement reproducibility is essential for accurate detection of disease progression, especially in slowly progressing diseases like glaucoma. A longitudinal evaluation of RNFL thickness measurements obtained with TD-OCT showed that, with a median time of follow-up of 4.7 years, OCT detected more progression events than visual field.(Wollstein et al., 2005b) The authors noted that, while OCT may be more sensitive than automated perimetry, it could also have been displaying hypersensitivity in the form of Type-1 statistical errors. In addition, there was a lack of a true gold standard for detection of progression; this is a common problem associated with detecting glaucoma changes over time. However, multiple investigators have shown that the longitudinal variability of commercial OCT devices is low, making OCT parameters stable – and therefore reasonable – candidates for progression detection.(Kagemann et al., 2008; Leung et al., 2008a; Lin et al., 2009)
3D OCT has the potential to improve the reliability of longitudinal follow-up of patients with glaucoma. Because eye motion can be evaluated immediately after scanning, scan location variability may be minimized, allowing more consistent measurements from visit to visit. In addition, if 3D RNFL thickness map information is used in its entirety, as opposed to RNFL measurements from a single peripapillary scan, localized defects or small regional changes over time become more apparent. Segmentation of the IRC or GCC in 3D-OCT macular scans over time, as described in Section 2.2, may also provide an alternative sensitive indicator of glaucomatous damage.
3.4. Detection and Monitoring of Macular Pathologies
Because segmentation algorithms often fail in eyes with retinal pathologies, 3D-OCT has traditionally been most effective for acquiring in-vivo morphological information. However, there are efforts to improve segmentation techniques and identify and quantify structural irregularities in eyes that exhibit retinal pathologies.
In macular hole, for instance, eyes with restored photoreceptor inner segment / outer segment (PR IS/OS) junctions had significantly better visual outcomes.(Oh et al., 2010; Sano et al., 2009) This suggests that the postoperative IS/OS junction status may play a role in visual recovery after surgery for macular hole.(Inoue et al., 2009)
Retinal thickness and volume correlate with best-corrected visual acuity in 3D-OCT studies of subjects with diabetic macular edema, and 3D-OCT has been shown to help diagnose subclinical serous macular detachment.(Koleva-Georgieva and Sivkova, 2009) 3D-OCT is also useful for defining the morphology of cystoid spaces(Nigam et al., 2010); accurate volume measurements may assist with longitudinal monitoring.
Parameters provided by 3D-OCT imaging, such as retinal thickness and area of geographic atrophy, may improve longitudinal monitoring of age-related macular degeneration (AMD). Geographic atrophy can be discerned in SD-OCT images as the loss of hyperreflective bands and thinning of the outer nuclear layer, with subsequent approach of the outer plexiform layer towards Bruch’s membrane.(Fleckenstein et al., 2010) 3D-OCT imaging may be used to evaluate drusen volume (Freeman et al., 2010; Schuman et al., 2009), and automated drusen analyses techniques are under development.(Yi et al., 2009) SD-OCT has also been used to determine the size of choroidal neovascularization.(Framme et al., 2010) Shape and volume analysis together with longitudinal image registration may improve assessment of the extent of geographic atrophy, drusen and neovascularization lesion both cross-sectionally and over time.
SD-OCT has been shown to be useful for visualizing vitreomacular traction and idiopathic epiretinal membrane (ERM)(Koizumi et al., 2008), as well as in the diagnosis of subtle ERM.(Nigam et al., 2010) Segmentation of the ERM and ILM separately helps reveal the extent of traction.(Legarreta et al., 2008) It has been shown that outer retinal thickening correlates with visual acuity in subjects with ERM, while inner retinal thickening does not.(Arichika et al., 2010)
3.5. Surgical planning
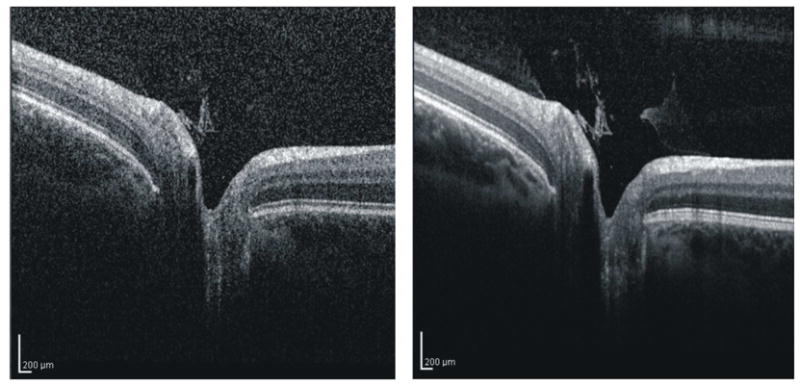
OCT can be used to confirm the presence of retinal abnormalities such as vitreomacular traction.(Gallemore et al., 2000) Although traction can resolve spontaneously, pars plana vitrectomy may be required. Chung et al used the TD-OCT six radial scan pattern taken through the macula to plan the site of access to the subhyaloid space during the vitrectomy.(Chung et al., 2008) The authors considered the radial location where the hyaloid membrane was furthest from the retina as the safest place to enter the subhyaloid space and peel off the posterior hyaloid membrane, in an attempt to minimize the traction forces experienced by the macula. While TD-OCT radial scanning helped plan the surgical approach, it is possible that six radial scans placed 30° apart could miss the location of the membrane that is truly farthest from the retina. 3D-OCT scans through the macula may provide a more comprehensive map for guiding vitrectomy surgery, especially in macular hole repair and identification of posterior hyaloid versus internal limiting membrane versus neural retina.
Another group used SD-OCT to evaluate patients with epiretinal membranes prior to and after surgery.(Falkner-Radler et al., 2009) The 3D images allowed for improved recognition of the topography of the vitreomacular interface.
One recent approach that may assist in intraoperative guidance (Section 4.5) or surgical planning, the OCT Penlight, projects a virtual image of an OCT scan into the line of sign of the surgeon.(Galeotti et al., 2010) This image guidance system may help clinicians performing intraocular surgery visualize microstructure prior to and during surgery.
4. Future Directions
With the recent increase in the number of OCT users and the number of companies manufacturing commercially available systems, there is a need to establish common clinical standards to allow for consistency across devices and comparison between individuals. Standards that fully exploit and summarize all of the data acquired with 3D OCT imaging would improve diagnostic ability and longitudinal follow-up, and may eventually lead to the use of 3D-OCT parameters as endpoints in clinical trials. To do this, scan patterns, scan density and scan area need to be considered, as do the requirements for establishing and employing normative data for 3D datasets. Because many clinicians continue to use TD-OCT and/or have converted from TD-OCT to 3D-OCT, a way to utilize all of the data acquired with TD-OCT would be valuable for the longitudinal follow-up of patients, especially those that are now being followed by 3D imaging.(Kim et al., 2010)
The use of OCT for surgical guidance is a recently explored concept in ophthalmology(Dayani et al., 2009) but has been used by other specialists to guide cochlear implantation,(Just et al., 2009b; Pau et al., 2007) biopsy site localization (Just et al., 2009a), and diagnosis of vocal fold lesions.(Vokes et al., 2008) Delivery systems such as hand-held and microscopic probes may enable surgical applications of OCT systems, so that a clinician can have access to cross-sectional information when performing ophthalmic surgery - as opposed to only pre- and post-operative structural data.
4.1. Establishment of New Clinical OCT Standards
While only one company produces a commercial ophthalmic TD-OCT system, several commercially available 3D-OCT imaging systems have developed independently, and the numbers of companies entering this arena continues to grow. Although the basic principles of data acquisition are consistent across devices, scan types, the exact retinal location of scans and other software-based differences exist. The most effective scan specifications, with respect to disease discrimination and longitudinal follow-up, have yet to be established.
4.1.1. Scan Patterns
The basic RNFL and macular scan patterns used in TD-OCT are seen in Figure 2. These scan types were chosen to sample a region of interest in a space- and time-efficient manner. With 3D-OCT imaging, the most common form of sampling is a data cube as detailed in Figure 3. Most of the commercial devices can sample a data cube centered on the ONH and another centered on the fovea. However, the number of A-scans per B-scan as well as the number of B-scans per volume is not consistent across devices. In addition, the number of scans in a given area and the overall retinal area a scan samples varies with device.
4.1.1.1. Semi-Isotropic and Semi-Isometric Sampling
While imaging for the purpose of confirming the presence of retinal pathologies may only require a limited number of densely sampled cross-sections, 3D sampling is necessary for quantitative measurements of volumes of tissue in order to assess the true extent of retinal damage. The sampling volume and number of A- and B-scans comprising an image vary amongst the commercially available 3D-OCT devices. Some systems sample the ONH and macular regions semi-isotropically and semi-isometrically (i.e., an equal number of A-scans in the horizontal and vertical directions spaced evenly over a sampling area that is equivalent in the x- and y-direction). Sampling evenly (in terms of number of A-scans and the area they comprise) in the horizontal and vertical directions is semi-isotropic and semi-isometric, as a perfectly isotropic and isometric sample would be equal in x-, y-, and z. However, with 3D-OCT imaging, the depth of penetration is limited to 1–2 mm with a light source centered in the 800 nm region because of the attenuation of backscattered light. Other commercial systems sample an uneven area with a varying number of A-scans in the horizontal and vertical direction.
Semi-isotropic and semi-isometric scanning is an appealing technique for obtaining quantitative measurements because it provides an even representation of a volume of tissue that is required for accurately resampling the data volume after acquisition. As a result, spatial integrity of resampled images can be retained after scanning, and uneven interpolation to correct for the unevenly spaced samples will not be necessary.
A second advantage of semi-isotropic and semi-isometric sampling is relevant to registering OCT fundus images to reference fundus photographs. Image matching that relies on features within an OCT fundus image, such as blood vessels, requires an evenly sampled dataset to match features present on a reference fundus image and preserve their spatial integrity.
4.1.1.2. Scan Density
Increasing the density of a scan, or the number of A-scans acquired within a given volume of tissue, has previously been shown to decrease the variability of RNFL thickness measurements obtained using TD-OCT.(Gurses-Ozden et al., 1999; Paunescu et al., 2004) However, the more A-scans acquired, the longer it takes to acquire an image. Decreasing the required subject fixation time is important to ensure eye motion artifacts as well as corneal drying-related signal attenuation are minimized. However, when visualizing retinal pathology or other structures of interest that do not necessitate quantitative measurements, denser B-scans can be acquired. This helps improve structural definition and layer boundaries.
4.1.1.3. Scan Area
Current scanning protocols common amongst commercial systems include 3D scanning of the ONH and macular regions separately. These protocols offer the advantage of being comparable to scans acquired with TD-OCT: radial and peripapillary scans can be resampled from within the 3D-OCT volume. However, as 3D-OCT scan speed continues to improve, it may be possible to image larger volumes for a more global view of pathologic conditions. Visualizing the ONH region in the same 3D-OCT volume as the macula may be useful for monitoring changes in the RNFL that occur with glaucomatous damage.
Similarly, depending the structure of interest, a 3D-OCT volume of a smaller scan area may be used to improve visualization of smaller structures. Figure 24, for example, shows a 3 × 3 mm scan of the ONH consisting of 300 × 300 A-scans. This high-density scan of a smaller volume helps makes possible the visualization of the lamina cribrosa upon C-mode sectioning. Potsaid et al demonstrated high density scanning of a small area with SS-OCT and were able to obtain images of photoreceptors and retinal capillaries of the inner nuclear layer. (Potsaid et al., 2008) However, even without the rapid scanning capability afforded by SS-OCT, photoreceptors can be visualized with SD-OCT (Figure 25).
Figure 24.
A high-density (3 × 3 mm; 300 × 300 A-scans) 3D-OCT image of the optic nerve can be used to create C-mode sections of the lamina cribrosa. The black line indicates the location of the cross-sectional scan; the three white lines indicate the depth of the C-mode section.
Figure 25.
A high-density (800 × 800 μm, 300 × 300 A-scans) 3D-OCT image of the retina can be used to create C-mode sections of photoreceptors. The horizontal red line indicates the location of the cross-sectional scan; the horizontal blue lines indicate the depth of the C-mode section.
4.2. Normative Databases for 3D Datasets
Comparing individual thickness measurements to those from healthy, normal subjects is a method used in TD-OCT to highlight regions of abnormal thickness. The commercial TD-OCT system has a RNFL thickness normative database, which is comprised of average measurements from the 3.4 mm diameter peripapillary RNFL thickness protocol taken in healthy subjects. The TD-OCT system also has a retinal thickness normative database, generated from the six radial scan protocol. Some of the commercial 3D-OCT imaging systems have incorporated normative databases into their software but, at present, fail to use all of the available 3D-OCT data. For example, on some devices normative RNFL thickness comparisons still rely only on (resampled) 3.4-mm diameter peripapillary information while the majority of the 3D RNFL thickness information is left unused. However, it is critical to go “beyond the circle.” A method for comparing as much data as possible to normative values needs to be established. Directly comparing subject thickness information point-by-point would be inappropriate because of anatomical variations in thickness patterns and blood vessel locations, and ONH size as well as variability of the scanning window location.
One method for summarizing 3D-OCT thickness map data for glaucoma discrimination has recently been introduced.(Ishikawa H, et al. IOVS 2009;50:ARVO E-Abstract 3328) This method condenses IRC or GCC data into superpixels (adjacent sampling points) and compares the superpixels to normative thickness superpixel data. Summarizing thickness information into superpixels means the analysis is less likely to be skewed by imaging artifacts or algorithm failure than a simple pixel-by-pixel comparison, but all of the 3D information is being used. In addition, a superpixel approach may allow for detection of localized defects that are missed in the sectoral analysis that is currently used in the macular region. This approach has shown a glaucoma discriminating ability at least equal to that of peripapillary RNFL thickness measurements.
4.3. OCT Measurements as Endpoints
Before 3D-OCT measurements can be used as endpoints in clinical trials, it must be shown that 3D-OCT can measure relevant outcomes accurately and precisely, and that those measurements correspond to clinically important outcomes. A 3D assessment may allow increased precision in measurements and better reproducibility because of registration, but this has yet to be established.
In glaucoma, RNFL thickness changes may be used as a clinical endpoint, since it has been established that the disease specifically affects retinal ganglion cells and their axons. Still, it is critical that a connection can be made between the rate of RNFL loss and clinically relevant vision loss. Does loss of RNFL result in decreased functional ability? If clinical intervention can slow the rate of RNFL loss and this predicts or corresponds to loss of clinically relevant visual function, then 3D-OCT RNFL measurements will have profound importance as a clinical endpoint.
In eyes with retinal pathologies, parameters such as macular thickness, extent of PR IS/OS junction repair, volume of cystic spaces, drusen volume, extent of geographic atrophy, and/or inner/outer retinal thickening may be used as an endpoint, as opposed to a subjective parameter such as best-corrected visual acuity. Studies to evaluate the potential of these 3D-OCT parameters as clinical endpoints are underway.
4.4. Compatibility with TD-OCT for Longitudinal Follow-up
Years of longitudinal patient data have been acquired since TD-OCT became commercially available. With the recent introduction of 3D-OCT imaging methods to the clinic, a method to use this longitudinal data is essential, especially for assessing slowly progressing diseases like glaucoma in patients that have been followed for many years.
One novel approach addresses the need for compatibility between devices.(Kim et al., 2010) This method searches a 3D-OCT dataset for every possible 3.4-mm circular scan within the boundaries of the 3D-OCT volume, and uses the cross correlation between these virtually resampled circular scans and the TD-OCT 3.4-mm scan to automatically find the TD-OCT scan circle location within the 3D-OCT volume. Figure 26 shows an example TD-OCT circular scan whose location has been matched within the 3D-OCT dataset. This approach has the potential to bridge different iterations of the technology by ensuring that follow-up 3D-OCT data are resampled in the same location as previously acquired TD-OCT data. Several studies have shown that measurements from commercial 3D-OCT systems cannot be interchanged with TD-OCT measurements, and that 3D-OCT structural measurements are typically higher than TD-OCT measurements.(Forooghian et al., 2008; Han and Jaffe, 2009; Kakinoki et al., 2009; Leung et al., 2008b; Sayanagi et al., 2009) This is likely in part due to automated segmentation algorithm placement of anterior and posterior borders of structures of interest. The commercial TD-OCT system defines the inner segment/outer segment junction as the outer boundary of the retina, but different 3D-OCT devices may detect other structures such as the RPE.(Han and Jaffe, 2009; Leung et al., 2008b) Segmentation differences may be contributing to a constant offset attributed to device calibration, but scan location may also be adding variability and could be addressed using this method of backward compatibility.
Figure 26.
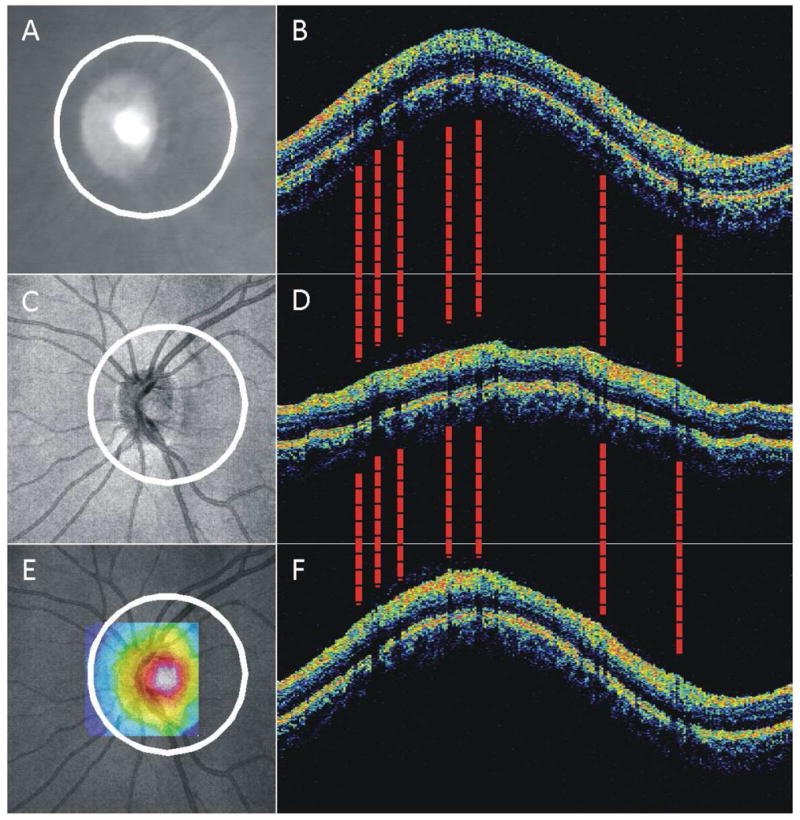
Summary of method for backward compatibility between TD-OCT and 3D-OCT: scan location matching. (A, B) TD-OCT Fundus video image and 3.4-mm circular cross-sectional OCT B-scan; (C, D) 3D-OCT fundus image and virtually resampled 3.4-mm circular B-scan; (E) Similarity map created from the correlation between TD-OCT data and data virtually sampled centered at each pixel within the sampling center boundary (square; color range represents correlation coefficient 0, dark blue, to 1, white); (F) 3D-OCT virtually resampled B-scan, after searching and matching the TD-OCT scan location. The 3D-OCT vessel shadows (dashed lines) match the TD-OCT vessel locations.
4.5. Intraoperative OCT Surgical Guidance
Recently, the use of OCT for surgical guidance has been considered in fields outside of ophthalmology. Pau et al employed an OCT system that was incorporated into an operating microscope to image the cochlea to evaluate its use as a potential guide to surgeons performing cochlear implantation.(Pau et al., 2007) The authors found the use of an OCT guide is feasible and may help surgeons with the placement of the cochlear implant electrode array. A separate study suggested OCT may be used to evaluate the oval window niche.(Just et al., 2009b) Vokes et al also developed a surgical microscope to enable non-contact imaging of the vocal folds, which they found may be applicable to the diagnosis of vocal fold lesions, apparent in OCT sections as a disruption of the basement membrane.(Vokes et al., 2008) Others have developed operating microscopes with integrated OCT systems and used them define a biopsy site so a resection can be precisely planned.(Just et al., 2009a) In addition, since OCT serves as a form of optical biopsy, some groups are attempting to use optical scattering information to evaluate tissues without excision, (Jung et al., 2007; Poneros, 2004; Wang et al., 2006) using endoscopic OCT systems (Jackle et al., 2000; Li et al., 2000; Sivak et al., 2000; Tearney et al., 1997). Endoscope-based OCT systems also have the potential to guide laser ablation of tissue.(Boppart et al., 1999)
In ophthalmology, OCT has been used postoperatively to evaluate outcomes of macular hole surgery,(Inoue et al., 2009; Michalewska et al., 2008; Sano et al., 2009) patients who had undergone vitrectomy surgery for vitreomacular traction,(Chang et al., 2008a; Mojana et al., 2008; Uchino et al., 2001) and eyes after successful surgery for retinal detachment.(Nakanishi et al., 2009) Leng et al used a 1310 nm SD-OCT system to visualize corneal incisions in the eye of a patient after phacoemulsification.(Leng et al., 2008)
While postoperative OCT is useful for evaluating surgical outcomes, real-time imaging of ocular structures during surgery may provide additional guidance to ophthalmologists in the form of a structural perspective that is not currently available. Dayani et al recently used a handheld OCT system before, during and after full-thickness macular hole, epiretinal membrane and vitreomacular traction surgery.(Dayani et al., 2009) The authors suggest their intraoperative OCT setup may improve surgical outcomes by confirming the removal of the internal limiting membrane or epiretinal membrane.
OCT integrated into an operating microscope with a “heads-up” display would have high utility in intraocular surgery, and would provide invaluable information for intraoperative decision-making. It could also be used in combination with a robotic surgical approach, either by surgeons actually in the operating room or individuals directing the device remotely. In addition, the OCT Penlight described in section 3.4 may provide a structural image overlay onto tissue and allow real-time monitoring of surgical progress, such as microcatheter insertion into Schlemm’s Canal.
4.6. OCT Delivery Systems
OCT systems used in ophthalmology have traditionally required patients to be seated upright and looking at a fixation target. However, as evidenced by the endoscope and surgical microscope systems described in Section 4.4, OCT delivery does not need to be limited to a slit lamp module. With these approaches to image acquisition, structures of interest can be viewed without the requirement that subjects look at a fixation target.
In addition to endoscope and microscope-based systems, there is also clinical potential for a hand-held OCT delivery system. Scott et al used a hand-held SD-OCT system with a flexible arm to image eyes of infants and adults in a supine position.(Scott et al., 2009) The hand-held probe contained the fiber optics of the sample arm such that the operator had flexibility in aiming. This type of probe may not only assist with scanning younger and less cooperative patients, but may also be useful for patients lying on stretchers or those unable to be positioned using a slit lamp setup.
5. Conclusion
The recent explosion in the use of OCT can partially be attributed to the introduction and commercialization of Fourier-domain OCT imaging, which has enabled rapid acquisition of 3D-OCT datasets. Given that an OCT fundus image can be created from a 3D-OCT dataset, clinicians now have the ability to not only identify surface structural abnormalities, but to look precisely at the tissue and location corresponding to the cross-section of interest.
The clinical potential of 3D-OCT is vast, and ranges from decision-making and management to intraoperative guidance. Improvements are necessary in order to maximize the utility of these rich datasets. While progress has been made in visualizing and sampling 3D-OCT volumes post hoc, the incorporation of new options like C-mode display may improve the identification of gross structural abnormalities, even when they are embedded within layers. The incorporation of eye tracking systems may assist with scan alignment and reproducibility, and software-based techniques for volume registration and scan-to-scan alignment post hoc have the potential to reduce measurement variability and improve longitudinal follow-up. New automated techniques for defining the ONH margin may also help improve consistency from scan-to-scan.
RNFL and macular segmentation algorithms are robust but should be expanded so the frequency of algorithm failure in eyes with retinal pathologies is reduced. In addition, since segmentation of entire volumes is now possible, normative databases incorporating as much 3D-OCT information as possible need to be established. Methods like a super-pixel approach may allow for comparisons of larger retinal areas. Novel approaches to making 3D-OCT backward compatible with TD-OCT may help ensure that years of data are not lost. Finally, in order to compare populations of subjects being scanning on various commercial 3D-OCT systems, a standardization of scan patterns across devices needs to be developed such that clinicians can consistently assess patients regardless of the manufacturer of the unit on which the patient was scanned.
While clinicians are well situated in terms of image acquisition with 3D-OCT, and preliminary studies have shown the 3D-OCT can improve reproducibility of measurements, more studies are required to determine whether there are ways to improve specificity and sensitivity of disease detection as well as longitudinal follow-up. Software is evolving to help extract as much useful information as possible, and because of this, the clinical value of 3D-OCT scanning will likely continue to grow.
Acknowledgments
Financial Support: Supported in part by National Institute of Health contracts R01-EY13178-10, and P30-EY08098-23 (Bethesda, MD), The Eye and Ear Foundation (Pittsburgh, PA) and an unrestricted grant from Research to Prevent Blindness (New York, NY).
Footnotes
Conflict of Interest Disclosures: Dr. Wollstein received research funding from Carl Zeiss Meditec and Optovue. Drs. Wollstein, Ishikawa, Xu, Kim and Schuman have intellectual property licensed by the University of Pittsburgh to Bioptigen. Dr. Schuman received royalties for intellectual property licensed by Massachusetts Institute of Technology to Carl Zeiss Meditec.
Publisher's Disclaimer: This is a PDF file of an unedited manuscript that has been accepted for publication. As a service to our customers we are providing this early version of the manuscript. The manuscript will undergo copyediting, typesetting, and review of the resulting proof before it is published in its final citable form. Please note that during the production process errors may be discovered which could affect the content, and all legal disclaimers that apply to the journal pertain.
References
- Alam S, Zawadzki RJ, Choi S, Gerth C, Park SS, Morse L, Werner JS. Clinical application of rapid serial fourier-domain optical coherence tomography for macular imaging. Ophthalmology. 2006;113:1425–1431. doi: 10.1016/j.ophtha.2006.03.020. [DOI] [PMC free article] [PubMed] [Google Scholar]
- Arichika S, Hangai M, Yoshimura N. Correlation between thickening of the inner and outer retina and visual acuity in patients with epiretinal membrane. Retina. 2010;30:503–508. doi: 10.1097/IAE.0b013e3181bd2d65. [DOI] [PubMed] [Google Scholar]
- Bagci AM, Shahidi M, Ansari R, Blair M, Blair NP, Zelkha R. Thickness profiles of retinal layers by optical coherence tomography image segmentation. Am J Ophthalmol. 2008;146:679–687. doi: 10.1016/j.ajo.2008.06.010. [DOI] [PMC free article] [PubMed] [Google Scholar]
- Bernardes R, Santos T, Cunha-Vaz J. Increased-resolution OCT thickness mapping of the human macula: a statistically based registration. Invest Ophthalmol Vis Sci. 2008;49:2046–2052. doi: 10.1167/iovs.07-0467. [DOI] [PubMed] [Google Scholar]
- Boppart SA, Herrmann J, Pitris C, Stamper DL, Brezinski ME, Fujimoto JG. High-resolution optical coherence tomography-guided laser ablation of surgical tissue. J Surg Res. 1999;82:275–284. doi: 10.1006/jsre.1998.5555. [DOI] [PubMed] [Google Scholar]
- Bowd C, Weinreb RN, Williams JM, Zangwill LM. The retinal nerve fiber layer thickness in ocular hypertensive, normal, and glaucomatous eyes with optical coherence tomography. Arch Ophthalmol. 2000;118:22–26. doi: 10.1001/archopht.118.1.22. [DOI] [PubMed] [Google Scholar]
- Bowd C, Zangwill LM, Berry CC, Blumenthal EZ, Vasile C, Sanchez-Galeana C, Bosworth CF, Sample PA, Weinreb RN. Detecting early glaucoma by assessment of retinal nerve fiber layer thickness and visual function. Invest Ophthalmol Vis Sci. 2001;42:1993–2003. [PubMed] [Google Scholar]
- Budenz DL, Chang RT, Huang X, Knighton RW, Tielsch JM. Reproducibility of retinal nerve fiber thickness measurements using the stratus OCT in normal and glaucomatous eyes. Invest Ophthalmol Vis Sci. 2005a;46:2440–2443. doi: 10.1167/iovs.04-1174. [DOI] [PubMed] [Google Scholar]
- Budenz DL, Fredette MJ, Feuer WJ, Anderson DR. Reproducibility of peripapillary retinal nerve fiber thickness measurements with stratus OCT in glaucomatous eyes. Ophthalmology. 2008;115:661–666. e664. doi: 10.1016/j.ophtha.2007.05.035. [DOI] [PubMed] [Google Scholar]
- Budenz DL, Michael A, Chang RT, McSoley J, Katz J. Sensitivity and specificity of the StratusOCT for perimetric glaucoma. Ophthalmology. 2005b;112:3–9. doi: 10.1016/j.ophtha.2004.06.039. [DOI] [PubMed] [Google Scholar]
- Chang LK, Fine HF, Spaide RF, Koizumi H, Grossniklaus HE. Ultrastructural correlation of spectral-domain optical coherence tomographic findings in vitreomacular traction syndrome. Am J Ophthalmol. 2008a;146:121–127. doi: 10.1016/j.ajo.2008.03.001. [DOI] [PMC free article] [PubMed] [Google Scholar]
- Chang LK, Koizumi H, Spaide RF. Disruption of the photoreceptor inner segment-outer segment junction in eyes with macular holes. Retina. 2008b;28:969–975. doi: 10.1097/IAE.0b013e3181744165. [DOI] [PubMed] [Google Scholar]
- Chang RT, Knight OJ, Feuer WJ, Budenz DL. Sensitivity and specificity of time-domain versus spectral-domain optical coherence tomography in diagnosing early to moderate glaucoma. Ophthalmology. 2009;116:2294–2299. doi: 10.1016/j.ophtha.2009.06.012. [DOI] [PubMed] [Google Scholar]
- Choma MA, Hsu K, Izatt JA. Swept source optical coherence tomography using an all-fiber 1300-nm ring laser source. J Biomed Opt. 2005;10:44009. doi: 10.1117/1.1961474. [DOI] [PubMed] [Google Scholar]
- Chung EJ, Lew YJ, Lee H, Koh HJ. OCT-guided hyaloid release for vitreomacular traction syndrome. Korean J Ophthalmol. 2008;22:169–173. doi: 10.3341/kjo.2008.22.3.169. [DOI] [PMC free article] [PubMed] [Google Scholar]
- Costa RA, Calucci D, Skaf M, Cardillo JA, Castro JC, Melo LA, Jr, Martins MC, Kaiser PK. Optical coherence tomography 3: Automatic delineation of the outer neural retinal boundary and its influence on retinal thickness measurements. Invest Ophthalmol Vis Sci. 2004;45:2399–2406. doi: 10.1167/iovs.04-0155. [DOI] [PubMed] [Google Scholar]
- Cucu RG, Podoleanu AG, Rogers JA, Pedro J, Rosen RB. Combined confocal/en face T-scan-based ultrahigh-resolution optical coherence tomography in vivo retinal imaging. Opt Lett. 2006;31:1684–1686. doi: 10.1364/ol.31.001684. [DOI] [PubMed] [Google Scholar]
- Dayani PN, Maldonado R, Farsiu S, Toth CA. Intraoperative use of handheld spectral domain optical coherence tomography imaging in macular surgery. Retina. 2009;29:1457–1468. doi: 10.1097/IAE.0b013e3181b266bc. [DOI] [PMC free article] [PubMed] [Google Scholar]
- de Boer JF, Cense B, Park BH, Pierce MC, Tearney GJ, Bouma BE. Improved signal-to-noise ratio in spectral-domain compared with time-domain optical coherence tomography. Opt Lett. 2003;28:2067–2069. doi: 10.1364/ol.28.002067. [DOI] [PubMed] [Google Scholar]
- de Bruin DM, Burnes DL, Loewenstein J, Chen Y, Chang S, Chen TC, Esmaili DD, de Boer JF. In vivo three-dimensional imaging of neovascular age-related macular degeneration using optical frequency domain imaging at 1050 nm. Invest Ophthalmol Vis Sci. 2008;49:4545–4552. doi: 10.1167/iovs.07-1553. [DOI] [PubMed] [Google Scholar]
- Ditchburn RW, Foley-Fisher JA. Assembled data in eye movements. Opt Acta (Lond) 1967;14:113–118. doi: 10.1080/713818024. [DOI] [PubMed] [Google Scholar]
- Ditchburn RW, Ginsborg BL. Involuntary eye movements during fixation. J Physiol. 1953;119:1–17. doi: 10.1113/jphysiol.1953.sp004824. [DOI] [PMC free article] [PubMed] [Google Scholar]
- Drexler W, Morgner U, Ghanta RK, Kartner FX, Schuman JS, Fujimoto JG. Ultrahigh-resolution ophthalmic optical coherence tomography. Nat Med. 2001;7:502–507. doi: 10.1038/86589. [DOI] [PMC free article] [PubMed] [Google Scholar]
- Drexler W, Morgner U, Kartner FX, Pitris C, Boppart SA, Li XD, Ippen EP, Fujimoto JG. In vivo ultrahigh-resolution optical coherence tomography. Opt Lett. 1999;24:1221–1223. doi: 10.1364/ol.24.001221. [DOI] [PubMed] [Google Scholar]
- Falkner-Radler CI, Glittenberg C, Binder S. Spectral domain high-definition optical coherence tomography in patients undergoing epiretinal membrane surgery. Ophthalmic Surg Lasers Imaging. 2009;40:270–276. doi: 10.3928/15428877-20090430-08. [DOI] [PubMed] [Google Scholar]
- Ferguson RD, Hammer DX, Paunescu LA, Beaton S, Schuman JS. Tracking optical coherence tomography. Opt Lett. 2004;29:2139–2141. doi: 10.1364/ol.29.002139. [DOI] [PMC free article] [PubMed] [Google Scholar]
- Fleckenstein M, Schmitz-Valckenberg S, Adrion C, Kramer I, Eter N, Helb HM, Brinkmann CK, Charbel Issa P, Mansmann U, Holz FG. Tracking Progression using Spectral Domain Optical Coherence Tomography in Geographic Atrophy due to Age-related Macular Degeneration. Invest Ophthalmol Vis Sci. 2010 doi: 10.1167/iovs.09-4533. [DOI] [PubMed] [Google Scholar]
- Forooghian F, Cukras C, Meyerle CB, Chew EY, Wong WT. Evaluation of time domain and spectral domain optical coherence tomography in the measurement of diabetic macular edema. Invest Ophthalmol Vis Sci. 2008;49:4290–4296. doi: 10.1167/iovs.08-2113. [DOI] [PMC free article] [PubMed] [Google Scholar]
- Framme C, Panagakis G, Birngruber R. Effects on choroidal neovascularization after anti-VEGF Upload using intravitreal ranibizumab, as determined by spectral domain-optical coherence tomography. Invest Ophthalmol Vis Sci. 2010;51:1671–1676. doi: 10.1167/iovs.09-4496. [DOI] [PubMed] [Google Scholar]
- Freeman SR, Kozak I, Cheng L, Bartsch DU, Mojana F, Nigam N, Brar M, Yuson R, Freeman WR. Optical coherence tomography-raster scanning and manual segmentation in determining drusen volume in age-related macular degeneration. Retina. 2010;30:431–435. doi: 10.1097/IAE.0b013e3181bd2f94. [DOI] [PubMed] [Google Scholar]
- Gabriele ML, Ishikawa H, Wollstein G, Bilonick RA, Kagemann L, Wojtkowski M, Srinivasan VJ, Fujimoto JG, Duker JS, Schuman JS. Peripapillary nerve fiber layer thickness profile determined with high speed, ultrahigh resolution optical coherence tomography high-density scanning. Invest Ophthalmol Vis Sci. 2007;48:3154–3160. doi: 10.1167/iovs.06-1416. [DOI] [PMC free article] [PubMed] [Google Scholar]
- Gabriele ML, Ishikawa H, Wollstein G, Bilonick RA, Townsend KA, Kagemann L, Wojtkowski M, Srinivasan VJ, Fujimoto JG, Duker JS, Schuman JS. Optical coherence tomography scan circle location and mean retinal nerve fiber layer measurement variability. Invest Ophthalmol Vis Sci. 2008;49:2315–2321. doi: 10.1167/iovs.07-0873. [DOI] [PMC free article] [PubMed] [Google Scholar]
- Galeotti J, Sajjad A, Wang B, Kagemann L, Shulka G, Siegel M, Wu B, Klatzky R, Wollstein G, Schuman JS, Stetten G. The OCT penlight: In-situ image guidance for microsurgery. SPIE Medical Imaging 2010 2010 [Google Scholar]
- Gallemore RP, Jumper JM, McCuen BW, 2nd, Jaffe GJ, Postel EA, Toth CA. Diagnosis of vitreoretinal adhesions in macular disease with optical coherence tomography. Retina. 2000;20:115–120. [PubMed] [Google Scholar]
- Giovannini A, Amato G, Mariotti C. The macular thickness and volume in glaucoma: an analysis in normal and glaucomatous eyes using OCT. Acta Ophthalmol Scand Suppl. 2002;236:34–36. doi: 10.1034/j.1600-0420.80.s236.44.x. [DOI] [PubMed] [Google Scholar]
- Gonzalez-Garcia AO, Vizzeri G, Bowd C, Medeiros FA, Zangwill LM, Weinreb RN. Reproducibility of RTVue Retinal Nerve Fiber Layer Thickness and Optic Disc Measurements and Agreement with Stratus Optical Coherence Tomography Measurements. Am J Ophthalmol. 2009 doi: 10.1016/j.ajo.2008.12.032. [DOI] [PMC free article] [PubMed] [Google Scholar]
- Greaney MJ, Hoffman DC, Garway-Heath DF, Nakla M, Coleman AL, Caprioli J. Comparison of optic nerve imaging methods to distinguish normal eyes from those with glaucoma. Invest Ophthalmol Vis Sci. 2002;43:140–145. [PubMed] [Google Scholar]
- Greenfield DS, Bagga H, Knighton RW. Macular thickness changes in glaucomatous optic neuropathy detected using optical coherence tomography. Arch Ophthalmol. 2003;121:41–46. doi: 10.1001/archopht.121.1.41. [DOI] [PubMed] [Google Scholar]
- Guedes V, Schuman JS, Hertzmark E, Wollstein G, Correnti A, Mancini R, Lederer D, Voskanian S, Velazquez L, Pakter HM, Pedut-Kloizman T, Fujimoto JG, Mattox C. Optical coherence tomography measurement of macular and nerve fiber layer thickness in normal and glaucomatous human eyes. Ophthalmology. 2003;110:177–189. doi: 10.1016/s0161-6420(02)01564-6. [DOI] [PMC free article] [PubMed] [Google Scholar]
- Gupta V, Gupta P, Singh R, Dogra MR, Gupta A. Spectral-domain Cirrus high-definition optical coherence tomography is better than time-domain Stratus optical coherence tomography for evaluation of macular pathologic features in uveitis. Am J Ophthalmol. 2008;145:1018–1022. doi: 10.1016/j.ajo.2008.01.021. [DOI] [PubMed] [Google Scholar]
- Gurses-Ozden R, Ishikawa H, Hoh ST, Liebmann JM, Mistlberger A, Greenfield DS, Dou HL, Ritch R. Increasing sampling density improves reproducibility of optical coherence tomography measurements. J Glaucoma. 1999;8:238–241. [PubMed] [Google Scholar]
- Hammer DX, Ferguson RD, Magill JC, Paunescu LA, Beaton S, Ishikawa H, Wollstein G, Schuman JS. Active retinal tracker for clinical optical coherence tomography systems. J Biomed Opt. 2005;10:024038. doi: 10.1117/1.1896967. [DOI] [PMC free article] [PubMed] [Google Scholar]
- Han IC, Jaffe GJ. Comparison of Spectral- and Time-Domain Optical Coherence Tomography for Retinal Thickness Measurements in Healthy and Diseased Eyes. Am J Ophthalmol. 2009 doi: 10.1016/j.ajo.2008.11.019. [DOI] [PubMed] [Google Scholar]
- Hoh ST, Greenfield DS, Mistlberger A, Liebmann JM, Ishikawa H, Ritch R. Optical coherence tomography and scanning laser polarimetry in normal, ocular hypertensive, and glaucomatous eyes. Am J Ophthalmol. 2000;129:129–135. doi: 10.1016/s0002-9394(99)00294-9. [DOI] [PubMed] [Google Scholar]
- Huber R, Adler DC, Srinivasan VJ, Fujimoto JG. Fourier domain mode locking at 1050 nm for ultra-high-speed optical coherence tomography of the human retina at 236,000 axial scans per second. Opt Lett. 2007;32:2049–2051. doi: 10.1364/ol.32.002049. [DOI] [PubMed] [Google Scholar]
- Inoue M, Watanabe Y, Arakawa A, Sato S, Kobayashi S, Kadonosono K. Spectral-domain optical coherence tomography images of inner/outer segment junctions and macular hole surgery outcomes. Graefes Arch Clin Exp Ophthalmol. 2009;247:325–330. doi: 10.1007/s00417-008-0999-9. [DOI] [PubMed] [Google Scholar]
- Ishikawa H, Gabriele ML, Wollstein G, Ferguson RD, Hammer DX, Paunescu LA, Beaton SA, Schuman JS. Retinal nerve fiber layer assessment using optical coherence tomography with active optic nerve head tracking. Invest Ophthalmol Vis Sci. 2006;47:964–967. doi: 10.1167/iovs.05-0748. [DOI] [PMC free article] [PubMed] [Google Scholar]
- Ishikawa H, Kim J, Friberg TR, Wollstein G, Kagemann L, Gabriele ML, Townsend KA, Sung KR, Duker JS, Fujimoto JG, Schuman JS. Three-dimensional optical coherence tomography (3D-OCT) image enhancement with segmentation-free contour modeling C-mode. Invest Ophthalmol Vis Sci. 2009;50:1344–1349. doi: 10.1167/iovs.08-2703. [DOI] [PMC free article] [PubMed] [Google Scholar]
- Ishikawa H, Stein DM, Wollstein G, Beaton S, Fujimoto JG, Schuman JS. Macular segmentation with optical coherence tomography. Invest Ophthalmol Vis Sci. 2005;46:2012–2017. doi: 10.1167/iovs.04-0335. [DOI] [PMC free article] [PubMed] [Google Scholar]
- Jackle S, Gladkova N, Feldchtein F, Terentieva A, Brand B, Gelikonov G, Gelikonov V, Sergeev A, Fritscher-Ravens A, Freund J, Seitz U, Soehendra S, Schrodern N. In vivo endoscopic optical coherence tomography of the human gastrointestinal tract--toward optical biopsy. Endoscopy. 2000;32:743–749. doi: 10.1055/s-2000-7711. [DOI] [PubMed] [Google Scholar]
- Jorgensen TM, Thomadsen J, Christensen U, Soliman W, Sander B. Enhancing the signal-to-noise ratio in ophthalmic optical coherence tomography by image registration--method and clinical examples. J Biomed Opt. 2007;12:041208. doi: 10.1117/1.2772879. [DOI] [PubMed] [Google Scholar]
- Jung W, McCormick DT, Ahn YC, Sepehr A, Brenner M, Wong B, Tien NC, Chen Z. In vivo three-dimensional spectral domain endoscopic optical coherence tomography using a microelectromechanical system mirror. Opt Lett. 2007;32:3239–3241. doi: 10.1364/ol.32.003239. [DOI] [PubMed] [Google Scholar]
- Just T, Lankenau E, Huttmann G, Pau HW. Intra-operative application of optical coherence tomography with an operating microscope. J Laryngol Otol. 2009a:1–4. doi: 10.1017/S0022215109004770. [DOI] [PubMed] [Google Scholar]
- Just T, Lankenau E, Huttmann G, Pau HW. Optical coherence tomography of the oval window niche. J Laryngol Otol. 2009b:1–6. doi: 10.1017/S0022215109004381. [DOI] [PubMed] [Google Scholar]
- Kagemann L, Mumcuoglu T, Wollstein G, Bilonick R, Ishikawa H, Townsend KA, Gabriele M, Fujimoto JG, Schuman JS. Sources of longitudinal variability in optical coherence tomography nerve-fibre layer measurements. Br J Ophthalmol. 2008;92:806–809. doi: 10.1136/bjo.2007.129312. [DOI] [PMC free article] [PubMed] [Google Scholar]
- Kakinoki M, Sawada O, Sawada T, Kawamura H, Ohji M. Comparison of macular thickness between Cirrus HD-OCT and Stratus OCT. Ophthalmic Surg Lasers Imaging. 2009;40:135–140. doi: 10.3928/15428877-20090301-09. [DOI] [PubMed] [Google Scholar]
- Kanamori A, Escano MF, Eno A, Nakamura M, Maeda H, Seya R, Ishibashi K, Negi A. Evaluation of the effect of aging on retinal nerve fiber layer thickness measured by optical coherence tomography. Ophthalmologica. 2003;217:273–278. doi: 10.1159/000070634. [DOI] [PubMed] [Google Scholar]
- Kim JS, Ishikawa H, Gabriele ML, Wollstein G, Bilonick RA, Kagemann L, Fujimoto JG, Schuman JS. Retinal nerve fiber layer thickness measurement comparability between time domain optical coherence tomography (OCT) and spectral domain OCT. Invest Ophthalmol Vis Sci. 2010;51:896–902. doi: 10.1167/iovs.09-4110. [DOI] [PMC free article] [PubMed] [Google Scholar]
- Kim JS, Ishikawa H, Sung KR, Xu J, Wollstein G, Bilonick RA, Gabriele ML, Kagemann L, Duker JS, Fujimoto JG, Schuman JS. Retinal nerve fibre layer thickness measurement reproducibility improved with spectral domain optical coherence tomography. Br J Ophthalmol. 2009;93:1057–1063. doi: 10.1136/bjo.2009.157875. [DOI] [PMC free article] [PubMed] [Google Scholar]
- Koizumi H, Spaide RF, Fisher YL, Freund KB, Klancnik JM, Jr, Yannuzzi LA. Three-dimensional evaluation of vitreomacular traction and epiretinal membrane using spectral-domain optical coherence tomography. Am J Ophthalmol. 2008;145:509–517. doi: 10.1016/j.ajo.2007.10.014. [DOI] [PubMed] [Google Scholar]
- Koleva-Georgieva D, Sivkova N. Assessment of serous macular detachment in eyes with diabetic macular edema by use of spectral-domain optical coherence tomography. Graefes Arch Clin Exp Ophthalmol. 2009;247:1461–1469. doi: 10.1007/s00417-009-1124-4. [DOI] [PubMed] [Google Scholar]
- Legarreta JE, Gregori G, Knighton RW, Punjabi OS, Lalwani GA, Puliafito CA. Three-dimensional spectral-domain optical coherence tomography images of the retina in the presence of epiretinal membranes. Am J Ophthalmol. 2008;145:1023–1030. doi: 10.1016/j.ajo.2008.01.014. [DOI] [PubMed] [Google Scholar]
- Leitgeb R, Wojtkowski M, Kowalczyk A, Hitzenberger CK, Sticker M, Fercher AF. Spectral measurement of absorption by spectroscopic frequency-domain optical coherence tomography. Opt Lett. 2000;25:820–822. doi: 10.1364/ol.25.000820. [DOI] [PubMed] [Google Scholar]
- Leng T, Lujan BJ, Yoo SH, Wang J. Three-dimensional spectral domain optical coherence tomography of a clear corneal cataract incision. Ophthalmic Surg Lasers Imaging. 2008;39:S132–134. doi: 10.3928/15428877-20080715-08. [DOI] [PMC free article] [PubMed] [Google Scholar]
- Leung CK, Cheung CY, Lin D, Pang CP, Lam DS, Weinreb RN. Longitudinal variability of optic disc and retinal nerve fiber layer measurements. Invest Ophthalmol Vis Sci. 2008a;49:4886–4892. doi: 10.1167/iovs.07-1187. [DOI] [PubMed] [Google Scholar]
- Leung CK, Cheung CY, Weinreb RN, Lee G, Lin D, Pang CP, Lam DS. Comparison of macular thickness measurements between time domain and spectral domain optical coherence tomography. Invest Ophthalmol Vis Sci. 2008b;49:4893–4897. doi: 10.1167/iovs.07-1326. [DOI] [PubMed] [Google Scholar]
- Leung CK, Cheung CY, Weinreb RN, Qiu Q, Liu S, Li H, Xu G, Fan N, Huang L, Pang CP, Lam DS. Retinal nerve fiber layer imaging with spectral-domain optical coherence tomography: a variability and diagnostic performance study. Ophthalmology. 2009;116:1257–1263. 1263, e1251–1252. doi: 10.1016/j.ophtha.2009.04.013. [DOI] [PubMed] [Google Scholar]
- Li XD, Boppart SA, Van Dam J, Mashimo H, Mutinga M, Drexler W, Klein M, Pitris C, Krinsky ML, Brezinski ME, Fujimoto JG. Optical coherence tomography: advanced technology for the endoscopic imaging of Barrett's esophagus. Endoscopy. 2000;32:921–930. doi: 10.1055/s-2000-9626. [DOI] [PubMed] [Google Scholar]
- Liakopoulos S, Ongchin S, Bansal A, Msutta S, Walsh AC, Updike PG, Sadda SR. Quantitative optical coherence tomography findings in various subtypes of neovascular age-related macular degeneration. Invest Ophthalmol Vis Sci. 2008;49:5048–5054. doi: 10.1167/iovs.08-1877. [DOI] [PMC free article] [PubMed] [Google Scholar]
- Lim H, Jiang Y, Wang Y, Huang YC, Chen Z, Wise FW. Ultrahigh-resolution optical coherence tomography with a fiber laser source at 1 microm. Opt Lett. 2005;30:1171–1173. doi: 10.1364/ol.30.001171. [DOI] [PubMed] [Google Scholar]
- Lin D, Leung CK, Weinreb RN, Cheung CY, Li H, Lam DS. Longitudinal evaluation of optic disc measurement variability with optical coherence tomography and confocal scanning laser ophthalmoscopy. J Glaucoma. 2009;18:101–106. doi: 10.1097/IJG.0b013e318179f879. [DOI] [PubMed] [Google Scholar]
- Liu X, Ling Y, Luo R, Ge J, Zheng X. Optical coherence tomography in measuring retinal nerve fiber layer thickness in normal subjects and patients with open-angle glaucoma. Chin Med J (Engl) 2001;114:524–529. [PubMed] [Google Scholar]
- Medeiros FA, Zangwill LM, Bowd C, Weinreb RN. Comparison of the GDx VCC scanning laser polarimeter, HRT II confocal scanning laser ophthalmoscope, and stratus OCT optical coherence tomograph for the detection of glaucoma. Arch Ophthalmol. 2004;122:827–837. doi: 10.1001/archopht.122.6.827. [DOI] [PubMed] [Google Scholar]
- Menke MN, Dabov S, Knecht P, Sturm V. Reproducibility of retinal thickness measurements in healthy subjects using spectralis optical coherence tomography. Am J Ophthalmol. 2009;147:467–472. doi: 10.1016/j.ajo.2008.09.005. [DOI] [PubMed] [Google Scholar]
- Menke MN, Knecht P, Sturm V, Dabov S, Funk J. Reproducibility of nerve fiber layer thickness measurements using 3D fourier-domain OCT. Invest Ophthalmol Vis Sci. 2008;49:5386–5391. doi: 10.1167/iovs.07-1435. [DOI] [PubMed] [Google Scholar]
- Michalewska Z, Michalewski J, Cisiecki S, Adelman R, Nawrocki J. Correlation between foveal structure and visual outcome following macular hole surgery: a spectral optical coherence tomography study. Graefes Arch Clin Exp Ophthalmol. 2008;246:823–830. doi: 10.1007/s00417-007-0764-5. [DOI] [PubMed] [Google Scholar]
- Mistlberger A, Liebmann JM, Greenfield DS, Pons ME, Hoh ST, Ishikawa H, Ritch R. Heidelberg retina tomography and optical coherence tomography in normal, ocular-hypertensive, and glaucomatous eyes. Ophthalmology. 1999;106:2027–2032. doi: 10.1016/S0161-6420(99)90419-0. [DOI] [PubMed] [Google Scholar]
- Mojana F, Cheng L, Bartsch DU, Silva GA, Kozak I, Nigam N, Freeman WR. The role of abnormal vitreomacular adhesion in age-related macular degeneration: spectral optical coherence tomography and surgical results. Am J Ophthalmol. 2008;146:218–227. doi: 10.1016/j.ajo.2008.04.027. [DOI] [PMC free article] [PubMed] [Google Scholar]
- Moller F, Laursen ML, Sjolie AK. The contribution of microsaccades and drifts in the maintenance of binocular steady fixation. Graefes Arch Clin Exp Ophthalmol. 2006;244:465–471. doi: 10.1007/s00417-004-0989-5. [DOI] [PubMed] [Google Scholar]
- Moller F, Laursen ML, Tygesen J, Sjolie AK. Binocular quantification and characterization of microsaccades. Graefes Arch Clin Exp Ophthalmol. 2002;240:765–770. doi: 10.1007/s00417-002-0519-2. [DOI] [PubMed] [Google Scholar]
- Nakanishi H, Hangai M, Unoki N, Sakamoto A, Tsujikawa A, Kita M, Yoshimura N. Spectral-domain optical coherence tomography imaging of the detached macula in rhegmatogenous retinal detachment. Retina. 2009;29:232–242. doi: 10.1097/IAE.0b013e31818bcd30. [DOI] [PubMed] [Google Scholar]
- Nassif N, Cense B, Park BH, Yun SH, Chen TC, Bouma BE, Tearney GJ, de Boer JF. In vivo human retinal imaging by ultrahigh-speed spectral domain optical coherence tomography. Opt Lett. 2004;29:480–482. doi: 10.1364/ol.29.000480. [DOI] [PubMed] [Google Scholar]
- Nigam N, Bartsch DU, Cheng L, Brar M, Yuson RM, Kozak I, Mojana F, Freeman WR. Spectral domain optical coherence tomography for imaging ERM, retinal edema, and vitreomacular interface. Retina. 2010;30:246–253. doi: 10.1097/IAE.0b013e3181baf6dc. [DOI] [PubMed] [Google Scholar]
- Nouri-Mahdavi K, Hoffman D, Tannenbaum DP, Law SK, Caprioli J. Identifying early glaucoma with optical coherence tomography. Am J Ophthalmol. 2004;137:228–235. doi: 10.1016/j.ajo.2003.09.004. [DOI] [PubMed] [Google Scholar]
- Oh J, Smiddy WE, Flynn HW, Jr, Gregori G, Lujan B. Photoreceptor inner/outer segment defect imaging by spectral domain OCT and visual prognosis after macular hole surgery. Invest Ophthalmol Vis Sci. 2010;51:1651–1658. doi: 10.1167/iovs.09-4420. [DOI] [PubMed] [Google Scholar]
- Patel PJ, Chen FK, da Cruz L, Tufail A. Segmentation error in Stratus optical coherence tomography for neovascular age-related macular degeneration. Invest Ophthalmol Vis Sci. 2009;50:399–404. doi: 10.1167/iovs.08-1697. [DOI] [PubMed] [Google Scholar]
- Pau HW, Lankenau E, Just T, Behrend D, Huttmann G. Optical coherence tomography as an orientation guide in cochlear implant surgery? Acta Otolaryngol. 2007;127:907–913. doi: 10.1080/00016480601089408. [DOI] [PubMed] [Google Scholar]
- Paunescu LA, Schuman JS, Price LL, Stark PC, Beaton S, Ishikawa H, Wollstein G, Fujimoto JG. Reproducibility of nerve fiber thickness, macular thickness, and optic nerve head measurements using StratusOCT. Invest Ophthalmol Vis Sci. 2004;45:1716–1724. doi: 10.1167/iovs.03-0514. [DOI] [PMC free article] [PubMed] [Google Scholar]
- Pieroth L, Schuman JS, Hertzmark E, Hee MR, Wilkins JR, Coker J, Mattox C, Pedut-Kloizman R, Puliafito CA, Fujimoto JG, Swanson E. Evaluation of focal defects of the nerve fiber layer using optical coherence tomography. Ophthalmology. 1999;106:570–579. doi: 10.1016/s0161-6420(99)90118-5. [DOI] [PMC free article] [PubMed] [Google Scholar]
- Poneros JM. Diagnosis of Barrett's esophagus using optical coherence tomography. Gastrointest Endosc Clin N Am. 2004;14:573–588. x. doi: 10.1016/j.giec.2004.03.002. [DOI] [PubMed] [Google Scholar]
- Potsaid B, Gorczynska I, Srinivasan VJ, Chen Y, Jiang J, Cable A, Fujimoto JG. Ultrahigh speed spectral / Fourier domain OCT ophthalmic imaging at 70,000 to 312,500 axial scans per second. Opt Express. 2008;16:15149–15169. doi: 10.1364/oe.16.015149. [DOI] [PMC free article] [PubMed] [Google Scholar]
- Povazay B, Hermann B, Unterhuber A, Hofer B, Sattmann H, Zeiler F, Morgan JE, Falkner-Radler C, Glittenberg C, Blinder S, Drexler W. Three-dimensional optical coherence tomography at 1050 nm versus 800 nm in retinal pathologies: enhanced performance and choroidal penetration in cataract patients. J Biomed Opt. 2007;12:041211. doi: 10.1117/1.2773728. [DOI] [PubMed] [Google Scholar]
- Punjabi OS, Flynn HW, Jr, Knighton RW, Gregori G, Couvillion SS, Lalwani GL, Puliafito CA. Spectral domain optical coherence tomography for proliferative diabetic retinopathy with subhyaloid hemorrhage. Ophthalmic Surg Lasers Imaging. 2008;39:494–496. doi: 10.3928/15428877-20081101-14. [DOI] [PubMed] [Google Scholar]
- Puvanathasan P, Forbes P, Ren Z, Malchow D, Boyd S, Bizheva K. High-speed, high-resolution Fourier-domain optical coherence tomography system for retinal imaging in the 1060 nm wavelength region. Opt Lett. 2008;33:2479–2481. doi: 10.1364/ol.33.002479. [DOI] [PubMed] [Google Scholar]
- Ramrath L, Moreno G, Mueller H, Bonin T, Huettmann G, Schweikard A. Towards multi-directional OCT for speckle noise reduction. Med Image Comput Comput Assist Interv Int Conf Med Image Comput Comput Assist Interv. 2008;11:815–823. doi: 10.1007/978-3-540-85988-8_97. [DOI] [PubMed] [Google Scholar]
- Ratliff F, Riggs LA. Involuntary motions of the eye during monocular fixation. J Exp Psychol. 1950;40:687–701. doi: 10.1037/h0057754. [DOI] [PubMed] [Google Scholar]
- Ricco S, Chen M, Ishikawa H, Wollstein G, Schuman JS. Correcting Motion Artifacts in Retinal Spectral Domain Optical Coherence Tomography via Image Registration. Medical Image Computing and Computer-Assisted Intervention Proceedings. 2009;5761:100–107. doi: 10.1007/978-3-642-04268-3_13. [DOI] [PMC free article] [PubMed] [Google Scholar]
- Sadda SR, Wu Z, Walsh AC, Richine L, Dougall J, Cortez R, LaBree LD. Errors in retinal thickness measurements obtained by optical coherence tomography. Ophthalmology. 2006;113:285–293. doi: 10.1016/j.ophtha.2005.10.005. [DOI] [PubMed] [Google Scholar]
- Sakamoto A, Hangai M, Yoshimura N. Spectral-domain optical coherence tomography with multiple B-scan averaging for enhanced imaging of retinal diseases. Ophthalmology. 2008;115:1071–1078. e1077. doi: 10.1016/j.ophtha.2007.09.001. [DOI] [PubMed] [Google Scholar]
- Sanchez-Tocino H, Alvarez-Vidal A, Maldonado MJ, Moreno-Montanes J, Garcia-Layana A. Retinal thickness study with optical coherence tomography in patients with diabetes. Invest Ophthalmol Vis Sci. 2002;43:1588–1594. [PubMed] [Google Scholar]
- Sander B, Larsen M, Thrane L, Hougaard JL, Jorgensen TM. Enhanced optical coherence tomography imaging by multiple scan averaging. Br J Ophthalmol. 2005;89:207–212. doi: 10.1136/bjo.2004.045989. [DOI] [PMC free article] [PubMed] [Google Scholar]
- Sano M, Shimoda Y, Hashimoto H, Kishi S. Restored photoreceptor outer segment and visual recovery after macular hole closure. Am J Ophthalmol. 2009;147:313–318. e311. doi: 10.1016/j.ajo.2008.08.002. [DOI] [PubMed] [Google Scholar]
- Sayanagi K, Sharma S, Yamamoto T, Kaiser PK. Comparison of Spectral-Domain versus Time-Domain Optical Coherence Tomography in Management of Age-Related Macular Degeneration with Ranibizumab. Ophthalmology. 2009 doi: 10.1016/j.ophtha.2008.11.002. [DOI] [PubMed] [Google Scholar]
- Schmidt-Erfurth U, Leitgeb RA, Michels S, Povazay B, Sacu S, Hermann B, Ahlers C, Sattmann H, Scholda C, Fercher AF, Drexler W. Three-dimensional ultrahigh-resolution optical coherence tomography of macular diseases. Invest Ophthalmol Vis Sci. 2005;46:3393–3402. doi: 10.1167/iovs.05-0370. [DOI] [PubMed] [Google Scholar]
- Schmitt JM, Xiang SH, Yung KM. Speckle in Optical Coherence Tomography. J Biomed Opt. 1999;4:95–105. doi: 10.1117/1.429925. [DOI] [PubMed] [Google Scholar]
- Schulz E. Binocular micromovements in normal persons. Graefes Arch Clin Exp Ophthalmol. 1984;222:95–100. doi: 10.1007/BF02150640. [DOI] [PubMed] [Google Scholar]
- Schuman JS. Spectral domain optical coherence tomography for glaucoma (an AOS thesis) Trans Am Ophthalmol Soc. 2008;106:426–458. [PMC free article] [PubMed] [Google Scholar]
- Schuman JS, Hee MR, Puliafito CA, Wong C, Pedut-Kloizman T, Lin CP, Hertzmark E, Izatt JA, Swanson EA, Fujimoto JG. Quantification of nerve fiber layer thickness in normal and glaucomatous eyes using optical coherence tomography. Arch Ophthalmol. 1995;113:586–596. doi: 10.1001/archopht.1995.01100050054031. [DOI] [PubMed] [Google Scholar]
- Schuman SG, Koreishi AF, Farsiu S, Jung SH, Izatt JA, Toth CA. Photoreceptor layer thinning over drusen in eyes with age-related macular degeneration imaged in vivo with spectral-domain optical coherence tomography. Ophthalmology. 2009;116:488–496. e482. doi: 10.1016/j.ophtha.2008.10.006. [DOI] [PMC free article] [PubMed] [Google Scholar]
- Scott AW, Farsiu S, Enyedi LB, Wallace DK, Toth CA. Imaging the infant retina with a hand-held spectral-domain optical coherence tomography device. Am J Ophthalmol. 2009;147:364–373. e362. doi: 10.1016/j.ajo.2008.08.010. [DOI] [PubMed] [Google Scholar]
- Sehi M, Grewal DS, Sheets CW, Greenfield DS. Diagnostic ability of Fourier-domain vs time-domain optical coherence tomography for glaucoma detection. Am J Ophthalmol. 2009;148:597–605. doi: 10.1016/j.ajo.2009.05.030. [DOI] [PMC free article] [PubMed] [Google Scholar]
- Sivak MV, Jr, Kobayashi K, Izatt JA, Rollins AM, Ung-Runyawee R, Chak A, Wong RC, Isenberg GA, Willis J. High-resolution endoscopic imaging of the GI tract using optical coherence tomography. Gastrointest Endosc. 2000;51:474–479. doi: 10.1016/s0016-5107(00)70450-0. [DOI] [PubMed] [Google Scholar]
- Srinivasan VJ, Adler DC, Chen Y, Gorczynska I, Huber R, Duker JS, Schuman JS, Fujimoto JG. Ultrahigh-speed optical coherence tomography for three-dimensional and en face imaging of the retina and optic nerve head. Invest Ophthalmol Vis Sci. 2008;49:5103–5110. doi: 10.1167/iovs.08-2127. [DOI] [PMC free article] [PubMed] [Google Scholar]
- Srinivasan VJ, Wojtkowski M, Witkin AJ, Duker JS, Ko TH, Carvalho M, Schuman JS, Kowalczyk A, Fujimoto JG. High-definition and 3-dimensional imaging of macular pathologies with high-speed ultrahigh-resolution optical coherence tomography. Ophthalmology. 2006;113:2054, e2051–2014. doi: 10.1016/j.ophtha.2006.05.046. [DOI] [PMC free article] [PubMed] [Google Scholar]
- Stein DM, Wollstein G, Ishikawa H, Hertzmark E, Noecker RJ, Schuman JS. Effect of corneal drying on optical coherence tomography. Ophthalmology. 2006;113:985–991. doi: 10.1016/j.ophtha.2006.02.018. [DOI] [PMC free article] [PubMed] [Google Scholar]
- Tan O, Chopra V, Lu AT, Schuman JS, Ishikawa H, Wollstein G, Varma R, Huang D. Detection of macular ganglion cell loss in glaucoma by Fourier-domain optical coherence tomography. Ophthalmology. 2009;116:2305–2314. e2301–2302. doi: 10.1016/j.ophtha.2009.05.025. [DOI] [PMC free article] [PubMed] [Google Scholar]
- Tearney GJ, Brezinski ME, Bouma BE, Boppart SA, Pitris C, Southern JF, Fujimoto JG. In vivo endoscopic optical biopsy with optical coherence tomography. Science. 1997;276:2037–2039. doi: 10.1126/science.276.5321.2037. [DOI] [PubMed] [Google Scholar]
- Uchino E, Uemura A, Doi N, Ohba N. Postsurgical evaluation of idiopathic vitreomacular traction syndrome by optical coherence tomography. Am J Ophthalmol. 2001;132:122–123. doi: 10.1016/s0002-9394(00)00957-0. [DOI] [PubMed] [Google Scholar]
- Unterhuber A, Povazay B, Bizheva K, Hermann B, Sattmann H, Stingl A, Le T, Seefeld M, Menzel R, Preusser M, Budka H, Schubert C, Reitsamer H, Ahnelt PK, Morgan JE, Cowey A, Drexler W. Advances in broad bandwidth light sources for ultrahigh resolution optical coherence tomography. Phys Med Biol. 2004;49:1235–1246. doi: 10.1088/0031-9155/49/7/011. [DOI] [PubMed] [Google Scholar]
- Vizzeri G, Bowd C, Medeiros FA, Weinreb RN, Zangwill LM. Effect of improper scan alignment on retinal nerve fiber layer thickness measurements using Stratus optical coherence tomograph. J Glaucoma. 2008;17:341–349. doi: 10.1097/IJG.0b013e31815c3aeb. [DOI] [PMC free article] [PubMed] [Google Scholar]
- Vokes DE, Jackson R, Guo S, Perez JA, Su J, Ridgway JM, Armstrong WB, Chen Z, Wong BJ. Optical coherence tomography-enhanced microlaryngoscopy: preliminary report of a noncontact optical coherence tomography system integrated with a surgical microscope. Ann Otol Rhinol Laryngol. 2008;117:538–547. doi: 10.1177/000348940811700713. [DOI] [PMC free article] [PubMed] [Google Scholar]
- Wang ZG, Lee C, Waltzer W, Yuan ZJ, Wu ZL, Xie HK, Pan YT. Optical coherence tomography for noninvasive diagnosis of epithelial cancers. Conf Proc IEEE Eng Med Biol Soc. 2006;1:129–132. doi: 10.1109/IEMBS.2006.259452. [DOI] [PubMed] [Google Scholar]
- Wojtkowski M, Srinivasan V, Fujimoto JG, Ko T, Schuman JS, Kowalczyk A, Duker JS. Three-dimensional retinal imaging with high-speed ultrahigh-resolution optical coherence tomography. Ophthalmology. 2005;112:1734–1746. doi: 10.1016/j.ophtha.2005.05.023. [DOI] [PMC free article] [PubMed] [Google Scholar]
- Wolf-Schnurrbusch UE, Enzmann V, Brinkmann CK, Wolf S. Morphologic changes in patients with geographic atrophy assessed with a novel spectral OCT-SLO combination. Invest Ophthalmol Vis Sci. 2008;49:3095–3099. doi: 10.1167/iovs.07-1460. [DOI] [PubMed] [Google Scholar]
- Wollstein G, Ishikawa H, Wang J, Beaton SA, Schuman JS. Comparison of three optical coherence tomography scanning areas for detection of glaucomatous damage. Am J Ophthalmol. 2005a;139:39–43. doi: 10.1016/j.ajo.2004.08.036. [DOI] [PubMed] [Google Scholar]
- Wollstein G, Schuman JS, Price LL, Aydin A, Beaton SA, Stark PC, Fujimoto JG, Ishikawa H. Optical coherence tomography (OCT) macular and peripapillary retinal nerve fiber layer measurements and automated visual fields. Am J Ophthalmol. 2004;138:218–225. doi: 10.1016/j.ajo.2004.03.019. [DOI] [PubMed] [Google Scholar]
- Wollstein G, Schuman JS, Price LL, Aydin A, Stark PC, Hertzmark E, Lai E, Ishikawa H, Mattox C, Fujimoto JG, Paunescu LA. Optical coherence tomography longitudinal evaluation of retinal nerve fiber layer thickness in glaucoma. Arch Ophthalmol. 2005b;123:464–470. doi: 10.1001/archopht.123.4.464. [DOI] [PMC free article] [PubMed] [Google Scholar]
- Xu J, Ishikawa H, Wollstein G, Bilonick RA, Sung KR, Kagemann L, Townsend KA, Schuman JS. Automated assessment of the optic nerve head on stereo disc photographs. Invest Ophthalmol Vis Sci. 2008a;49:2512–2517. doi: 10.1167/iovs.07-1229. [DOI] [PMC free article] [PubMed] [Google Scholar]
- Xu J, Ishikawa H, Wollstein G, Schuman JS. Retinal vessel segmentation on SLO image. Conf Proc IEEE Eng Med Biol Soc. 2008b;2008:2258–2261. doi: 10.1109/IEMBS.2008.4649646. [DOI] [PMC free article] [PubMed] [Google Scholar]
- Yasuno Y, Miura M, Kawana K, Makita S, Sato M, Okamoto F, Yamanari M, Iwasaki T, Yatagai T, Oshika T. Visualization of sub-retinal pigment epithelium morphologies of exudative macular diseases by high-penetration optical coherence tomography. Invest Ophthalmol Vis Sci. 2009;50:405–413. doi: 10.1167/iovs.08-2272. [DOI] [PubMed] [Google Scholar]
- Yi K, Mujat M, Park BH, Sun W, Miller JW, Seddon JM, Young LH, de Boer JF, Chen TC. Spectral domain optical coherence tomography for quantitative evaluation of drusen and associated structural changes in non-neovascular age-related macular degeneration. Br J Ophthalmol. 2009;93:176–181. doi: 10.1136/bjo.2008.137356. [DOI] [PMC free article] [PubMed] [Google Scholar]
- Zangwill LM, Williams J, Berry CC, Knauer S, Weinreb RN. A comparison of optical coherence tomography and retinal nerve fiber layer photography for detection of nerve fiber layer damage in glaucoma. Ophthalmology. 2000;107:1309–1315. doi: 10.1016/s0161-6420(00)00168-8. [DOI] [PubMed] [Google Scholar]
- Zeimer R, Asrani S, Zou S, Quigley H, Jampel H. Quantitative detection of glaucomatous damage at the posterior pole by retinal thickness mapping. A pilot study. Ophthalmology. 1998;105:224–231. doi: 10.1016/s0161-6420(98)92743-9. [DOI] [PubMed] [Google Scholar]
- Zhang J, Rao B, Chen Z. Swept source based fourier domain functional optical coherence tomography. Conf Proc IEEE Eng Med Biol Soc. 2005;7:7230–7233. doi: 10.1109/IEMBS.2005.1616179. [DOI] [PubMed] [Google Scholar]