

Abstract
BACKGROUND AND PURPOSE
Several clinical trials and in vivo animal experiments have suggested that blockade of angiotensin receptor type 1 (AT1) improves ischaemic outcomes. However, the mechanism(s) underlying these effects has not been elucidated. Here, we have investigated the protective effects of pretreatment with AT1 receptor antagonists, losartan or telmisartan, against ischaemic insult to neurons in vitro.
EXPERIMENTAL APPROACH
Primary rat neuron–astrocyte co-cultures and astrocyte-defined medium (ADM)-cultured pure astrocyte cultures were prepared. Ischaemic injury was modelled by oxygen–glucose depletion (OGD) and lactate dehydrogenase release after OGD was measured with or without AT1 receptor antagonists or agonists (L162313), AT2 receptor antagonist (PD123319) or agonist (CGP-42112A) pretreatment, for 48 h. Activity of glutamate transporter 1 (GLT-1) was evaluated by [3H]-glutamate uptake assays, after AT1 receptor agonists or antagonists. Immunoblot and real-time PCR were used for analysis of protein and mRNA levels of GLT-1.
KEY RESULTS
AT1 receptor agonists augmented OGD-induced cellular damage, which was attenuated by AT1 receptor antagonists. AT1 receptor antagonists also suppressed OGD-induced extracellular glutamate release, reactive oxygen species production and nitric oxide generation. GLT-1 expression and glutamate uptake activity were significantly enhanced by AT1 receptor antagonists and impaired by AT1 receptor agonists. AT1 receptor stimulation suppressed both ADM-induced GLT-1 protein expression and mRNA levels. AT1b receptor knock-down with siRNA enhanced GLT-1 expression. In postnatal (P1–P21) rat brains, protein levels of GLT-1 and AT1 receptors were inversely correlated.
CONCLUSIONS AND IMPLICATIONS
Suppression of AT1 receptor stimulation induced GLT-1 up-regulation, which ameliorated effects of ischaemic injury.
Keywords: AT1 receptor, OGD, astrocyte, GLT-1, stroke, ischaemia
Introduction
Stroke, an insult to the brain, is the second leading cause of death and a major cause of adult disability worldwide (Donnan et al., 2008). Among a wide variety of risk factors for strokes, elevated arterial blood pressure is notable. Even a modest blood pressure decrease (<5 mmHg) significantly reduces the frequency of stroke events (Lo et al., 2003). In addition, compared with other anti-hypertensive therapies, such as calcium-channel blockers, angiotensin-converting enzyme (ACE) inhibitors or angiotensin II receptor (AT1) antagonists (receptor nomenclature follows Alexander et al., 2009) significantly lower the risk of stroke and lead to a comparable reduction in blood pressure, based on reports from the HOPE trial (Yusuf et al., 2000), the ACCESS study (Schrader et al., 2003) and the MOSES study (Schrader et al., 2005). The HOPE study demonstrated that ramipril, an ACE inhibitor, significantly reduced the rates of death, myocardial infarction and stroke in high-risk patients. In ACCESS, candesartan cilexetil, an AT1 receptor antagonist, was reported to have beneficial effects in cerebral and myocardial ischaemia. The MOSES study compared an AT1 receptor antagonist with a calcium channel blocker in secondary stroke prevention. In high-risk hypertensive stroke patients, an early normotensive and comparable blood pressure was achieved. The AT1 receptor antagonist, eprosartan, was reported to be more effective than nitrendipine, a calcium channel blocker. Therefore, in addition to blood pressure control, there are distinct mechanisms for the protection against cerebrovascular and cardiovascular events with ACE inhibitors or AT1 receptor antagonists that still need to be elucidated.
A separate renin–angiotensin system (RAS), independent of the peripheral RAS, exists in the vertebrate CNS (Phillips, 1987) and all the components of the classical RAS, including angiotensinogen, renin, ACE and angiotensin II (Ang II), are present in the brain (Dzau et al., 1986). The brain RAS plays an important role in the regulation of neurogenic hypertension (Gyurko et al., 1993), cerebrovascular fluid homeostasis (Paulson et al., 1988) and sodium intake (Weisinger et al., 1997). In recent years, clinical and experimental evidence has suggested that brain RAS is also involved in strokes (Maeda et al., 1999; Inaba et al., 2009), as well as in several other neurological diseases, such as epilepsy (Ramser et al., 2005), Alzheimer's disease (AbdAlla et al., 2009a,b; Kehoe et al., 2009), Parkinson's disease (Joglar et al., 2009), depression and stress disorders (Wright et al., 2008). Radioimmunoassay and immunohistochemistry were used to demonstrate that brain Ang II was significantly increased at 24 h after transient middle cerebral artery occlusion (Kagiyama et al., 2003).
The angiotensin receptor type 1 (AT1) is commonly expressed in glia in the brain (Sumners et al., 1991), whereas another subtype, angiotensin receptor type 2 (AT2), is mostly present in neurons (Li et al., 2005). AT1 receptors mediate most of the physiological and pathological effects of Ang II, including the elevated angiotensin response after stroke (Phillips, 1987). In angiotensinogen-over-expressing mice, infarct size was enlarged after 1 h of transient middle cerebral artery occlusion. By contrast, a much smaller lesion area of energy failure was reported in AT1 receptor knock-out mice compared to the wild-type littermates (Walther et al., 2002). However, several experimental studies have indicated that alternative over-stimulation of AT2 receptors by Ang II after blocking AT1 receptors might contribute to the neuroprotective effects of AT1 receptor antagonists (Li et al., 2005).
Glutamate, a principal neurotransmitter essential for neuronal synaptic activity in the CNS, is released in significant amounts during strokes (Dávalos et al., 1997). Excessive elevation of extracellular glutamate mainly mediates excitotoxicity and causes neuronal cell death in stroke episodes (Beal, 1992). There is no enzymatic system available for metabolizing glutamate in the extracellular space, and the only way to maintain glutamate homeostasis is through glutamate uptake via the glutamate transporter. The glutamate transporter 1 (GLT-1) in rodents (also known as EAAT2 in humans), predominantly located on astrocytes, is responsible for up to 90% of the glutamate clearance from neuronal synapses in the adult CNS (Rothstein et al., 1996; Danbolt, 2001; Beart and O'Shea, 2007). Reductions or dysfunctions of GLT-1 have also been documented in several other neurological disorders, including epilepsy (Ingram et al., 2001), brain tumours (Münch et al., 2001), Alzheimer's disease (Sasaki et al., 2009), Huntington's disease (Liévens et al., 2001) and amyotrophic lateral sclerosis (ALS) (Lin et al., 1998). Therefore, pharmacological up-regulation of GLT-1 is pivotal for preventing neuronal cell death after strokes and in other neurological disorders.
A relationship between AT1 receptors and GLT-1 expression remains to be elucidated. Both AT1 receptors and GLT-1 proteins are mainly found in astrocytes in the CNS (Danbolt, 2001; Li et al., 2005), so there may be an intrinsic association between astroglial AT1 receptors and GLT-1. In the present study, we sought to clarify the mechanisms underlying the neuroprotective effect of AT1 receptor antagonism and its possible involvement in GLT-1 regulation. In order to remove the influence of AT1 receptors in cerebral microvessels or arteries (Phillips, 1987), primary neuron–astrocyte co-cultures and pure astrocyte cultures were prepared, and oxygen–glucose depletion (OGD) was used to provide an in vitro model of ischaemia.
Methods
Cell cultures
All animal care and experimental procedures in the present study were in strict accordance with the ethical guidelines of the Kyoto University Animal Experimentation Committee. All efforts were made to minimize animal suffering and to reduce the number of animals used in the experiments. Primary neuron–astrocyte co-cultures were obtained from fetal Wistar rats (Japan SLC, Shizuoka, Japan) at embryonic day 17.5 (E17.5) (Kihara et al., 1997). Briefly, pregnant rats were given an anaesthetic dose of sodium pentobarbital (80 mg·kg−1, i.p.), and fetal cerebral cortices were collected and placed in ice-cold Hank's balanced salt solution. The animals were killed by overdosing with sodium pentobarbital. After removal of the meninges, the cortices were dispersed into the same buffer containing 0.25 µg·mL−1 trypsin (5 mL, 37°C, 20 min). Trypsin digestion was stopped by adding a fourfold volume of Eagle's minimal essential medium (EMEM) supplemented with 10% (v/v) heat-inactivated fetal bovine serum (FBS), 2.5 mM l-glutamine and 50 µg·mL−1 kanamycin (growth medium). After gentle trituration, digested tissues were centrifuged (180×g, 4°C, 10 min). The cell pellets were resuspended in 20 mL of growth medium. After filtration through 100 µm nylon mesh, cells were seeded onto 0.5% (v/v) d-polyethyleneimine-coated plates at a density of 2.1 × 10⁵ cells·cm−2. Cultures were incubated in a humidified atmosphere of 5% CO2–95% air at 37°C. Only mature cultures (10–14 days in vitro) were used in this study.
Primary astrocyte cultures were obtained from postnatal day 1 (P1) Wistar rats. Briefly, cerebral cortices were collected, dissociated by gentle trituration with fire-polished glass Pasteur pipettes and centrifuged (180×g, 4°C, 10 min). Cell pellets were resuspended in EMEM supplemented with 10% (v/v) FBS and 50 µg·mL−1 kanamycin (culture medium) and filtered through a 100 µm nylon mesh. Dissociated cells were seeded into 75 cm2 tissue culture flasks and incubated in a humidified atmosphere of 5% CO2–95% air at 37°C. Each flask culture contained 1.5 brains. Cells were grown 20–24 days until confluent. Glial cultures were shaken at 400 rpm (37°C, 10 min), and the supernatant was removed. After recovering in the culture medium (37°C, 2 h), glial cultures were shaken again at a lower speed (220 rpm, 37°C, 15 h) to dislodge the microglia and oligodendrocytes. Astrocyte cultures were detached with solution minimal essential medium containing 0.25 µg·mL−1 trypsin (5 mL per flask, 37°C, 15 min). An equal volume of culture medium was added to stop the trypsin digestion. The suspension was centrifuged (180×g, 24°C, 10 min) and resuspended in Dulbecco's modified Eagle's medium (DMEM, high glucose) supplemented with 10% (v/v) FBS and 50 µg·mL−1 kanamycin [normal medium (NM)]. Astrocyte-defined medium (ADM)-cultured astrocytes were incubated in DMEM (high glucose) supplemented with transferrin (50 µg·mL−1), sodium selenite (5.2 ng·mL−1), fibronectin (1.5 µg·mL−1), heparan sulphate (0.5 µg·mL−1), epidermal growth factor (EGF; 10 ng·mL−1), basic fibroblast growth factor (bFGF; 5 ng·mL−1), insulin (5 µg·mL−1) and kanamycin (50 µg·mL−1) (Miller et al., 1995). The seeding density was 2.5 × 10⁴ cells·cm−2. Cells presented in the culture were shown to be astrocytes with a purity of 97 ± 2% after characterization by immunostaining with a primary specific anti-glial fibrillary acidic protein (GFAP) antibody.
OGD
OGD experiments were performed using an AnaeroPack System (Kawahara et al., 2005). Briefly, neuron–astrocyte co-cultures used for OGD experiments were washed twice with 5% CO2–95% N2 bubbled glucose-free Earl's balanced salt solution (EBSS), and culture media were replaced with the same EBSS. Co-cultures were placed into a 5% CO2–95% N2-pre-flushed (at least 15 min) anaerobic chamber. Near-anaerobic conditions were achieved using deoxygenation reagents that catalytically reacted with residual oxygen in the well-sealed anaerobic chamber. The oxygen level was monitored by an anoxic indicator in the chamber according to the manufacturer's instructions. Within 1 h of incubation at 37°C, a near-anaerobic condition of <1% O2 concentration and >5% CO2 concentration was achieved. The exposure time to sub-lethal OGD was 90 min. The OGD was terminated by exchanging the medium with phenol red-free EMEM [10% (v/v) FBS, 50 µg·mL−1 kanamycin], and then incubated in a normoxic incubator at 37°C (reperfusion). Control co-cultures, which were not depleted of oxygen, were kept in EBSS containing 5.5 mM glucose and in a humidified atmosphere of 5% CO2–95% air at 37°C.
Assessment of cell viability
The amount of lactate dehydrogenase (LDH) released from damaged neuronal cells induced by OGD was measured using an MTX-LDH assay kit according to the manufacturer's instructions. Briefly, 25 µL of phenol red-free reperfusion medium was collected 24 h after OGD, added into a 96-well plate and then incubated with 75 µL of the reaction solution. After 30 min of incubation at 37°C, the reaction was terminated by adding 100 µL of the stop solution. The LDH value was spectrophotometrically measured at 570 nm with a Bio-Rad microplate reader (Hercules, CA, USA). The LDH activities in the control and experimental groups were normalized by subtraction of the basal LDH amount of phenol red-free medium and plotted as the percentage of the LDH released from the control group.
Reactive oxygen species (ROS) assay
Intracellular generation of ROS was detected using a sensitive fluorescent probe 5-(and-6)-chloromethyl-2′,7′-dichlorodihydro-fluorescein diacetate, acetyl ester (CM-H2DCFDA) according to the manufacturer's instructions. Briefly, cells cultured in a 96-well black-walled plate were incubated with CM-H2DCFDA (10 µM) diluted in EBSS in a humidified atmosphere of 5% CO2–95% air (37°C, 1 h). After being washed twice with the same buffer without CM-H2DCFDA, the cultures were recovered in phenol red-free EMEM without FBS for 15 min. The fluorescent value was measured using a WALLAC ARVO SXFL multilabel counter (excitation 485 nm/emission 538 nm). The ROS generation in the control and experimental groups was normalized by subtraction of the basal ROS amount in the medium and plotted as the percentage of the ROS amount of the control group.
Glutamic acid/glutamate release assay
Glutamic acid/glutamate release induced by OGD was measured using the Amplex Red Glutamic Acid/Glutamate Oxidase Assay Kit according to the manufacturer's instructions. Briefly, 50 µL of supernatant of phenol red-free reperfusion medium was collected and added into a 96-well black-walled plate. After adding an equal volume of the enzymatic reaction solution containing 0.08 U·mL−1 glutamate oxidase, 200 µM l-alanine, 0.05 U·mL−1l-glutamate-pyruvate transaminase, 100 µM 10-acetyl-3,7-dihydroxyphenoxazine (Amplex Red reagent) and 0.25 U·mL−1 horseradish peroxidase (HRP), the mixed solution was incubated at 37°C for 1 h to generate a highly fluorescent product, resorufin (Mohanty et al., 1997). The fluorescence was excited at 544 nm, detected at 590 nm and measured using a FLEX STATION spectrofluorometer (Molecular Devices, Sunnyvale, CA, USA). The extracellular glutamate level was detected as an increase in the resorufin fluorescence value. The fluorescence value was normalized by subtracting the basal glutamate level of the phenol red-free medium and plotted as the percentage of the glutamate released from the control groups.
Nitric oxide (NO) release assay
NO concentration induced by OGD was determined using the Nitrate/Nitrite Colorimetric Assay Kit according to the manufacturer's instructions. Briefly, at 48 h after OGD, 50 µL of supernatant fluid of the phenol red-free reperfusion medium was collected and added into a 96-well plate. After adding 25 µL Griess Reagent 1 immediately followed by 25 µL Griess Reagent 2, the plate was sealed with a plastic plate cover, gently shaken and incubated at 37°C for 15 min to allow colour development. The absorbance at 540 nm was measured using a Bio-Rad microplate reader. A nitrite standard curve was drawn for each experiment to calculate relative NO values. The NO release in the control and experiment groups was normalized by subtraction of the basal NO amount of the phenol red-free medium, and plotted as the percentage of NO release from the control group.
[3H]-glutamate uptake
Neuron–astrocyte co-cultures and astrocyte cultures grown on 24-well plates were prepared, and [3H]-glutamate uptake assay was performed as previously described (Nakagawa et al., 2008). Briefly, cells were incubated with Na+ or Na+-free uptake buffer containing 100 µM glutamate and 1 µCi·mL−1[3H]-glutamate for 10 min. The [3H]-glutamate uptake was stopped by washing with ice-cold Dulbecco's phosphate-buffered saline (DPBS). Cells were lysed with 100 µL of 0.3% (v/v) Triton X-100 solution. Lysate (70 µL) was used for radioactivity measurement with a liquid scintillation counter; a fraction of the remaining lysate was used for protein concentration determination. After subtraction of the basal [3H]-glutamate uptake ([3H]-glutamate uptake in Na+-free buffer), the [3H]-glutamate uptake in the control and experimental groups was normalized by protein concentration and plotted as the percentage of control [3H]-glutamate uptake values.
Immunocytochemistry
Primary cultures were plated on sterilized, 7 mm round glassware. After defined culture periods, cells were fixed with freshly prepared 4% (w/v) paraformaldehyde at room temperature for 15 min. Cells were incubated with the same buffer, which contained 5% (v/v) normal goat serum and 0.005% (w/v) saponin for blockage and permeabilization (room temperature, 30 min) and then incubated with either of two primary antibodies, mouse monoclonal anti-GFAP antibody (1:500) or rabbit polyclonal anti-GLT-1 antibody (1:500) diluted in DPBS [1% (v/v) goat normal serum, 0.005% (w/v) saponin, 4°C, overnight]. Cells were incubated (room temperature, 1 h) with two secondary antibodies, Cy2-conjugated AffiniPure goat anti-mouse IgG (H+L) or Cy3-conjugated AffiniPure goat anti-rabbit IgG (H+L), followed by cell nucleus staining with 4′,6-diamidino-2-phenylindole (DAPI) (room temperature, 10 min). The immunostained cells were mounted on glass coverslips in FluorSave reagent. After being dried, immunoreactive cells were visualized and photographed with an Olympus IX81 fluorescence microscope (Olympus Optical, Tokyo, Japan).
Western blot analysis
After being rinsed three times with ice-cold DPBS, cells were solubilized in lysis buffer containing 20 mM Tris–HCl, 2 mM Na2EGTA, 25 mM 2-glycerophosphate, 2 mM dithiothreitol, 1% (v/v) Triton X-100, 1% (v/v) protease inhibitor cocktails and 1% (v/v) phosphatase inhibitor cocktails (on ice, 30 min). The cell lysates were collected by gentle scraping and centrifuged at 16 100×g for 20 min at 4°C. The total protein in supernatant fluids in each sample was determined using the Bio-Rad Protein Assay kit. The prepared samples were stored at −20°C until analysed. For the brain sample, the cortex was collected, homogenized mechanically and then processed in the same way as above.
Cell lysates (10 µL) from each sample fraction were loaded for sodium dodecyl sulphate–polyacrylamide gel electrophoresis, and then transferred onto polyvinylidene difluoride membranes. The membranes were incubated in buffer containing 5% (w/v) non-fat milk (room temperature, 1 h) for non-specific binding blockage, and then incubated with rabbit polyclonal anti-GLT-1 (1:500), rabbit polyclonal anti-AT1 receptor (1:500) or mouse monoclonal anti-GAPDH (1:100 000) diluted in PBS–Tween buffer (4°C, overnight). The membranes were then incubated with HRP-conjugated secondary antibodies. Immunoreactive specific protein bands were visualized with an enhanced chemiluminescence detection system, and exposed to X-ray film. Densitometric analysis was performed using ImageJ 1.36b.
RNA interference
Stealth/siRNA duplex oligoribonucleotides (Agtr1b-RSS34217) for AT1b RNA interference and Stealth RNAi Negative Control Duplexes (cat. no. 12935-112) were purchased from Invitrogen, Tokyo, Japan. The rat AT1b RNA interference sequence was 5′-AUA CGU UUC GGU AGA UGA CGG CUG G-3′. The RNA interference studies were performed using a Targefect-siRNA transfection kit according to the manufacturer's instructions. Briefly, 200 pmol of dsRNA was used to form 1 mL of the transfection complex solution. Astrocytes grown on a six-well plate were incubated with the transfection complex solution at 37°C for 2 h. One millilitre of DMEM (20% FBS) was added and incubated for 10 h (37°C). Astrocytes were recovered in NM for 2 h and then incubated with ADM or used for further treatments.
Real-time PCR
Total RNA was extracted from cells grown on six-well plates with an ISOGEN kit (Nippon Gen, Tokyo, Japan) according to the manufacturer's instructions. The RNA concentration was determined spectrophotometrically and the purity was confirmed by the relative absorbance of OD260 versus OD280. After being treated with DNase inhibitors, 2 µg of RNA was used to generate cDNA in a reverse transcription–PCR reaction using a PrimeScript 1st Strand cDNA Synthesis Kit (Takara Bio Inc., Shiga, Japan). Real-time PCR (RT-PCR) was performed for the amplification of rat GLT-1 and rat cyclophilin A using a Thermal Cycler Dice Real Time System TP850 (Takara Bio Inc.) (Wang et al., 2009). RT-PCR was carried out on a total volume of 25 µL containing 100 ng cDNA template, 0.2 µM of the primers and 12.5 µL of the SYBR II Premix EX Taq solution (2×). The primers used were: rat GLT-1 forward, 5′-GTT CAA GGA CGG GAT GAA TGT CTT A-3′, and reverse, 5′-CAT CAG CTT GGC CTG CTC AC-3′; and rat cyclophilin A forward, 5′-GGC AAA TGC TGG ACC AAA CAC-3′, and reverse, 5′-AAA CGC TCC ATG GCT TCC AC-3′. PCR amplification was conducted under the following protocol: step 1: 10 s at 95°C; step 2: 40 cycles of 5 s at 95°C and 30 s at 60°C; and step 3: 15 s at 95°C, 30 s at 60°C and 15 s at 95°C. Each experiment was conducted three times and each sample was run in triplicate. For quantitative analysis, amplifications were performed under the same conditions with five quantities (100, 20, 4, 0.8 and 0.16 ng) of each cDNA template mixture using the primer of GLT-1 and cyclophilin A respectively. Relative standard curves were generated by plotting the cycle threshold (CT) values versus the log of the cDNA concentration respectively. Based on the CT values obtained from each sample, the relative amounts of target genes GLT-1 or cyclophilin A in the control and experimental groups were calculated using the standard curves with the software provided by Takara Thermal Cycler Dice Real Time System. Each sample was run in triplicate and normalized to the relative amplification of rat cyclophilin A.
Statistical analysis
Values are expressed as the mean ± SE of at least three independent experiments. Differences between means were determined with a one-way anova followed by a pairwise comparison by using the GraphPad Prism Software 4.03. Differences were considered statistically significant when the P value was less than 0.05.
Materials
The following reagents were used: l-[3H]-glutamate from GE Healthcare (Buckinghamshire, UK); 5-(and-6)-chloromethyl-2′,7′-dichlorodihydrofluorescein diacetate, acetyl ester (CM-H2DCFDA) and Amplex Red Glutamic Acid/Glutamate Oxidase Assay Kit from Invitrogen (Carlsbad, CA, USA); Stealth/siRNA duplex oligoribonucleotides (Agtr1b-RSS34217) and Stealth RNAi Negative Control Duplexes (cat. no. 12935-112) from Invitrogen Japan; transferrin from Roche (Basel, Switzerland); CGP-42112A, L162313, PD123319 and mouse monoclonal anti-GFAP antibody from Sigma (St Louis, MO, USA); EGF and bFGF from Peprotech (Rocky Hill, NJ, USA); Ang II from Bachem (Torrance, CA, USA); losartan from LKT Laboratories (St Paul, MN, USA); telmisartan as a kind gift from Boehringer Ingelheim (Ingelheim, Germany); lactacystin and FluorSave reagent from Calbiochem (San Diego, CA, USA); AnaeroPack System from Mitsubishi Gas Chemical (Tokyo, Japan); MTX-LDH assay kit from Kyokutou Pharmaceutical Industry (Tokyo, Japan); Nitrate/Nitrite Colorimetric Assay Kit from Cayman Chemical (Ann Arbor, MI, USA); rabbit polyclonal anti-AT1 receptor; rabbit polyclonal anti-GLT-1 (cat. no. sc-15317) from Santa Cruz (Delaware, CA, USA); mouse monoclonal anti-GAPDH from Ambion (Austin, TX, USA); DAPI from Molecular Probes (Eugene, OR, USA); ISOGEN kit from Nippon Gen; PrimeScript 1st Strand cDNA Synthesis Kit and SYBR II Premix EX Taq Kit from Takara Bio Inc.; and Targefect-siRNA transfection kit from Targeting Systems (San Diego, CA, USA).
Results
Treatment with AT1 receptor antagonists reduces OGD-induced neuronal cell death
To investigate the in vitro protective effects of AT1 receptor antagonists on neuron–astrocyte co-cultures, an AnaeroPack system was used to perform the OGD experiments in the present studies. First, we carried out a time-course study to determine the exposure time needed for OGD insults. The LDH release was increased in a time-dependent manner after OGD (Figure 1A). A 90 min OGD treatment induced moderate cell death (approximately twofold increase of LDH) after 24 h reperfusion. By microscopic observation, only neuronal loss was found; astrocyte death was not observed in our OGD system based on the TUNEL staining (data not shown). No LDH release was detected during OGD. Neuronal cell death induced by 90 min OGD was rescued by NMDA antagonist MK801 (10 µM). In contrast, a 120 min OGD treatment was lethal to neurons. Treatment with MK801 (10 µM) after the 24 h reperfusion served as a positive control in the present studies, totally attenuating LDH release in our OGD system (Figure 1B). This result was further confirmed with another NMDA receptor antagonist, AP5 (data not shown). These results indicated that glutamate-mediated excessive excitatory neurotoxicity after OGD insult was primarily responsible for neuronal cell death in our system.
Figure 1.
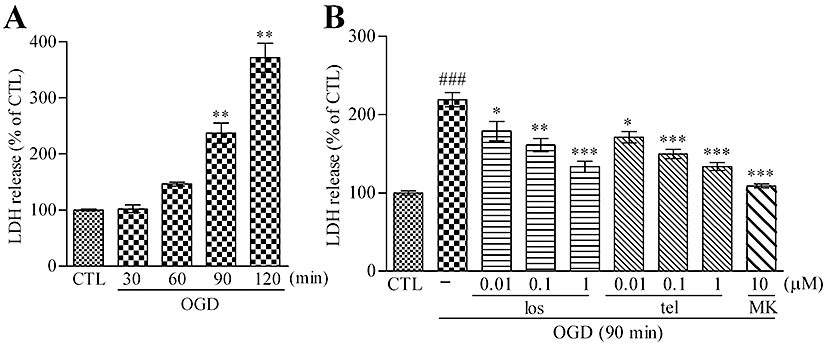
AT1 receptor antagonist pretreatment reduces OGD-induced LDH release from neuron–astrocyte co-cultures. (A) OGD injury using the AnaeroPack system induced LDH release from neuron–astrocyte co-cultures in a time-dependent manner. Data represent mean ± SE, n= 6 for each group. **P < 0.01 versus control; anova followed by Dunnett's multiple comparison test. (B) A 48 h pretreatment with the AT1 receptor antagonist, losartan (0.01–1 µM) or telmisartan (0.01–1 µM), reduced LDH release induced by 90 min OGD in a concentration-dependent manner. A 24 h post-treatment of MK801 (10 µM) also reduced the LDH release after 90 min OGD. Data represent mean ± SE, n= 7 for each group. ###P < 0.001 versus control; *P < 0.05, **P < 0.01, ***P < 0.001 versus OGD; anova followed by Newman–Keuls multiple comparison test. los, losartan; tel, telmisartan; MK, MK801.
Losartan, a surmountable/non-competitive AT1 receptor antagonist, and telmisartan, an insurmountable/non-competitive AT1 receptor antagonist (Timmermans, 1999) were used in our experiments. A 48 h pretreatment with losartan or telmisartan significantly reduced OGD-induced LDH release in neuron–astrocyte co-cultures in a concentration-dependent manner (0.1–1 µM) (Figure 1B). In our preliminary experiments, a shorter treatment with AT1 receptor antagonists (24 h) did not exert a significant protective effect (data not shown). The AT1 receptor antagonist treatment might be involved in protection against the glutamate-mediated excitatory neurotoxicity after OGD.
Using pure neuron cultures (Appendix S1), OGD-induced or glutamate-induced cell death was not prevented by 48 h pretreatment with telmisartan (Figures S1 and S2). In contrast, exposure of neuron–astrocyte co-cultures to glutamate also caused cell death, and 48 h pretreatment with telmisartan significantly reduced glutamate-induced LDH release (Figure S3). These data suggested that astrocytes were necessary for the neuroprotective effect.
Pretreatment is essential for the neuroprotective effects of AT1 receptor antagonists against OGD
The protective effects of pretreatment and post-treatment with AT1 receptor antagonists were compared. Our data showed that telmisartan (1 µM) did not show any neuroprotective effects in 24 h AT1 receptor antagonist post-treatment during the reperfusion period (Figure 2A). Next, the involvement of AT2 receptors in the AT1 receptor antagonist-induced neuroprotective effect was examined. Simultaneous treatment with an AT2 receptor antagonist, PD123319 (10 µM), did not abolish the neuroprotective effect of telmisartan (1 µM) (Figure 2B). Furthermore, AT2 receptor stimulation with CGP-42112A (1 µM) alone did not show any neuroprotective effect. Simultaneous treatment with CGP-42112A (1 µM) and telmisartan (1 µM) did not show any enhancement of AT1 receptor antagonist-induced protection against OGD (Figure 2C). Even in a higher concentration of CGP-42112A (3–30 µM), no protective effect was observed (Figure 2D). Therefore, our results suggested that the AT1 receptor antagonism is essential for the AT1 antagonist-induced neuroprotective effect against OGD and that AT2 receptor stimulation did not affect the OGD injury.
Figure 2.
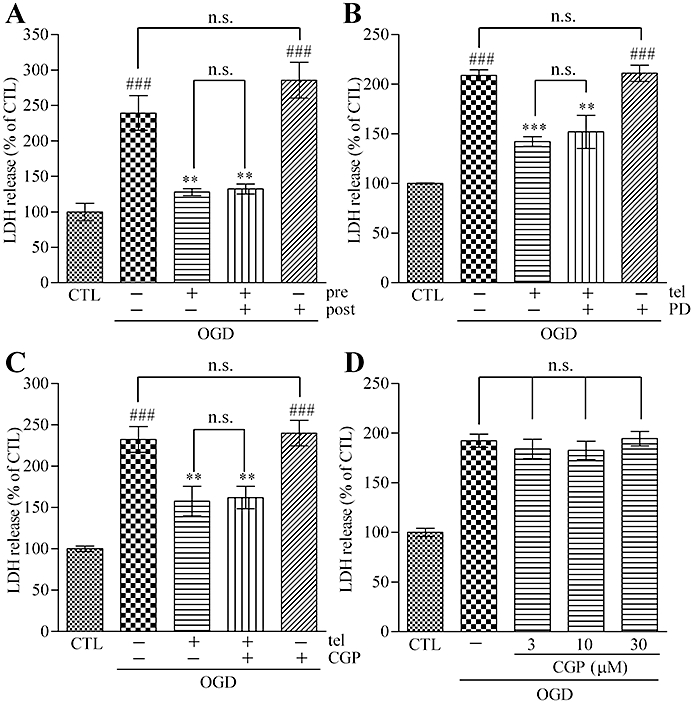
Pre-blockade of AT1 receptors is essential for the neuroprotective effect of AT1 receptor antagonism against OGD. (A) A 24 h post-treatment with telmisartan (1 µM) did not show neuroprotective effects. A 48 h pretreatment plus 24 h post-treatment with telmisartan (1 µM) did not enhance the neuroprotective effect of 48 h pretreatment of telmisartan (1 µM). (B) Simultaneous 48 h pretreatment of the AT2 receptor antagonist, PD123319 (10 µM), did not abolish the neuroprotective effect of telmisartan (1 µM) against the effects of 90 min OGD. PD123319 (10 µM) alone did not affect the OGD-induced LDH release. (C) A 48 h pretreatment with the AT2 receptor antagonist, CGP-42112A (1 µM), alone did not show neuroprotective effects against 90 min OGD. A simultaneous 48 h pretreatment with CGP-42112A (1 µM) did not enhance the neuroprotective effect of telmisartan (1 µM). (D) Higher concentration treatment of CGP-42112A (3–30 µM) did not exert neuroprotective effects. Data represent mean ± SE, n= 6 for each group. ###P < 0.001 versus control; **P < 0.01, ***P < 0.001 versus OGD; anova followed by Newman–Keuls multiple comparison test. n.s., not significant; tel, telmisartan; PD, PD123319; CGP, CGP-42112A; pre, pretreatment; post, post-treatment.
Based on these data, we hypothesized that AT1 receptor stimulation might augment OGD-induced cellular damage. For the continuous stimulation of AT1 receptors, a non-peptidergic AT1 receptor agonist, L162313, was selected for the experiments, because it is characterized by a rather slow, but more sustained AT1 receptor agonist activity (Perlman et al., 1995). Ang II (100 µM) or L162313 (10 µM) was added alone or together with 48 h pretreatment with telmisartan (1 µM). The results showed that pretreatment with Ang II or L162313 evoked increased LDH release after OGD, which was attenuated by simultaneous AT1 receptor antagonism with telmisartan (1 µM) (Figure 3A,B). In addition, treatment with MK801 (10 µM) during the 24 h reperfusion significantly attenuated Ang II- or L162313-enhanced OGD-induced LDH release (Figure 3C,D).
Figure 3.

Pre-stimulation of AT1 receptors augments OGD-induced neuronal cell damage. (A) A 48 h pretreatment with Ang II (100 µM) increased LDH release induced by 90 min OGD, and it was attenuated by simultaneous treatment with telmisartan (1 µM). (B) A 48 h pretreatment with the AT1 receptor agonist, L162313 (10 µM), increased the OGD-induced LDH release. Simultaneous treatment with telmisartan (1 µM) decreased L162313 (10 µM)-enhanced OGD-induced LDH release. (C) A 48 h pretreatment with Ang II (100 µM) increased the 90 min OGD-induced LDH release, and it was attenuated by 24 h post-treatment with MK801 (10 µM). (D) A 48 h pretreatment with L162313 (10 µM) increased the OGD-induced LDH release which was significantly decreased by 24 h post-treatment with MK801 (10 µM). Data represent mean ± SE, n= 6 for each group. #P < 0.05; ###P < 0.001 versus control; *P < 0.05, **P < 0.01, ***P < 0.001 versus OGD; $$P < 0.01, $$$P < 0.001 versus OGD plus Ang II (100 µM) or OGD plus L162313 (10 µM); anova followed by Newman–Keuls multiple comparison test. tel, telmisartan; Ang II, angiotensin II; L162, L162313; MK, MK801.
Altogether, these data suggested that pre-exposure to AT1 receptor antagonism and/or stimulation clearly affected the responses of neuronal cells to OGD.
Treatment with AT1 receptor antagonists reduces OGD-induced glutamate release, ROS generation and NO release
As shown in Figures 1B and 3C,D, MK801 protected neuronal cells against OGD, implying that glutamate release following OGD insult was the main mechanism in our OGD-induced neuronal cell death model. To clarify this mechanism, we evaluated the extracellular glutamate concentration after OGD. A 90 min exposure to OGD induced significant glutamate release in neuron–astrocyte co-cultures. A 48 h pretreatment with AT1 receptor antagonists, losartan or telmisartan, significantly reduced OGD-induced glutamate release in a concentration-dependent manner (0.01–1 µM) (Figure 4A). Extracellular glutamate release was one of the earliest events encountered with ischaemic injury, and subsequent ROS generation and NO release were important for glutamate-mediated neuronal cell death (Tamura et al., 1992). We evaluated ROS and NO levels after OGD according to the previous reports (Lo et al., 2003; Rossi et al., 2007). The OGD-induced ROS generation was also significantly suppressed by 48 h pretreatment with losartan (0.01–1 µM) or telmisartan (0.01–1 µM) in neuron–astrocyte co-cultures (Figure 4B). The NO release was significantly increased when measured at the end of the 48 h reperfusion after OGD. A 48 h pretreatment of losartan (0.01–1 µM) or telmisartan (0.01–1 µM) significantly suppressed this OGD-induced NO release (Figure 4C).
Figure 4.
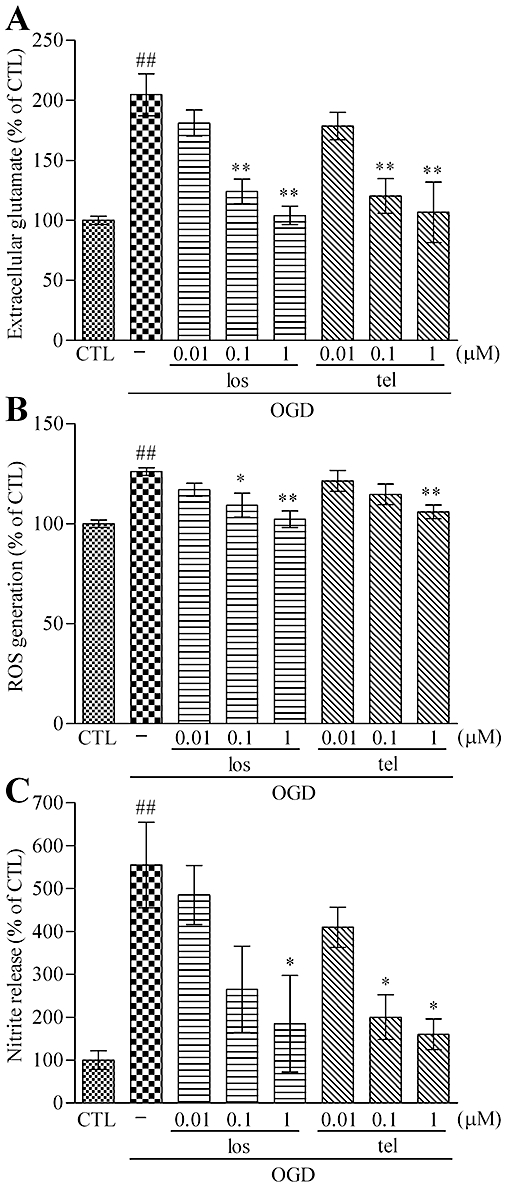
Pretreatment with AT1 receptor antagonist reduces OGD-induced glutamate release, ROS generation and NO release. (A) ODG-induced extracellular glutamate release (from 413 ± 24 nM to 831 ± 122 nM) was reduced by 48 h pretreatment with losartan or telmisartan in a concentration-dependent manner (0.01–1 µM). (B) A 48 h pretreatment with losartan (0.01–1 µM) or telmisartan (0.01–1 µM) reduced the OGD-induced ROS generation in a concentration-dependent manner. (C) OGD-induced NO release (from 267 ± 101 nM to 1480 ± 461 nM) was reduced by 48 h pretreatment with losartan or telmisartan in a concentration-dependent manner (0.01–1 µM). Data represent mean ± SE, n= 3 for each group. ##P < 0.01; ###P < 0.001 versus control; *P < 0.05, **P < 0.01 versus OGD; anova followed by Newman–Keuls multiple comparison test. los, losartan; tel, telmisartan.
These results suggested that decreasing the concentration of extracellular glutamate after OGD might be the neuroprotective mechanism of AT1 receptor antagonists.
Treatment with AT1 receptor antagonists increases GLT-1 expression and glutamate uptake in neuron–astrocyte co-cultures
The GLT-1, an astroglial protein, is mainly responsible for removal of extracellular glutamate in the CNS (Danbolt, 2001). Therefore, we investigated whether AT1 receptor antagonists could affect GLT-1 expression in neuron–astrocyte co-cultures.
A 48 h treatment with telmisartan (1 µM) significantly up-regulated the protein level of GLT-1. After a longer-term treatment (4 or 6 days), GLT-1 was more profoundly up-regulated (data not shown). In contrast, a 48 h treatment with the AT1 receptor agonist, L162313 (10 µM), significantly down-regulated the GLT-1 expression level in neuron–astrocyte co-cultures (Figure 5A).
Figure 5.
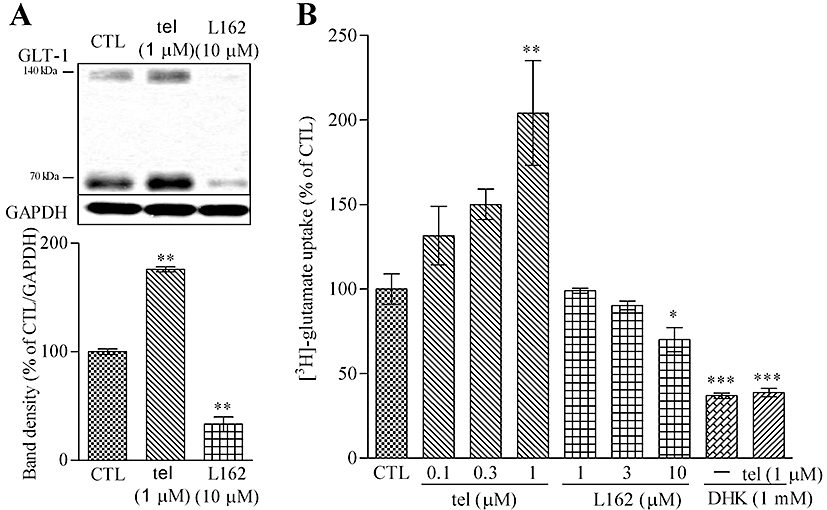
GLT-1 expression and glutamate uptake in neuron–astrocyte co-cultures are affected by AT1 receptor antagonism or stimulation. (A) GLT-1 protein level was increased by 48 h treatment with telmisartan (1 µM) and was decreased by L162313 (AT1 receptor agonist, 10 µM). (B) [3H]-glutamate uptake ability was enhanced by 48 h treatment with telmisartan and was reduced by L162313. DHK (GLT-1 inhibitor, 1 mM) significantly reduced telmisartan (1 µM)-induced enhancement of [3H]-glutamate uptake. Data represent mean ± SE, n= 3 for each group. *P < 0.05, **P < 0.01 versus control; anova followed by Dunnett's multiple comparison test. tel, telmisartan; L162, L162313.
Consistent with the results of GLT-1 protein regulation, [3H]-glutamate uptake was significantly increased after 48 h treatment with telmisartan (0.1–1 µM) and L162313 (1–10 µM) significantly decreased [3H]-glutamate uptake in a concentration-dependent manner (Figure 5B). In addition, GLT-1 inhibitor, dihydrokainic acid (DHK), significantly abolished AT1 receptor antagonist-induced [3H]-glutamate uptake (Figure 5B). DHK is a relatively selective GLT-1 inhibitor, although the effect was found at millimolar levels in our experiments. Other agents are available that would further clarify the relative contribution of GLT-1 (EAAT2) compared to that of another transporter, GLAST (EAAT1) in these cultures (Peacey et al., 2009).
These results suggested that AT1 receptors were involved in the regulation of GLT-1 expression and glutamate uptake. Thus AT1 receptor antagonism reduced the extracellular glutamate elevation induced by OGD injury via up-regulation of GLT-1.
L162313 down-regulates GLT-1 expression in ADM-cultured astrocytes
Pure astrocyte cultures were prepared to investigate the mechanism of GLT-1 regulation in the absence of neuronal cells. Because astrocytes cultured in NM (DMEM + 10% FBS) express only very low levels of GLT-1 protein, ADM-cultured astrocytes were used in the following experiments. An ADM culture, a modification of G-5 supplement, is a well-established culture method suitable for inducing in vitro astrocyte maturation; this methodology provided us with a convenient approach for GLT-1 regulation research (Miller et al., 1995; Vermeiren et al., 2005).
After a 4 day culture with ADM, the typical flat polygonal morphology of astrocytes was significantly changed, showing a highly branched, stellate morphology similar to the morphology of astrocytes in vivo. GLT-1 expression was significantly up-regulated after the 4 day ADM culture (Figure 6A,B). Simultaneous treatment with the non-peptidergic AT1 receptor agonist, L162313, during the 4 days of ADM culture, caused significant down-regulation of the GLT-1 protein level in a concentration-dependent manner (0.1–3 µM) (Figure 6B). A relatively high concentration of 3 µM L162313 almost totally suppressed GLT-1 protein expression. No LDH release was detected with L162313 treatment, suggesting that no cell damage occurred during the treatment (data not shown).
Figure 6.
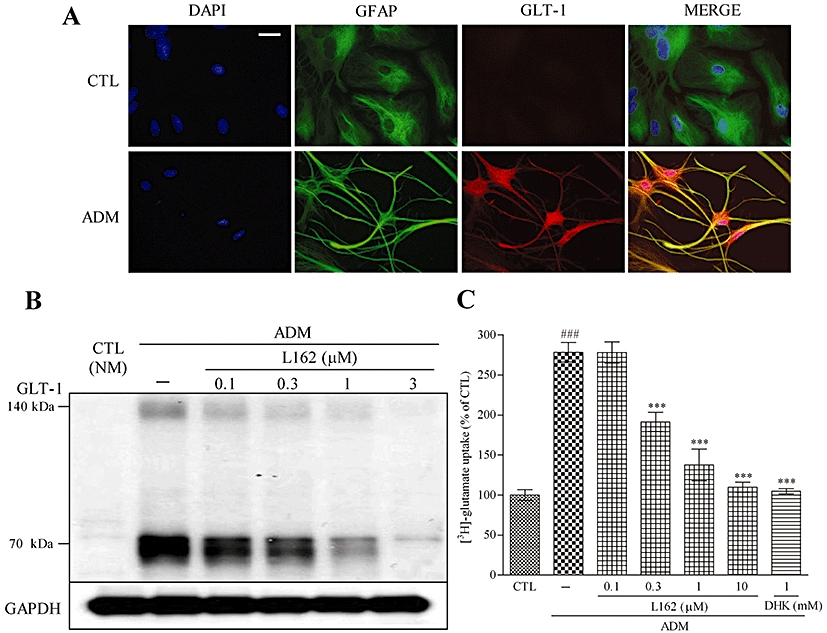
L162313 down-regulates GLT-1 expression in ADM-cultured astrocytes. (A) Astrocytes were immunostained with DAPI (blue), anti-GFAP (green) and anti-GLT-1 (red). Four-day incubation with ADM changed the morphology of astrocytes, leading to a highly branched, stellate shape comparison to the typical flat polygonal morphology in CTL (NM). GLT-1 expression was up-regulated according to the GLT-1 (red) immunostain. Scale bar: 30 µm. (B) Simultaneous 4 day treatment with L162313 (AT1 receptor agonist) decreased GLT-1 expression induced by ADM culture. (C) Four-day ADM culture increased the [3H]-glutamate uptake ability. Simultaneous administration with L162313 (0.1–3 µM) attenuated the ADM-enhanced [3H]-glutamate uptake in a concentration-dependent manner. DHK (1 mM) significantly reduced ADM-induced enhancement of [3H]-glutamate uptake. Data represent mean ± SE, n= 3 for each group. ###P < 0.001 versus control; ***P < 0.001 versus ADM; anova followed by Newman–Keuls multiple comparison test. L162, L162313.
After 4 days of ADM culture, [3H]-glutamate uptake was significantly enhanced, and L162313 treatment abolished this ADM-induced increase in [3H]-glutamate uptake in a concentration-dependent manner (0.1–3 µM) (Figure 6C). These results suggested that AT1 receptor stimulation with L162313 down-regulated the expression of GLT-1 protein and glutamate uptake in ADM-cultured astrocytes.
L162313 reduces GLT-1 mRNA synthesis in ADM-cultured astrocytes
Because ubiquitination has been implicated in GLT-1 endocytosis and degradation (Sheldon et al., 2008), and AT1 receptor signalling contributes to the activation of the ubiquitin–proteasome system (Kurihara et al., 2008), experiments using proteasome inhibitors were performed. Simultaneous treatment with the proteasome inhibitor, lactacystin (0.3 µM), did not affect the decrease of GLT-1 induced by L162313 (Figure 7A).
Figure 7.
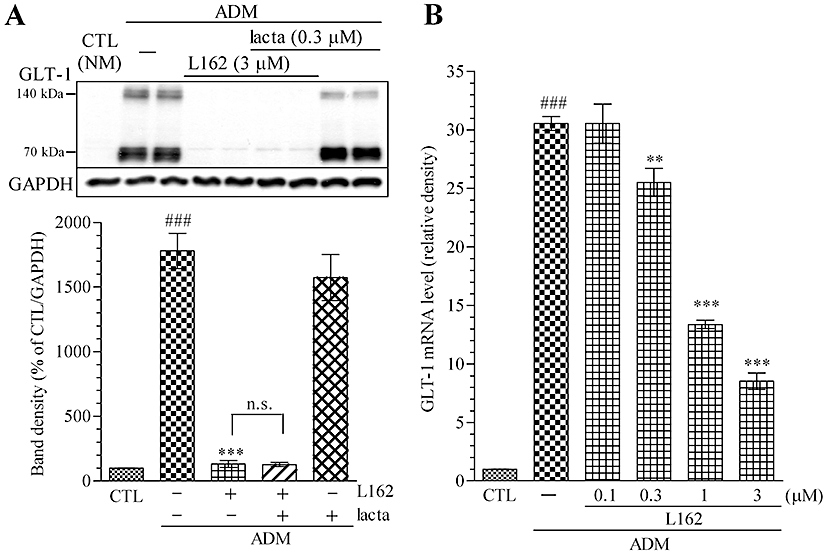
L162313 (AT1 receptor agonist) reduces GLT-1 protein expression at a transcriptional level. (A) L162313 treatment decreased GLT-1 expression induced by 4 days of ADM culture. Simultaneous 4 day treatment with the proteasome inhibitor lactacystin (0.3 µM) did not attenuate L162313 (3 µM)-induced GLT-1 down-regulation in ADM-cultured astrocytes. (B) GLT-1 mRNA level was increased by ADM culture (4 days) and was decreased by L162313 (0.1–3 µM) to 8.5 ± 0.7 in a concentration-dependent manner. Data represent mean ± SE, n= 3 for each group. ###P < 0.001 versus control; **P < 0.01, ***P < 0.001 versus ADM; anova followed by Newman–Keuls multiple comparison test. n.s., not significant; lacta, lactacystin; L162, L162313.
In contrast, real-time PCR analysis revealed an enhancement of GLT-1 mRNA after a 4 day ADM culture, and simultaneous L162313 treatment abolished the ADM-induced up-regulation of GLT-1 mRNA in a concentration-dependent manner (0.1–3 µM) (Figure 7B).
These results indicated that AT1 receptor stimulation with L162313 influenced GLT-1 expression at a transcriptional level in ADM-cultured astrocytes.
AT1 receptors are involved in GLT-1 regulation in astrocytes
To confirm that AT1 receptors were actually involved in GLT-1 regulation, RNA interference experiments targeting astroglial AT1 receptors were performed. Although there are two sub-types of the AT1 receptor, AT1a and AT1b, in the rodent brain RAS system, we selected knock-down of AT1b receptors alone, as this has been reported to decrease the AT1 receptors and responses to Ang II in rat CNS (Lu et al., 1995). Stealth/siRNA duplex oligoribonucleotides (Agtr1b-RSS34217) were delivered to the astrocytes for RNA interference with AT1b receptors (Figure 8A). After a 4 day ADM culture, the AT1 receptors in siAT1b-treated astrocytes were approximately half of those in the negative control siRNA-treated group, according to the Western blot analysis (Figure 8C). At the same time, the GLT-1 protein level was significantly up-regulated in siAT1b-treated astrocytes, and GLT-1 protein reduction by L162313 was significantly attenuated (Figure 8B). These results confirmed our hypothesis that AT1 receptor signalling was involved in regulation of GLT-1 expression, at least during the ADM-induced astroglial maturation.
Figure 8.
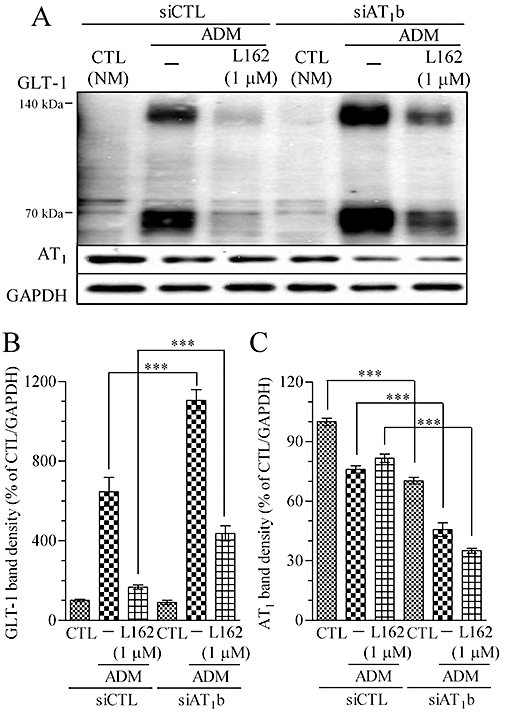
RNA interference experiments revealed that AT1 receptors are involved in GLT-1 expression in ADM-cultured astrocytes. (A) Representative immunoblot data of GLT-1, AT1 and GAPDH treated with or without RNA interference for AT1b receptors in astrocytes. (B) Compared with GLT-1 in the control ADM treatment, GLT-1 in siAT1b-treated astrocytes was increased. The diminishing ADM-induced GLT1 up-regulation by L162313 (AT1 receptor agonist, 1 µM) was impaired with mRNA interference for AT1b receptors (from 167.8 ± 10.3 to 436.8 ± 37.4). (C) The AT1 receptor band density was down-regulated in CTL from 100 ± 1.9 to 70.2 ± 1.7, in ADM from 76 ± 1.9 to 45.7 ± 3.4 and in ADM plus L162313 (1 µM) from 81.6 ± 2.1 to 35.1 ± 1.2. Data represent mean ± SE, n= 3 for each group. ***P < 0.001; anova followed by Newman–Keuls multiple comparison test. L162, L162313.
As previously reported, the expression of GLT-1 protein progressively increased to adult levels from the postnatal day 1 (P1) to postnatal day 21 (P21), and this period was almost equal to that of in vivo astrocyte maturation (Furuta et al., 1997). Therefore, we hypothesized that AT1 receptors might also be involved in astrocyte maturation in vivo. The cortices from rats at P1, P7, P14 and P21 showed that GLT-1 was gradually increased (Figure 9A). Meanwhile, the AT1 receptor level from P1 to P21 was significantly decreased with increased GLT-1 (Figure 9B,C).
Figure 9.
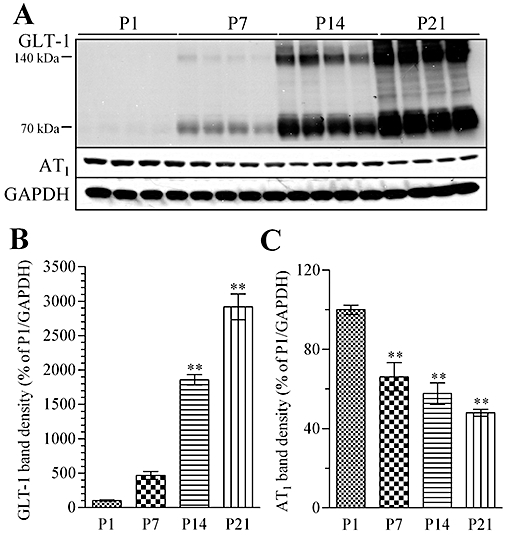
GLT-1 and AT1 receptor levels in rat cortex on postnatal day 1 (P1), P7, P14 and P21. (A) Representative immunoblot data of GLT-1, AT1 receptors and GAPDH of rat cortex at P1, P7, P14 and P21. (B) GLT-1 protein level increased progressively in cortices from P7, P14 and P21 rats (expressed as % of P1). (C) In the same samples, AT1 receptor protein levels decreased progressively in P7, P14 and P21 rats (expressed as % of P1). Data represent mean ± SE, n= 4 for each group. **P < 0.01 versus control; anova followed by Dunnett's multiple comparison test.
Discussion
In the present study, we demonstrated that pretreatment with AT1 receptor antagonists showed neuroprotective effects against OGD and that AT1 receptor antagonist affected GLT-1 regulation in neuron–astrocyte co-cultures. A 48 h pretreatment with AT1 receptor antagonists, losartan or telmisartan, significantly protected neuronal cells against OGD injury. Longer-term pretreatment facilitated the neuroprotective effects of the AT1 receptor antagonists, whereas post-treatment did not reduce the neuronal cell damage induced by OGD.
The original design for the present OGD protocol was based on a stroke cascade: exaggerated glutamate release soon after cerebrovascular perfusion acts as an initiator of the events following a stroke. There was no LDH release during OGD, which models the characteristics of the ischaemic penumbra areas rather than the necrotic cores, and this factor should be taken into consideration when using our OGD protocol.
Extracellular glutamate levels after OGD were significantly reduced by pretreatment with AT1 receptor antagonists. In addition, ROS and NO were mediators of the OGD-induced cell death, and these factors are generated after glutamate receptor stimulation. Attenuation of extracellular glutamate might result in the attenuation of ROS generation or NO release.
AT1 receptor antagonists might cause alternative enhancement of AT2 receptor stimulation by Ang II, and AT2 receptor blockade could attenuate AT1 antagonist-induced neuroprotective effects (Li et al., 2005). Our co-cultures displayed both AT1 and AT2 receptor proteins (Figure S4). However, simultaneous treatment with an AT2 receptor antagonist, PD123319, did not attenuate the protective effect of AT1 antagonists against OGD in our system. Furthermore, an AT2 receptor agonist did not exert neuroprotective effects as proposed. Involvement of AT2 receptors in the neuroprotection seems therefore to be unlikely in our cultures.
To emphasize the crucial role of AT1 receptors in regulation of tolerance to ischaemic injury, AT1 receptor agonist (L162313 or Ang II) was given before OGD and resulted in increased neuronal cell damage. AT1 receptor antagonism before exposure to OGD was necessary to show protection, and the involvement of AT2 receptors would appear to be minimal in our OGD model. AT1 receptor stimulation by Ang II might provide the cytotoxic or cell death-enhancing signals. As AT1 receptors are mainly located on astrocytes, whereas AT2 receptors are on neurons in the CNS, a possible role for AT1 receptor antagonism in astroglial glutamate uptake is likely. Both GLT-1 protein levels and glutamate uptake were significantly enhanced in the neuron–astrocyte co-cultures after treatment with AT1 receptor antagonists. Furthermore, an AT1 receptor agonist (L162313) impaired GLT-1 protein expression and glutamate uptake. From these findings, we could conclude that AT1 receptor signalling in astroglial cells suppressed GLT-1 expression. However, degradation of GLT-1, mediated by the ubiquitin–proteasome system (Kurihara et al., 2008), seems not to be involved in this suppression.
To confirm the AT1 receptor-specific response, siRNA experiments targeting AT1 receptors were subsequently performed. The ADM-induced increased GLT-1 protein level and glutamate uptake were significantly inhibited by L162313 treatment. AT1 receptor knock-down attenuated the reduction of GLT-1 mediated by L162313. AT1 receptor knock-down itself enhanced the protein level of GLT-1, indicating the existence of intrinsic AT1 receptor agonists or spontaneous AT1 receptor activation. However, agonist-independent or constitutive activity has not been reported for AT1 receptors or most G protein-coupled receptors (GPCRs), except for thyroid-stimulating hormone and muscarinic receptors (de Gasparo et al., 2000).
Several signal pathways were identified for manipulating GLT-1, including various growth factor-mediated pathways. The ADM used in the present study included a number of supplementary agents. EGF and bFGF were considered as being particularly responsible for astroglial morphological changes and GLT-1 up-regulation. In NM, morphologies of astrocytes are different from those found in neuron–astrocyte co-cultures. In contrast, stellate-shaped astrocytes cultured in ADM are similar to those found in the co-culture or brains in vivo. Removal of EGF and bFGF disabled ADM for astroglial maturation, resulting in the flat polygonal morphology (data not shown). In the present study, ADM was used for the induction of astrocyte maturation (Miller et al., 1995), because expressing GLT-1 was considered one of the defining features of astroglial maturation.
Transcriptional regulation of GLT-1 is not fully understood. Blockade of central angiotensin AT1 receptors improves neurological outcomes after brain ischaemia and reduces expression of AP-1 transcription factors. Transcription of apoptosis-related proteins might be suppressed by AT1 receptor antagonism. In our data, however, mRNA levels of GLT-1 were increased by AT1 receptor antagonism. We could assume that AT1 receptor antagonism induces the up-regulation of a survival signalling pathway or that AT1 receptor stimulation confers an inhibitory signal on GLT-1. It is not clear how AT1 receptor signalling affects the GLT-1 promoter or if signals from another source apart from the angiotensin receptors up-regulate GLT-1. It was reported that Ang II exerts AT1 receptor-mediated inhibition of adenylyl cyclase activity (de Gasparo et al., 2000), and GLT-1 regulation might be cyclic AMP dependent (Thorlin et al., 1998). AT1 receptors might attenuate the inhibitory signal for the expression of GLT-1 via cyclic AMP regulation. Other candidate transcription factors binding to the GLT-1 promoter include nuclear factor-kappaB (NF-κB), peroxisome proliferator-activated receptor-gamma and kappa B-motif binding phosphoprotein (Zelenaia et al., 2000; Romera et al., 2007; Lepore et al., 2008). Growth factors in ADM would activate receptor tyrosine kinases (RTKs). In contrast, long-term GPCR activation could desensitize and down-regulate the RTK response. Pre-exposure of mesangial cells to 5-HT attenuated EGF-induced activation of multiple transcription factors, including NF-κB, CREB and E2-F (Grewal et al., 2001). Therefore, sustained stimulation of AT1 receptors, one of the GPCRs, might reduce the RTK response, resulting in the down-regulation of GLT-1 expression via the attenuation of a transcription factor, such as NF-κB. However, detailed mechanisms have not been fully elucidated.
The physiological functions of astroglial GLT-1 in the CNS are of crucial importance. Especially in strokes and in ALS, the levels of astroglial GLT-1 exert a major influence on the pathological progression. Enhanced GLT-1 expression level reinforces the tolerance to ischaemic injury in vitro and in vivo (Rothstein et al., 2005; Romera et al., 2007). Loss of function of GLT-1 has been implicated in the pathogenesis of ALS, resulting in damage of adjacent motor neurons (Rothstein et al., 2005; Lepore et al., 2008; Yang et al., 2009). Other neurodegenerative diseases might also be influenced by GLT-1 function. Therefore, regulation of GLT-1 expression and function is critical in the treatment of neurological disorders mediated by glutamate excitotoxicity.
In conclusion, AT1 receptor antagonists exert neuroprotective effects against the effects of OGD. The contribution of AT2 receptor stimulation appears to be minimal, and blockade of AT1 receptors leads to the up-regulation of GLT-1, resulting in a diminished OGD-induced increase in extracellular glutamate. AT1 receptor signalling could suppress GLT-1 expression by influencing the levels of GLT-1 mRNA. Altogether, our results suggested that AT1 receptor antagonists might be beneficial for the prevention of many neuronal diseases, including stroke.
Acknowledgments
We thank Dr Takayuki Nakagawa (Department of Molecular Pharmacology, Graduate School of Pharmaceutical Sciences, Kyoto University) for kindly providing support for the [3H]-glutamate uptake assay and helpful suggestions.
Glossary
Abbreviations
- ADM
astrocyte-defined medium
- Ang II
angiotensin II
- AT1
angiotensin receptor type 1
- AT2
angiotensin receptor type 2
- GLT-1
glutamate transporter 1
- OGD
oxygen–glucose depletion
- ROS
reactive oxygen species
Conflicts of interest
None.
Supporting information
Additional Supporting Information may be found in the online version of this article:
Appendix S1 Methods.
Figure S1 AT1 receptor antagonist pretreatment has no neuroprotective effect against glutamate-induced neuronal cell death in primary neuron cultures. A 24-h exposure to glutamate (30 µM) induced a significant lactate dehydrogenase (LDH) release in primary neuron cultures, which was almost totally attenuated by simultaneous treatment with MK801 (NMDA receptor antagonist, 10 µM). A 48-h pretreatment with telmisartan (AT1 receptor antagonist, 0.01–1 µM) did not reduce the glutamate-induced LDH release in primary neuron cultures. Data represent mean ± SE, n = 3 for each group. ***P < 0.001 versus control; ###P < 0.001 versus glutamate; analysis of variance followed by Newman-Keuls multiple comparison test. n.s., not significant; CTL, control; Glu, glutamate; tel, telmisartan.
Figure S2 AT1 receptor antagonist pretreatment has no neroprotective effect against oxygen–glucose depletion (OGD)-induced neuronal cell death in primary neuron cultures. A 3-h OGD treatment induced a significant lactate dehydrogenase (LDH) release in primary neuron cultures, which was significantly attenuated by post-treatment with MK801 (NMDA receptor antagonist, 10 µM). A 48-h pretreatment with telmisartan (AT1 receptor antagonist, 0.01–1 µM) did not attenuate the 3-h OGD-induced LDH release in primary neuron cultures. Data represent mean ± SE, n = 3 for each group. ###P < 0.001 versus control; ***P < 0.001 versus OGD; analysis of variance followed by Newman-Keuls multiple comparison test. n.s., not significant; CTL, control; tel, telmisartan.
Figure S3 AT1 receptor antagonist pretreatment attenuates glutamate-induced neuronal cell death in neuron-astrocyte co-cultures. A 24-h exposure to glutamate (100 µM) induced a significant lactate dehydrogenase (LDH) release in neuron-astrocyte co-cultures, which was significantly attenuated by simultaneous treatment with MK801 (NMDA antagonist, 10 µM). A 48-h pretreatment with telmisartan (AT1 receptor antagonist, 0.01–1 µM) significantly reduced the glutamate-induced LDH release in a concentration-dependent manner in neuron-astrocyte co-cultures. Data represent mean ± SE, n = 3 for each group. ###P < 0.001 versus control; **P < 0.01 and ***P < 0.001 versus glutamate; analysis of variance followed by Newman-Keuls multiple comparison test. tel, telmisartan; CTL, control; Glu, glutamate.
Figure S4 Both AT1 receptor and AT2 receptor are expressed in neuron-astrocyte co-cultures. Representative immunoblot data showed that after 10-day incubation with growth medium (Eagle’s minimal essential medium supplemented with 10% (v/v) fetal bovine serum) AT1 receptor and AT2 receptor were expressed in neuron-astrocyte co-cultures. Rabbit polyclonal anti-AT2 receptor antibody and rabbit polyclonal anti-AT1 receptor antibody used in the present study were obtained from Santa Cruz (Delaware, CA, USA).
Please note: Wiley-Blackwell are not responsible for the content or functionality of any supporting materials supplied by the authors. Any queries (other than missing material) should be directed to the corresponding author for the article.
References
- AbdAlla S, Lother H, el Missiry A, Langer A, Sergeev P, el Faramawy Y, et al. Angiotensin II AT2 receptor oligomers mediate G-protein dysfunction in an animal model of Alzheimer disease. J Biol Chem. 2009a;284:6554–6565. doi: 10.1074/jbc.M807746200. [DOI] [PubMed] [Google Scholar]
- AbdAlla S, Lother H, el Missiry A, Sergeev P, Langer A, el Faramawy Y, et al. Dominant negative AT2 receptor oligomers induce G-protein arrest and symptoms of neurodegeneration. J Biol Chem. 2009b;284:6566–6574. doi: 10.1074/jbc.M808277200. [DOI] [PubMed] [Google Scholar]
- Alexander SPH, Mathie A, Peters JA. Guide to Receptors and Channels (GRAC), 4th edn. Br J Pharmacol. 2009;158(Suppl. 1):S1–S254. doi: 10.1111/j.1476-5381.2009.00499.x. [DOI] [PMC free article] [PubMed] [Google Scholar]
- Beal M. Mechanisms of excitotoxicity in neurologic diseases. FASEB J. 1992;6:3338–3344. [PubMed] [Google Scholar]
- Beart P, O'Shea R. Transporters for l-glutamate: an update on their molecular pharmacology and pathological involvement. Br J Pharmacol. 2007;150:5–17. doi: 10.1038/sj.bjp.0706949. [DOI] [PMC free article] [PubMed] [Google Scholar]
- Danbolt N. Glutamate uptake. Prog Neurobiol. 2001;65:1–105. doi: 10.1016/s0301-0082(00)00067-8. [DOI] [PubMed] [Google Scholar]
- Dávalos A, Castillo J, Serena J, Noya M. Duration of glutamate release after acute ischemic stroke. Stroke. 1997;28:708–710. doi: 10.1161/01.str.28.4.708. [DOI] [PubMed] [Google Scholar]
- Donnan G, Fisher M, Macleod M, Davis S. Stroke. Lancet. 2008;371:1612–1623. doi: 10.1016/S0140-6736(08)60694-7. [DOI] [PubMed] [Google Scholar]
- Dzau V, Ingelfinger J, Pratt R, Ellison K. Identification of renin and angiotensinogen messenger RNA sequences in mouse and rat brains. Hypertension. 1986;8:544–548. doi: 10.1161/01.hyp.8.6.544. [DOI] [PubMed] [Google Scholar]
- Furuta A, Rothstein J, Martin L. Glutamate transporter protein subtypes are expressed differentially during rat CNS development. J Neurosci. 1997;17:8363–8375. doi: 10.1523/JNEUROSCI.17-21-08363.1997. [DOI] [PMC free article] [PubMed] [Google Scholar]
- de Gasparo M, Catt K, Inagami T, Wright J, Unger T. International Union of Pharmacology. XXIII. The angiotensin II receptors. Pharmacol Rev. 2000;52:415–472. [PubMed] [Google Scholar]
- Grewal J, Luttrell L, Raymond J. G protein-coupled receptors desensitize and down-regulate epidermal growth factor receptors in renal mesangial cells. J Biol Chem. 2001;276:27335–27344. doi: 10.1074/jbc.M103578200. [DOI] [PubMed] [Google Scholar]
- Gyurko R, Wielbo D, Phillips M. Antisense inhibition of AT1 receptor mRNA and angiotensinogen mRNA in the brain of spontaneously hypertensive rats reduces hypertension of neurogenic origin. Regul Pept. 1993;49:167–174. doi: 10.1016/0167-0115(93)90438-e. [DOI] [PubMed] [Google Scholar]
- Inaba S, Iwai M, Tomono Y, Senba I, Furuno M, Kanno H, et al. Exaggeration of focal cerebral ischemia in transgenic mice carrying human renin and human angiotensinogen genes. Stroke. 2009;40:597–603. doi: 10.1161/STROKEAHA.108.519801. [DOI] [PubMed] [Google Scholar]
- Ingram E, Wiseman J, Tessler S, Emson P. Reduction of glial glutamate transporters in the parietal cortex and hippocampus of the EL mouse. J Neurochem. 2001;79:564–575. doi: 10.1046/j.1471-4159.2001.00612.x. [DOI] [PubMed] [Google Scholar]
- Joglar B, Rodriguez-Pallares J, Rodriguez-Perez A, Rey P, Guerra M, Labandeira-Garcia J. The inflammatory response in the MPTP model of Parkinson's disease is mediated by brain angiotensin: relevance to progression of the disease. J Neurochem. 2009;109:656–669. doi: 10.1111/j.1471-4159.2009.05999.x. [DOI] [PubMed] [Google Scholar]
- Kagiyama T, Kagiyama S, Phillips M. Expression of angiotensin type 1 and 2 receptors in brain after transient middle cerebral artery occlusion in rats. Regul Pept. 2003;110:241–247. doi: 10.1016/s0167-0115(02)00223-9. [DOI] [PubMed] [Google Scholar]
- Kawahara K, Kosugi T, Tanaka M, Nakajima T, Yamada T. Reversed operation of glutamate transporter GLT-1 is crucial to the development of preconditioning-induced ischemic tolerance of neurons in neuron/astrocyte co-cultures. Glia. 2005;49:349–359. doi: 10.1002/glia.20114. [DOI] [PubMed] [Google Scholar]
- Kehoe P, Miners S, Love S. Angiotensins in Alzheimer's disease – friend or foe? Trends Neurosci. 2009;32:619–628. doi: 10.1016/j.tins.2009.07.006. [DOI] [PubMed] [Google Scholar]
- Kihara T, Shimohama S, Sawada H, Kimura J, Kume T, Kochiyama H, et al. Nicotinic receptor stimulation protects neurons against beta-amyloid toxicity. Ann Neurol. 1997;42:159–163. doi: 10.1002/ana.410420205. [DOI] [PubMed] [Google Scholar]
- Kurihara T, Ozawa Y, Nagai N, Shinoda K, Noda K, Imamura Y, et al. Angiotensin II type 1 receptor signaling contributes to synaptophysin degradation and neuronal dysfunction in the diabetic retina. Diabetes. 2008;57:2191–2198. doi: 10.2337/db07-1281. [DOI] [PMC free article] [PubMed] [Google Scholar]
- Lepore A, Rauck B, Dejea C, Pardo A, Rao M, Rothstein J, et al. Focal transplantation-based astrocyte replacement is neuroprotective in a model of motor neuron disease. Nat Neurosci. 2008;11:1294–1301. doi: 10.1038/nn.2210. [DOI] [PMC free article] [PubMed] [Google Scholar]
- Li J, Culman J, Hörtnagl H, Zhao Y, Gerova N, Timm M, et al. Angiotensin AT2 receptor protects against cerebral ischemia-induced neuronal injury. FASEB J. 2005;19:617–619. doi: 10.1096/fj.04-2960fje. [DOI] [PubMed] [Google Scholar]
- Liévens J, Woodman B, Mahal A, Spasic-Boscovic O, Samuel D, Kerkerian-Le Goff L, et al. Impaired glutamate uptake in the R6 Huntington's disease transgenic mice. Neurobiol Dis. 2001;8:807–821. doi: 10.1006/nbdi.2001.0430. [DOI] [PubMed] [Google Scholar]
- Lin C, Bristol L, Jin L, Dykes-Hoberg M, Crawford T, Clawson L, et al. Aberrant RNA processing in a neurodegenerative disease: the cause for absent EAAT2, a glutamate transporter, in amyotrophic lateral sclerosis. Neuron. 1998;20:589–602. doi: 10.1016/s0896-6273(00)80997-6. [DOI] [PubMed] [Google Scholar]
- Lo E, Dalkara T, Moskowitz M. Mechanisms, challenges and opportunities in stroke. Nat Rev Neurosci. 2003;4:399–415. doi: 10.1038/nrn1106. [DOI] [PubMed] [Google Scholar]
- Lu D, Yu K, Raizada M. Retrovirus-mediated transfer of an angiotensin type I receptor (AT1-R) antisense sequence decreases AT1-Rs and angiotensin II action in astroglial and neuronal cells in primary cultures from the brain. Proc Natl Acad Sci USA. 1995;92:1162–1166. doi: 10.1073/pnas.92.4.1162. [DOI] [PMC free article] [PubMed] [Google Scholar]
- Maeda K, Hata R, Bader M, Walther T, Hossmann K. Larger anastomoses in angiotensinogen-knockout mice attenuate early metabolic disturbances after middle cerebral artery occlusion. J Cereb Blood Flow Metab. 1999;19:1092–1098. doi: 10.1097/00004647-199910000-00005. [DOI] [PubMed] [Google Scholar]
- Miller S, Romano C, Cotman C. Growth factor upregulation of a phosphoinositide-coupled metabotropic glutamate receptor in cortical astrocytes. J Neurosci. 1995;15:6103–6109. doi: 10.1523/JNEUROSCI.15-09-06103.1995. [DOI] [PMC free article] [PubMed] [Google Scholar]
- Mohanty J, Jaffe J, Schulman E, Raible D. A highly sensitive fluorescent micro-assay of H2O2 release from activated human leukocytes using a dihydroxyphenoxazine derivative. J Immunol Methods. 1997;202:133–141. doi: 10.1016/s0022-1759(96)00244-x. [DOI] [PubMed] [Google Scholar]
- Münch C, Penndorf A, Schwalenstöcker B, Troost D, Ludolph A, Ince P, et al. Impaired RNA splicing of 5′-regulatory sequences of the astroglial glutamate transporter EAAT2 in human astrocytoma. J Neurol Neurosurg Psychiatry. 2001;71:675–678. doi: 10.1136/jnnp.71.5.675. [DOI] [PMC free article] [PubMed] [Google Scholar]
- Nakagawa T, Otsubo Y, Yatani Y, Shirakawa H, Kaneko S. Mechanisms of substrate transport-induced clustering of a glial glutamate transporter GLT-1 in astroglial–neuronal cultures. Eur J Neurosci. 2008;28:1719–1730. doi: 10.1111/j.1460-9568.2008.06494.x. [DOI] [PubMed] [Google Scholar]
- Paulson O, Waldemar G, Andersen A, Barry D, Pedersen E, Schmidt J, et al. Role of angiotensin in autoregulation of cerebral blood flow. Circulation. 1988;77:I55–I58. 6 Pt 2. [PubMed] [Google Scholar]
- Peacey E, Miller C, Dunlop J, Rattray M. The four major N- and C-terminal splice variants of the excitatory amino acid transporter GLT-1 form cell surface homomeric and heteromeric assemblies. Mol Pharmacol. 2009;75:1062–1073. doi: 10.1124/mol.108.052829. [DOI] [PMC free article] [PubMed] [Google Scholar]
- Perlman S, Schambye H, Rivero R, Greenlee W, Hjorth S, Schwartz T. Non-peptide angiotensin agonist. Functional and molecular interaction with the AT1 receptor. J Biol Chem. 1995;270:1493–1496. doi: 10.1074/jbc.270.4.1493. [DOI] [PubMed] [Google Scholar]
- Phillips M. Functions of angiotensin in the central nervous system. Annu Rev Physiol. 1987;49:413–435. doi: 10.1146/annurev.ph.49.030187.002213. [DOI] [PubMed] [Google Scholar]
- Ramser J, Abidi F, Burckle C, Lenski C, Toriello H, Wen G, et al. A unique exonic splice enhancer mutation in a family with X-linked mental retardation and epilepsy points to a novel role of the renin receptor. Hum Mol Genet. 2005;14:1019–1027. doi: 10.1093/hmg/ddi094. [DOI] [PubMed] [Google Scholar]
- Romera C, Hurtado O, Mallolas J, Pereira M, Morales J, Romera A, et al. Ischemic preconditioning reveals that GLT1/EAAT2 glutamate transporter is a novel PPARgamma target gene involved in neuroprotection. J Cereb Blood Flow Metab. 2007;27:1327–1338. doi: 10.1038/sj.jcbfm.9600438. [DOI] [PubMed] [Google Scholar]
- Rossi D, Brady J, Mohr C. Astrocyte metabolism and signaling during brain ischemia. Nat Neurosci. 2007;10:1377–1386. doi: 10.1038/nn2004. [DOI] [PMC free article] [PubMed] [Google Scholar]
- Rothstein J, Dykes-Hoberg M, Pardo C, Bristol L, Jin L, Kuncl R, et al. Knockout of glutamate transporters reveals a major role for astroglial transport in excitotoxicity and clearance of glutamate. Neuron. 1996;16:675–686. doi: 10.1016/s0896-6273(00)80086-0. [DOI] [PubMed] [Google Scholar]
- Rothstein J, Patel S, Regan M, Haenggeli C, Huang Y, Bergles D, et al. Beta-lactam antibiotics offer neuroprotection by increasing glutamate transporter expression. Nature. 2005;433:73–77. doi: 10.1038/nature03180. [DOI] [PubMed] [Google Scholar]
- Sasaki K, Shimura H, Itaya M, Tanaka R, Mori H, Mizuno Y, et al. Excitatory amino acid transporter 2 associates with phosphorylated tau and is localized in neurofibrillary tangles of tauopathic brains. FEBS Lett. 2009;583:2194–2200. doi: 10.1016/j.febslet.2009.06.015. [DOI] [PubMed] [Google Scholar]
- Schrader J, Lüders S, Kulschewski A, Berger J, Zidek W, Treib J, et al. The ACCESS study: evaluation of acute candesartan cilexetil therapy in stroke survivors. Stroke. 2003;34:1699–1703. doi: 10.1161/01.STR.0000075777.18006.89. [DOI] [PubMed] [Google Scholar]
- Schrader J, Lüders S, Kulschewski A, Hammersen F, Plate K, Berger J, et al. Morbidity and mortality after stroke, eprosartan compared with nitrendipine for secondary prevention: principal results of a prospective randomized controlled study (MOSES) Stroke. 2005;36:1218–1226. doi: 10.1161/01.STR.0000166048.35740.a9. [DOI] [PubMed] [Google Scholar]
- Sheldon A, González M, Krizman-Genda E, Susarla B, Robinson M. Ubiquitination-mediated internalization and degradation of the astroglial glutamate transporter, GLT-1. Neurochem Int. 2008;53:296–308. doi: 10.1016/j.neuint.2008.07.010. [DOI] [PMC free article] [PubMed] [Google Scholar]
- Sumners C, Tang W, Zelezna B, Raizada M. Angiotensin II receptor subtypes are coupled with distinct signal-transduction mechanisms in neurons and astrocytes from rat brain. Proc Natl Acad Sci USA. 1991;88:7567–7571. doi: 10.1073/pnas.88.17.7567. [DOI] [PMC free article] [PubMed] [Google Scholar]
- Tamura Y, Sato Y, Akaike A, Shiomi H. Mechanisms of cholecystokinin-induced protection of cultured cortical neurons against N-methyl-d-aspartate receptor-mediated glutamate cytotoxicity. Brain Res. 1992;592:317–325. doi: 10.1016/0006-8993(92)91691-7. [DOI] [PubMed] [Google Scholar]
- Thorlin T, Roginski R, Choudhury K, Nilsson M, Rönnbäck L, Hansson E, et al. Regulation of the glial glutamate transporter GLT-1 by glutamate and delta-opioid receptor stimulation. FEBS Lett. 1998;425:453–459. doi: 10.1016/s0014-5793(98)00288-9. [DOI] [PubMed] [Google Scholar]
- Timmermans P. Pharmacological properties of angiotensin II receptor antagonists. Can J Cardiol. 1999;15(Suppl. F):26F–28F. [PubMed] [Google Scholar]
- Vermeiren C, Najimi M, Vanhoutte N, Tilleux S, de Hemptinne I, Maloteaux JM, et al. Acute up-regulation of glutamate uptake mediated by mGluR5a in reactive astrocytes. J Neurochem. 2005;94:405–416. doi: 10.1111/j.1471-4159.2005.03216.x. [DOI] [PubMed] [Google Scholar]
- Walther T, Olah L, Harms C, Maul B, Bader M, Hörtnagl H, et al. Ischemic injury in experimental stroke depends on angiotensin II. FASEB J. 2002;16:169–176. doi: 10.1096/fj.01-0601com. [DOI] [PubMed] [Google Scholar]
- Wang P, Niidome T, Akaike A, Kihara T, Sugimoto H. Rac1 inhibition negatively regulates transcriptional activity of the amyloid precursor protein gene. J Neurosci Res. 2009;87:2105–2114. doi: 10.1002/jnr.22039. [DOI] [PubMed] [Google Scholar]
- Weisinger R, Blair-West J, Burns P, Denton D, Tarjan E. Role of brain angiotensin in thirst and sodium appetite of rats. Peptides. 1997;18:977–984. doi: 10.1016/s0196-9781(97)00077-6. [DOI] [PubMed] [Google Scholar]
- Wright J, Yamamoto B, Harding J. Angiotensin receptor subtype mediated physiologies and behaviors: new discoveries and clinical targets. Prog Neurobiol. 2008;84:157–181. doi: 10.1016/j.pneurobio.2007.10.009. [DOI] [PMC free article] [PubMed] [Google Scholar]
- Yang Y, Gozen O, Watkins A, Lorenzini I, Lepore A, Gao Y, et al. Presynaptic regulation of astroglial excitatory neurotransmitter transporter GLT1. Neuron. 2009;61:880–894. doi: 10.1016/j.neuron.2009.02.010. [DOI] [PMC free article] [PubMed] [Google Scholar]
- Yusuf S, Sleight P, Pogue J, Bosch J, Davies R, Dagenais G. Effects of an angiotensin-converting-enzyme inhibitor, ramipril, on cardiovascular events in high-risk patients. The Heart Outcomes Prevention Evaluation Study Investigators. N Engl J Med. 2000;342:145–153. doi: 10.1056/NEJM200001203420301. [DOI] [PubMed] [Google Scholar]
- Zelenaia O, Schlag B, Gochenauer G, Ganel R, Song W, Beesley J, et al. Epidermal growth factor receptor agonists increase expression of glutamate transporter GLT-1 in astrocytes through pathways dependent on phosphatidylinositol 3-kinase and transcription factor NF-kappaB. Mol Pharmacol. 2000;57:667–678. doi: 10.1124/mol.57.4.667. [DOI] [PubMed] [Google Scholar]
Associated Data
This section collects any data citations, data availability statements, or supplementary materials included in this article.