

Abstract
Background
We upgraded our recent feedback control system (FBCS) simulation model of human thyroid hormone (TH) regulation to include explicit representation of hypothalamic and pituitary dynamics, and updated TH distribution and elimination (D&E) parameters. This new model greatly expands the range of clinical and basic science scenarios explorable by computer simulation.
Methods
We quantified the model from pharmacokinetic (PK) and physiological human data and validated it comparatively against several independent clinical data sets. We then explored three contemporary clinical issues with the new model: combined triiodothyronine (T3)/thyroxine (T4) versus T4-only treatment, parenteral levothyroxine (L-T4) administration, and central hypothyroidism.
Results
Combined T3/T4 therapy—In thyroidectomized patients, the L-T4–only replacement doses needed to normalize plasma T3 or average tissue T3 were 145 μg L-T4/day or 165 μgL-T4/day, respectively. The combined T4 + T3 dosing needed to normalize both plasma and tissue T3 levels was 105 μg L-T4 + 9 μgT3 per day. For all three regimens, simulated mean steady-state plasma thyroid-stimulating hormone (TSH), T3, and T4 was within normal ranges (TSH: 0.5–5 mU/L; T4: 5–12 μg/dL; T3: 0.8–1.9 ng/mL). Parenteral T4 administration—800 μg weekly or 400 μg twice weekly normalized average tissue T3 levels both for subcutaneous (SC) and intramuscular (IM) routes of administration. TSH, T3, and T4 levels were maintained within normal ranges for all four of these dosing schemes (1× vs. 2× weekly, SC vs. IM). Central hypothyroidism—We simulated steady-state plasma T3,T4, and TSH concentrations in response to varying degrees of central hypothyroidism, reducing TSH secretion from 50% down to 0.1% of normal. Surprisingly, TSH, T3, and T4 plasma concentrations remained within normal ranges for TSH secretion as low as 25% of normal.
Conclusions
Combined T3/T4 treatment—Simulated standard L-T4–only therapy was sufficient to renormalize average tissue T3 levels and maintain normal TSH, T3, and T4 plasma levels, supporting adequacy of standard L-T4–only treatment. Parenteral T4 administration—TSH, T3, and T4 levels were maintained within normal ranges for all four of these dosing schemes (1× vs. 2× weekly, SC vs. IM), supporting these therapeutic alternatives for patients with compromised L-T4 gut absorption. Central hypothyroidism—These results highlight how highly nonlinear feedback in the hypothalamic-pituitary-thyroid axis acts to maintain normal hormone levels, even with severely reduced TSH secretion.
Introduction
Our recently published feedback control system (FBCS) simulation model of human thyroid hormone regulation (1), shown here in Figure 1, had limited predictive capabilities, because it did not explicitly include the dynamics of brain components. We simulated the closed-loop system in that work by replacing the thyroid stimulating hormone (TSH)– and thyrotropin-releasing hormone (TRH)–related submodels—the portions of Figure 1 in the dashed box marked “Brain Submodels”—with human TSH time-course data, and developed a quantified model of the remaining thyroid hormone (TH) submodels. We used this fixed TSH data, which characterizes the output of this group of subsystem components, together with levothyroxine (L-T4) oral doses, as dual inputs in the earlier model, and quantified it completely from human clinical data. This permitted simulation of time-varying free and bound triiodothyronine (T3(t)) and T4(t)—but not TSH(t) levels in plasma and tissues. We did assess several bioequivalence and replacement hormone questions using this model, but further application scenarios were limited to cases where complete time-course TSH(t) data are available for conditions of interest, or when the feedback loop is open, for example, as in thyroidectomized individuals—in which case TSH is inoperative. Explicit models for all six blocks in Figure 1 are needed to more fully address clinical and basic science questions in silico, that is, by computer simulation.
FIG. 1.

Overall feedback control system model of thyroid hormone regulation, with three source organ blocks—the hypothalamus (HYP), anterior pituitary (ANT PIT), and thyroid glands (THYROID)—and three sink blocks—for TRH, TSH, and T3 and T4 distribution and elimination (elimination = metabolism and excretion) (D&E). TRH, thyrotropin-releasing hormone; TSH, thyroid-stimulating hormone; T3, triiodothyronine; T4, thyroxine; SR, secretion rate; p, plasma or portal plasma for TRH-related components; DA, dopamine; SRIH, somatastatin.
We develop, quantify, and validate a quasi-mechanistic representation of the four remaining brain submodel blocks in Figure 1 here, using human closed-loop data for quantification and validation of a simplified aggregate of hypothalamus and pituitary components combined, schematized in Figure 2. This new brain submodel is incorporated into the whole FBCS model of the hypothalamic-pituitary-thyroid (H-P-T) axis, thereby rendering it capable of simulating a wider variety of clinical and experimental scenarios, because it characterizes the secretion and distribution and elimination (D&E) (metabolism + excretion) dynamics of all three FBCS variables—TSH(t) as well as T3(t) and T4(t), in plasma and tissue pools. We independently validate the new model by comparing it to a variety of other clinical data, reassess predictions made with the earlier model, and also apply it to two additional problems of current clinical interest–regulated responses of all three hormones to parenteral L-T4 administration and central hypothyroidism.
FIG. 2.

Simplified brain submodel, structured and quantified from plasma thyroid-stimulating hormone (TSH), triiodothyronine (T3), and thyroxine (T4) concentration data. TSH secretion and distribution and elimination are explicit, thyrotropin-releasing hormone (TRH) is implicit, plasma T3 and T4 are inputs, and plasma TSHp is the model output. A new variable: equivalent T3 in brain, denoted T3B, represents T3 directly or indirectly affecting TSH secretion and located anywhere in brain.
Methods I: Model Development, Quantification, and Validation
Brain submodels
Lumped hypothalamo-pituitary TSH secretion submodel
Plasma TSH is the primary clinical measure of thyroid function, and therefore must be depicted as a controllable variable, rather than as fixed data, because the primary goal of our extended model is to predict TSH responses to other model/system variables affecting it, such as TH. To accomplish this, we need to adequately describe TSH secretion and D&E dynamics in the closed-loop system, over physiological and pathophysiological ranges, in response to T3,T4, and other inputs depicted in Figure 1.
Hypothalamic TRH drives pituitary TSH secretion. Unfortunately, sufficient details on hypothalamic component dynamics are unattainable at present, because we lack the data to distinguish it from the pituitary. For example, time-course pituitary portal plasma TRH concentration data, reflecting endogenous TRH secreted by the hypothalamus under physiological conditions, are not measurable, motivating our aggregation approach. Available data can provide a simplified submodel that captures overall pituitary TSH dynamics and the signals that control TSH secretion.
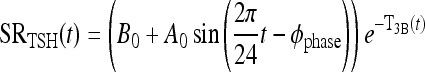
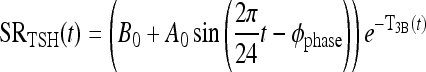
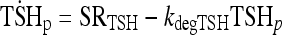
We combined the TRH secretion, TRH D&E, and TSH secretion submodel blocks of Figure 1 into the single, lumped submodel illustrated within the dashed-line box in Figure 2, with a single-output, TSH secretion rate, driven implicitly by TRH, and dual suppressor inputs—plasma T3 and T4 concentrations, T3p(t) and T4p(t). TSH secretion is represented as a harmonic oscillator damped by T3 signals in pituitary and other unspecified brain regions. In this quasi-mechanistic input-output model representation, the identity and pathways for all such T3 signals are unknown, so we define a single, lumped variable representing equivalent T3 in relevant portions of the brain, that is, anterior pituitary, hypothalamus, and so on, which affect TSH secretion, directly and via intermediate pathways. We designate this “brain T3” as T3B(t), with its time dependence shown explicitly.
 |
(1) |
In this equation, SRTSH (t) is the total TSH secretion rate, and B0 is the basal TSH secretion rate with no TH. The second term on the right is the circadian TSH secretion rate component, all damped by brain T3, represented as the negative exponent, T3B(t), in the nonlinear exponential term. 2π/24 is the circadian frequency (period 24 hours), Φphase is the TSH secretion circadian phase [such that maximum TSH occurs at ∼2am (2)], and A0 governs the magnitude of circadian oscillations. Effects of TRH are represented implicitly in the sinusoidal daily circadian rhythm and the basal TSH secretion levels.a
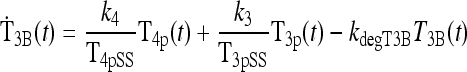
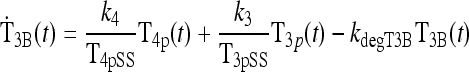
A second equation depicts the dynamics of the unmeasurable and equivalent T3B(t), written in terms of normalized measurable plasma TH levels that presumably regulate T3B(t). We normalized peripheral plasma TH levels, T4p(t) and T3p(t)—to compensate for the roughly 50-fold difference in their plasma concentrations—by dividing them by predose steady-state peripheral plasma levels T4pSS and T3pSS, which helps in quantifying this submodel.
 |
(2) |
The first term of Eq. 2 represents the combined effects of peripheral plasma T4 (i.e., T4p) onT3B appearance in brain, aggregating peripheral plasma T4 influx with its intracellular conversion to brain T3,T3B(t), at combined fractional rate k4 (t−1). The second term similarly represents the influx of peripheral plasma T3 (i.e., T3p) into brain, at effective fractional rate k3 (t−1). In the third term, kdegT3B is the fractional rate of degradation of T3B(t).
TSH D&E submodel
A simple one-compartment model adequately describes TSH D&E, with a PCR of 46.1 mL/min (half-life of 55 minutes) and a distribution volume of 3.5 L (3–5).
TH D&E submodel update
Primary components of our earlier simulation model (1) included submodels for T3 and T4 secretion (which remain the same in the new model) and for TH D&E, illustrated together in Figure 3. The D&E submodel included TH D&E (metabolism and excretion) in and from plasma, fast and slow tissue pools—including nonlinear T4 to T3 conversion and plasma protein binding processes, all as detailed in the equations and compartmental relationships in Figure 3. In the TH D&E submodel, we used in vitro–derived Km values (6) for the deiodinase reactions, because physiological Km values are unknown. We revisit this submodel here, to explore effects of alternative Km values reported as being more physiological (6–8), for T4 deiodination by type I deiodinase (D1). We also check our assumptions about T4 deiodination by type II deiodinase (D2).
FIG. 3.

Nonlinear thyroid hormone distribution and elimination submodel for triiodothyronine (T3) and thyroxine (T4) secretion, binding, distribution, interconversion, and elimination in the human. Protein binding submodels are given by  [see Ref. (1) for details]. TBG, T4-binding globulin; HSA, human serum albumin; TTR, transthyretin.
For practical reasons, Km values are estimated from in vitro enzymatic studies, most often performed with dithiothreitol (DTT) as cofactor for the reaction, at concentrations (∼ 20 mM) in excess of what is likely to exist in vivo for the equivalent and unknown in vivo cofactor (7). In vitro–derived Km values for D1 with T4 have been reported in the 2 μM range (6), based on use of ∼20 mM DTT. DTT does work in assays with reverse T3 (rT3) as substrate for D1 at much lower concentrations (0.5 mM) but not with T4 (7). In contrast, Goswami and Rosenberg (8) used 5 mM glutathione, believed to be a much more physiological cofactor, and estimated the Km for D1 with T4 to be 100 times smaller, that is, KmD1(T4) ≈ 20 nM. This is the same fold difference found by Sharifi and St. Germain (7) in comparing Km estimates for D1 with rT3 at 20 mM versus no added cofactor, suggesting that KmD1(T4) ≈ 20 nM, rather than 2 mM, is a better estimate for physiological applications.
In the present work, we updated the value of Km for D1 with T4, now 20 nM instead of 1.9 μM, based on the above arguments. To check our earlier results with the updated Km value, we optimally reestimated all TH SR and D&E submodel parameters, using the same kinetic database as before, but with KmD1(T4) ≈ 20 nM, and reevaluated our predictive results based on this updated model. Results are given below.
Unfortunately, D2 (and D3) only works in vitro with DTT, and there are no data using glutathione as cofactor for the other deiodinases. Although we have no better estimate at this time for the D2 Km with T4 as substrate [i.e., 1.5 nM (9)], we did test the sensitivity of our earlier results to this Km estimate, by optimally refitting the model to ±10-fold and ±100-fold changes in Km values used for D2 with T4. Results are given below.
Data and model quantification
Primary data
Our primary closed-loop database consists of 33 sets of PK data, collected simultaneously for hTSHp(t), T3p(t), and T4p(t), over 120 hours in euthyroid volunteers (half male, half female), beginning with baseline levels the day prior to dosing (day −1), in response to three different oral doses of L-T4, 400, 450, and 600 μg, on day 0 (10). Subjects were fasted from 10 pm on day 2 to noon on day −1 and also from 10 pm on day −1 to noon on day 0, putting them in the fasting state until 4 hours after dosing. The data shown averaged in Figures 4 and 5 were generously supplied by the authors (10).
FIG. 4.

Updated thyroid submodel fitted to pharmacokinetic data (n = 33) (10). Model simulations are shown as solid line and data as squares; thyroxine (T4) on the left, triiodothyronine (T3) on the right.
FIG. 5.

Optimized brain submodel thyroid-stimulating hormone (TSH(t)) responses fitted simultaneously to data (n = 33) from three pharmacokinetic studies using 400, 450, and 600 μg levothyroxine (L-T4) dosing (10). These data also illustrate the nonlinear properties of the TSH-saturating response characteristics, fitted well by the model.
Brain submodel quantification
Previously, we used the three plasma TSH data sets (circles in Fig. 5) as input forcing functions and quantified the thyroid and TH D&E submodel from T3 and T4 plasma data (Fig. 6, top left) (1). For the new brain submodel, we reversed the roles of the data sets, using T3 and T4 plasma discrete-time data (shown as squares in Fig. 4) as input forcing functions, rendered continuous time using linear splines (11), and optimally fitted the new brain submodel to plasma TSH output data (Fig. 6, bottom left). Extensive numerical analysesb of the brain submodel revealed that all parameters but two are uniquely quantifiable (identifiable) from the data; k3 and k4 are not separately quantifiable from our input–output data, which motivated a search for model simplification. Silva and coworkers reported roughly half of TH effect on TSH secretion in steady state due to plasma-derived T3, the remainder to plasma-derived T4 to T3 conversion in rat pituitary (13–18), and other data suggest a similar relationship in humans (19–23), together implying k3 ≈ k4 in Eq. 2. We fitted the unknown brain submodel parameters (B0, A0, φphase, k4, k3, and kdegT3B in Eqs. 1 and 2) to the TSH plasma data for all three doses simultaneously. We initiated the search with k3 = k4 and tested values of k3 ranging ±30% above and below k4. We used the program SAAM II (11) for parameter optimization, as before (1).
FIG. 6.

Brain (bottom left) and thyroid (top left) submodels combined to make the complete feedback control system (FBCS) model (right). Triiodothyronine (T3), thyroxine (T4), and thyroid-stimulating hormone (TSH) data used as input forcing functions, with the submodels encompassed and replaced by the input forcing function boxed in gray. The complete FBCS model on the right also includes submodels for subcutaneous (SC), intramuscular (IM), and intravenous (IV) exogenous inputs, used in our clinical applications.
Complete FBCS H-P-T axis model
We incorporated the new quantified brain submodels and updated and requantified TH SR and D&E submodels into an overall FBCS simulation model, thereby forming the complete, updated closed-loop FBCS simulation model illustrated in Figure 6. To check whether the combined submodels behave as well in concert as they do individually, we simulated responses of the complete FBCS model to 400, 450, and 600 μg doses of simulated oral L-T4 and compared these predictions to the simulations by each submodel individually, as well as to the real PK data (10).
Model validation
We further tested the new FBCS model against a variety of clinical data sets (20,24,25) not used in its development. These included
Normal and abnormal steady-state hormone levels: We simulated steady-state plasma T3pSS,T4pSS, and TSHpSS concentrations in normal healthy subjects, and in thyroid-ectomized patients treated with L-T4, and compared the corresponding simulated hormone concentrations to real clinical data (10,20).
Normal circadian TSH data: We simulated normal (unperturbed) steady-state plasma T3p(t), T4p(t), and TSHp(t) responses over 24 hours and compared these to corresponding data collected from normal subjects (24).
Predicting the TSH response to oral T3 dosing: Validation of FBCS responses to oral T3 required an additional gut absorption submodel, to represent pathway dynamics from an exogenous oral T3 input into the T3 plasma pool shown in Figure 3. We adapted a T3 absorption model (1,26) to compute the T3 absorption and dissolution rates, assumed unknown, by fitting this submodel to time-course plasma T3 data taken in normal subjects after 75 μg oral T3 (25). Using the complete FBCS model augmented with the T3 absorption submodel, we then compared simulated TSHp(t) responses to simulated 75 μg oral T3 and compared these results predictively to real TSH PK data (25) after the same dose. We emphasize here that the TSH PK data were not used for quantifying the T3 absorption rate, but only for predictive validation purposes.
Methods II: Clinical Applications of the Simulator
Combined T3/T4 treatment—updated
We expanded the simulation study done earlier with the simpler TH submodel alone (1), now using the updated and complete FBCS H-P-T axis model. We recomputed the L-T4–only doses needed to normalize (a) plasma T3, (b) lumped-tissue T3 levels (from Fig. 3), and (c) a combined T3 and T4 regimen that approximately normalizes both plasma and lumped-tissue T3 levels. With the updated and more complete model, we were able to simulate plasma TSH(t) responses as well as update our earlier plasma T3 and T4 predictions.
Parenteral T4 administration
Following the lead of Hays (27), we simulated subcutaneous (SC) and intramuscular (IM) administration of L-T4, using simple one-compartment models with an absorption half-life of 20.4 hours for SC administration, and an IM absorption rate twice that of SC (27,28)—rate constants kSC = ln 2/20.4 = 0.034h−1 and kIM = 0.068 h−1; see Figure 6. We computed the simulated L-T4 dose needed to normalize lumped-tissue T3 levels, when administered once or twice weekly, and either subcutaneously or intramuscularly. We also simulated plasma T3,T4, and TSH responses to each of these four regimens.
Central hypothyroidism
We simulated secondary hypothyroidism by first decreasing the magnitude of the sinusoid (A0) in the TSH secretion rate equation (Eq. 1) to 25% of normal, thereby decreasing the nighttime TSH surge, as is often seen in central hypothyroidism (29). Additionally, we decreased the overall TSH secretion rate (SRTSH) to 50%, 25%, 10%, 1%, and 0.1% of normal to simulate varying levels of secondary hypothyroidism.
Results
Brain submodel quantification
Numerical testing of the brain submodel parameters k3 ≈ k4 constraint for Eq. 2 yielded very similar fits and parameter estimates for values of k3 30% above and below k4 (or vice versa), so k3 = k4 in further simulations presented here. Figure 5 shows optimized plasma TSH(t) outputs for the new brain submodel, compared with TSH PK data. These were optimized by simultaneous fitting of data from experiments done with all three L-T4 doses, to capture the nonlinearities, using T3 and T4 input forcing functions. Optimized parameter estimates and statistics for the brain submodel are given in Table 1.
Table 1.
Parameter Nomenclature, Units, Values, Estimates, Variabilities (%CV), and Sources
| Parameter | Estimate | Units | %CV | Submodel | Source |
|---|---|---|---|---|---|
| kdegT3B | 0.037 | h−1 | 12.6 | TSH SR | Fitted to Blakesley et al. (10) data |
| Φphase | −3.71 | h−1 | 1.04 | TSH SR | Fitted to Blakesley et al. (10) data |
| A0 | 581 | μmol/h | 61.4 | TSH SR | Fitted to Blakesley et al. (10) data |
| B0 | 1166 | μmol/h | 60.7 | TSH SR | Fitted to Blakesley et al. (10) data |
| k3 = k4 | 0.118 | μmol/h | 6.43 | TSH SR | Fitted to Blakesley et al. (10) data |
| kdegTSH | 0.756 | h−1 | — | TSH D&E | Ridgway et al. (5), Odell et al. (4), Kuku et al. (3) |
| VdTSH | 3.5 | L | — | TSH D&E | Ridgway et al. (5), Odell et al. (4), Kuku et al. (3) |
| Vp | 3 | L | — | TH D&E | |
| KmD1fast | 0.03 | μmol | — | TH D&E | Updated by [Sharifi and St. Germain (7), Goswami and Rosenberg (8)] |
| KmD1slow | 1.0 | μmol | — | TH D&E | Updated by [Sharifi and St. Germain (7), Goswami and Rosenberg (8)] |
| KmD2slow | 0.075 | μmol | — | TH D&E | Bianco et al. (9) |
| VmaxD1fast | 3.85×10⁻⁴ | h−1 | 30.6 | TH D&E | Refitted to Blakesley et al. (10) data |
| VmaxD1slow | 6.63×10⁻⁴ | h−1 | 6.27 | TH D&E | Refitted to Blakesley et al. (10) data |
| VmaxD2slow | 0.00109 | h−1 | 6.27 | TH D&E | Refitted to Blakesley et al. (10) data |
| S3 | 3.71 ×10⁻⁴ | μmol−1 | 6.49 | TH SR | Refitted to Blakesley et al. (10) data |
| S4 | 0.00168 | μmol−1 | 7.4 | TH SR | Refitted to Blakesley et al. (10) data |
| gut1 | 1.3 | h−1 | — | T4 GUT | DiStefano and Mak (26) |
| gut2 | 0.119 | h−1 | 16.3 | T4 GUT | DiStefano and Mak (26) refitted to Blakesley et al. (10) data |
| gut3 | 0.881 | h−1 | 2.2 | T4 GUT | DiStefano and Mak (26) refitted to Blakesley et al. (10) data |
| kT3absorp | 0.882 | h−1 | 7.2 | T3 GUT | Fitted to Ueda et al. (25) data |
| kT3deg | 0.118 | h−1 | 7.2 | T3 GUT | Fitted to Ueda et al. (25) data |
| kT3dissol | 1.78 | h−1 | 32.0 | T3 GUT | Fitted to Ueda et al. (25) data |
| kSC | 0.034 | h−1 | — | SC INPUT | Hays (27) |
| kIM | 0.068 | h−1 | — | IM INPUT | Hays (27) |
Only the new brain submodel and updated TH D&E submodel parameters are shown here; the remaining 22 are in Table 1 of Ref. (1).
TSH, thyroid-stimulating hormone; SR, secretion; D&E, distribution and elimination; TH, thyroid hormone; T4, thyroxine; T3, triiodothyronine; SC, subcutaneous; IM, intramuscular, 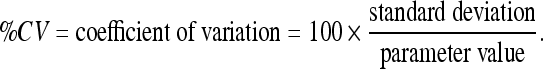 .
.
Thyroid submodels—effects of deiodinase Km values on model precision and predictive value
KmD1 update
Optimum parameter estimates of the original and updated models are compared in Table 2. The estimated D1 Vmax values in both fast and slow tissue pools fell roughly 100-fold, paralleling the change in KmD1 to 20 nM. The time-delay estimate τ for the thyroidal secretion responses to TSH stimulation that yielded the best fit to the data (Fig. 4) was centered at 8 hours, compared with 6 hours previously. A 6- to 8-hour range gave nearly identical results in both models, a range supported by several studies (30–33), as well as our own data in Figures 4 and 5.
Table 2.
Comparison of Optimum Parameter Estimates for Our Original Thyroid Submodels (1) with Optimum Estimates Using the Updated D1 KM 20 nM
| |
Original thyroid submodels |
Updated thyroid submodels |
|
||
|---|---|---|---|---|---|
| Parameter | Estimate | %CV | Estimate | %CV | % Change from orig. estimatea |
| τ | 6 h | 8 h | +33 | ||
| D1 Km | 1.9 μM | — | 20 nM | — | −98.9 |
| D2 Km | 1.5 nM | — | 1.5 nM | — | 0.00 |
| D1 Vmax fast pool | 0.00999 h−1 | 10.44 | 0.000385 h−1 | 30.6 | −96.1 |
| D1 Vmax slow pool | 0.0279 h−1 | 7.87 | 0.000663 h−1 | 6.27 | −97.6 |
| D2 Vmax slow pool | 0.000746 h−1 | 7.87 | 0.00109 h−1 | 6.27 | +46.1 |
| S3 | 0.000336 h−1 | 4.33 | 0.000371 h−1 | 6.49 | +10.4 |
| S4 | 0.00174 h−1 | 7.21 | 0.00168 h−1 | 7.4 | −3.45 |
| T4 absorption rate | 0.882 h−1 | 2.23 | 0.881 h−1 | 2.2 | 0.00 |
%Change = 100 × (new estimate–old estimate)/old estimate.
D2 with T4 estimate of Vmax in the slow pool increased 46%. The TH secretion “gain” parameters changed 3–10%, and the remaining parameter estimates were unchanged. The quality of the model fitted to the data was essentially unchanged with the updated submodel included, as established from program optimization criteria, which were essentially the same for both models,c and illustrated in Figure 4. Reevaluation of earlier model predictions indicated no changes to our previous bioequivalence and replacement hormone results (1).
KmD2 sensitivities
Newly optimized TH D&E and SR submodel parameter estimates for ±10-fold and ±100-fold changes in Km values used for D2 with T4 are given in Table 3. Small differences in several optimum parameter estimates are noted, but these had negligible effects on the weighted residual sum of squares (Table 3)and primary model predictions. For this reason, we retain the original KmD2(T4) in the new model.
Table 3.
Sensitivities of Optimal Model Parameter Estimates for the Thyroid and TH D&E Submodels to ±10% and ±100% Variations in D2 km (T4)
| |
D2 Km+100% |
D2 Km+10% |
Original D2 Km est. |
D2 Km−10% |
D2 Km−100% |
|||||
|---|---|---|---|---|---|---|---|---|---|---|
| Parameter | Estimate | %CV | Estimate | %CV | Estimate | %CV | Estimate | %CV | Estimate | %CV |
| τ | 8 h | 8 h | 8 h | 8 h | 8 h | |||||
| D1 Km | 20 nM | — | 20 nM | — | 20 nM | — | 20 nM | — | 20 nM | — |
| D2 Km | 15 nM | — | 15 nM | — | 1.5 nM | — | 15 nM | — | 15 nM | — |
| D1 Vmax fast pool | 0.000241 h−1 | 59.3 | 0.000264 h−1 | 49.3 | 0.000385 h−1 | 30.6 | 0.000419 h−1 | 27.6 | 0.000423 h−1 | 27.3 |
| D1 Vmax slow pool | 0.000582 h−1 | 7.20 | 0.000636 h−1 | 6.55 | 0.000663 h−1 | 6.27 | 0.000666 h−1 | 6.25 | 0.000666 h−1 | 6.25 |
| D2 Vmax slow pool | 0.0121 h−1 | 7.20 | 0.00214 h−1 | 6.55 | 0.00109 h−1 | 6.27 | 0.000974 h−1 | 6.25 | 0.000963 h−1 | 6.25 |
| S3 | 0.000452 h−1 | 7.07 | 0.000422 h−1 | 6.58 | 0.000371 h−1 | 6.49 | 0.000359 h−1 | 6.53 | 0.000357 h−1 | 6.53 |
| S4 | 0.00160 h−1 | 7.90 | 0.00162 h−1 | 7.71 | 0.00168 h−1 | 7.4 | 0.00169 h−1 | 7.33 | 0.00169 h−1 | 7.32 |
| T4 absorption rate | 0.880 h−1 | 2.20 | 0.880 h−1 | 2.20 | 0.881 h−1 | 2.2 | 0.881 h−1 | 2.20 | 0.881 h−1 | 2.20 |
| Total objective | −3.72 | −3.78 | −3.81 | −3.81 | −3.81 | |||||
T4, thyroxine.
Complete FBCS H-P-T axis model
Aggregation of submodels
Simulation of plasma T3p(t), T4p(t), and TSHp(t) responses to 400, 450, and 600 μg L-T4 dosing using the complete FBCS model was essentially indistinguishable from optimized simulation responses to the same inputs by individual submodels shown in Figures 4 and 5. All model equations and parameter values are given together in the Appendix.
Model validation
Steady-state hormone level predictions: Comparisons of simulated steady-state hormone levels for normal subjects and treated thyroidectomized patients versus real steady-state hormone data are shown in Figure 7. Simulated results were nearly identical to measured steady-state hormone concentrations in patients from our primary database and matched clinical range data very well, both as shown in Figure 7.
Predicting normal circadian TSH data: Predicted normal TSH circadian rhythms matched measured data (24) well, as shown in Figure 8.
Predicting TSH response to T3 dosing: Resulting T3 absorption was 88% and dissolution 1.78 h−1 when fitted to T3 plasma data (Fig. 9A). Gut parameter estimation results are given in Table 1. The predicted TSHp(t) response to oral T3 closely matched measured plasma TSH data, as shown in Figure 9B.
FIG. 7.

Feedback control system model validation study results. Predicted steady-state concentrations of thyroid-stimulating hormone (TSH), triiodothyronine (T3), and thyroxine (T4) in normal euthyroids and thyroidectomized patients treated with 150 μg levothyroxine (L-T4) (circles) versus steady-state hormone data (triangles) (10) and typical clinical ranges (bars) (20).
FIG. 8.

Feedback control system (FBCS) model validation study results. Predicted normal circadian thyroid-stimulating hormone (TSH) versus independent TSH data (not used in fitting the FBCS model) from three individuals [triangles and diamonds from (24), circles from (42)]. Also shown (squares) are the mean TSH data from the larger database used to fit the FBCS model (10).
FIG. 9.

(A) Fit of additional triiodothyronine (T3) absorption model to T3 data (n = 28) taken after 75 μg oral T3 (25). T3 absorption was fit to 88%. (B) Feedback control system model validation study results. Predicted thyroid-stimulating hormone (TSH) concentrations in normal subjects after 75 μg oral T3, compared with TSH data from (25), following same input.
Simulator clinical applications
Updated combined T3/T4 treatment
The simulated L-T4–only dose needed to normalize plasma T3 to prethyroidectomy levels was 165 μg L-T4/day, the L-T4–only dose needed to normalize lumped-tissue T3 levels was 145 μg L-T4/day, and the combined L-T4 + T3 dose needed to normalize both plasma and lumped-tissue T3 levels (as well as plasma T4 levels) was 105 μg L-T4 + 9 μgT3 per day. In all three regimens, average steady-state–simulated plasma T3, T4, and TSH were all within their normal ranges (T4: 5–12 μg/dL; T3: 0.8–1.9 ng/mL; and TSH: 0.5–5 mU/L).
Parenteral T4 administration
Lumped-tissue T3 levels were roughly normalized using simulated dosings of 800 μg L-T4 weekly and 400 μg twice weekly, for both the SC and IM routes, similar to the 750 and 375 μg reported by Hays (27). In all four regimens (once vs. twice weekly, SC vs. IM), plasma T3, T4, and mean TSH were maintained within their normal ranges (T4: 5–12 μg/dL; T3: 0.8–1.9 ng/mL; and TSH: 0.5–5mU/L). Once weekly, IM administration of L-T4 showed the largest fluctuation in plasma TSH levels, with nighttime peaks as high as 8 mU/L near the end of the week; twice weekly, SC administration by contrast showed the smallest fluctuation in TSH plasma levels, which stayed within 1.5–4.5 mU/L.
Central hypothyroidism
Results for TSH secretion suppression ranging from 0.1% to 50% of normal are given in Figure 10. Steady-state plasma TSH levels stayed (barely) within the normal range throughout the simulations, though plasma T4 dropped below the normal range as TSH secretion was reduced below 25%, and plasma T3 dropped below the normal range below 1% TSH secretion. As expected, time-course plasma TSH dropped rapidly after reducing TSH secretion, due to its relatively short half-life in blood. This was followed by a slow return of TSH toward normal, due to relatively slower TH negative feedback response dynamics, all as shown in the inset in Figure 10.
FIG. 10.

Effects of central hypothyroidism on steady-state thyroid-stimulating hormone (TSH), thyroxine (T4), and triiodothyronine (T3). Hormone levels versus TSH secretion at 100%, 50%, 25%, 10%, 1%, and 0.1% of normal. Inset (top): Predicted time-course of plasma TSH response to reducing TSH secretion to 1% of normal at t = 0. Grey shading indicates normal range for each hormone.
Discussion
New simulator development and validation
We built this model on the framework established by Eisenberg et al. (1), the major update being explicit representation and quantification of the brain submodels not included earlier. The new simulator incorporates circadian and basal TSH secretion, as well as nonlinear T3 and T4 regulation of TSH secretion and—for the first time—it has been fully quantified from a substantial quantity of clinical data, over a wide range of physiological and pathophysiological conditions. Earlier FBCS models of thyroid hormone regulation were similarly structured [e.g., Refs. (34–39)], but severely encumbered by lack of quantitative data for model building or verification.
We quantified the brain submodels using physiological and PK data and combined these new submodels with our updated TH submodels, thereby providing a quantified simulation model of the complete closed-loop system. The nonlinear TH D&E submodel was updated with a more physiological deiodinase Km value (7), which did not affect the fit of the model to the data, but did alter the relative amounts of T4 converted to T3 in slow versus fast tissues. The extended simulation model, with TSH(t) now included as a response variable, is capable of exploring many more physiological and clinical conditions; it no longer requires specific, case-by-case experimental TSH data.
We did not include ultradian TSH oscillations in our model because apparent smoothing characteristics of downstream thyroid gland and D&E components likely damp out any effects of these oscillations on feedback regulation. Further, as ultradian rhythms are not in phase between individuals, our model—which is based on the dynamics of a subject population average—further smoothes these smaller variations.
We validated the new FBCS model by independent comparisons with data not used in its development. Simulated steady-state plasma T3, T4, and TSH concentrations in euthyroids and treated thyroidectomized patients were well within normal ranges and also closely matched normal steady-state data from actual subjects (10). In treated thyroidectomized (open-loop) patients, steady-state T3 and T4 predictions were nearly identical to our previous simulation results (1). Normal daily TSHp(t) circadian variation simulations also closely matched independent plasma TSH data taken from normal human subjects (24) (Fig. 8); and simulated normal daily T3 and T4 showed circadian variation of smaller magnitude, consistent with clinical data for human subjects (20,40).
We also validated the complete FBCS model against independent TSH response data following an oral T3 challenge (25). T3 dissolution and absorption into plasma from gut was modeled using a two-compartment gut T3 submodel and quantified from T3 plasma appearance data after 75 μg oral T3 (25). This test was important because, while effects of T3 on TSH secretion are explicit in the brain submodel, the overall FBCS model was optimized only to T4 response data, not T3. Simulated plasma TSHp(t) response to an oral 75 μgT3 dose matched real TSH data quite closely (Fig. 9), providing independent validation for the previously untested T3 regulatory pathway of the model.
Simulator applications
Combined T3/T4 treatment—updated
In simulated thyroidectomized subjects, we found 165 μg L-T4/day normalized plasma T3, 145 μg L-T4/day normalized lumped-tissue T3, and 105 μg L-T4 + 9 μg T3 per day normalized both plasma and lumped-tissue T3 levels, as well as plasma T4 levels. All three regimens are quite close to our earlier simulation predictions (1) of 162 μg L-T4/day, 141 μg L-T4/day, and 103 μg L-T4/day + 6 μg T3/day, respectively. And all three regimens maintained plasma TSH, T3, and T4 within normal ranges. Previously, we had compared combined L-T4 + T3 therapy versus L-T4–only therapy, by simulating T3 levels only in tissue and plasma, without the benefit of a closed feedback loop (1). We had no explicit model of the H-P brain components, so we could not simulate corresponding plasma TSH levels.
Interestingly, the daily TSH circadian range—from nighttime peak to daytime nadir—was somewhat higher (2.3–5.0 mU/L) with combined T3/T4 treatment versus 0.5–1.3 and 1.1–2.7 mU/L for the two L-T4–only regimens. The combined treatment circadian range more closely matches our simulations and clinical data for euthyroid normal subjects (∼2–6mU/L; see Figs. 8 and 5), but all three regimens maintained TSH levels within the normal range. This effect is likely due to high-normal T4 levels, observed both in our simulations and in patients undergoing L-T4–only therapy (20), providing additional TSH suppression. These results may serve to explain clinical observations that euthyroid patients on L-T4–only therapy were subjectively more content when their TSH was low-normal (41)—the simulated T4-only regimen that normalizes tissue T3 levels yields a lower average TSH concentration than our normal subject simulations and data.
Parenteral T4 administration
We confirmed and expanded on Hays' recent analysis of these alternate drug administration routes (27). Simulated 800 μg L-T4 weekly and 400 μg L-T4 twice weekly (by SC or IM routes) normalized lumped-tissue T3 levels, only slightly higher than Hays' results (750 μg L-T4 once and 375 μg L-T4 twice weekly). Whereas Hays used only T4 subsystem kinetics, we were able to simulate TSH and T3 as well, finding that daily average plasma TSH as well as T3 and T4 remained within normal ranges for all four dosing scenarios. These simulations provide further evidence that L-T4 can be administered parenterally once or twice weekly in patients with diminished L-T4 gut absorption, maintaining TSH and TH levels in blood and tissues within normal ranges.
Central hypothyroidism
Steady-state hormone concentrations in response to various degrees of central hypothyroidism (Fig. 10) were withinnormal ranges for TSH secretion down to 25% of normal. Simulated TSH levels showed an initial drop to nearly zero (see Fig. 10) immediately after reducing TSH secretion, before returning toward normal, illustrating the powerful feedback effects at work, even when TSH secretion is greatly diminished.
IN SUMMARY, we have demonstrated that the new simulator captures the essential features of H-P-T axis dynamics over a fairly wide range of linear and nonlinear operation, both physiological and pathophysiological. Independent validation against data not used in model development suggests that it is capable of accurate predictions and it is thus potentially useful for exploring other unanswered questions about TH regulation in health and disease.
Appendix
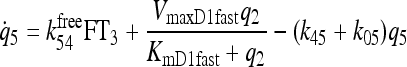
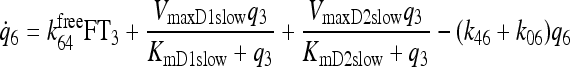
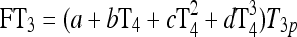
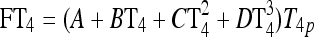
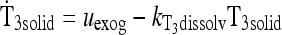
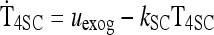
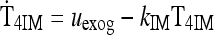
| Brain submodel equations (see Methods section) | |
 |
Eq. 1 |
 |
See TSH D&E submodel in Methods |
 |
Eq. 2 |
| Thyroid submodel equations [see Fig. 3 and Ref. (1)] | |
 |
See Fig. 3 and Eq. 6 in Ref (1) |
 |
See >Fig. 3 and Ref. (1) |
 |
See Fig. 3 and Ref. (1) |
 |
See Fig. 3 and Ref. (1) |
 |
See Fig. 3 and Ref. (1) |
 |
See Fig. 3 and Ref. (1) |
 |
See Fig. 3 and Ref. (1) |
 |
See Fig. 3 and Eq. 4 in Ref. (1) |
 |
See Fig. 3 and Eq. 5 in Ref. (1) |
| Gut and SC/IM input submodels [see Methods and Ref. (1)] | |
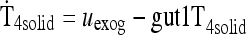 |
See Methods and Ref. (1) |
 |
See Methods and Ref. (1) |
 |
See Methods |
 |
See Methods |
 |
See Methods |
 |
See Methods |
Original TH Submodel Parameter Values [Details Given in Table 1 of Ref. (1)]
A = 0.000289; B = 0.000214 μmol−1; C = 0.000128 μmol−2; D = −8.83×10⁻⁶ μmol−3;
a = 0.00395; b = 0.00185 μmol−1; c = 0.000610 μmol−2; d = 0.000505 μmol−3;
k02 = 0.0189h−1; k05 = 0.207h−1; k12 = 0.868h−1; k13 = 0.108h−1; k45 = 5.37h−1;
k46 = 0.0689h−1; k21free = 1503h−1; k31free = 584h−1; k54free = 2043h−1; k64free = 127h−1;
k21 = 0.544h−1; k31 = 0.211 h−1; k54 = 9.24h−1; k64 = 0.573h−1
Footnotes
We ignore ultradian, 1–2 hours pulsatile TSH oscillations, assuming their small magnitude does not significantly affect downstream TH signals in our model. Additionally, ultradian, unlike circadian rhythms, are not in phase from individual to individual. Our primary database consists of hormone dynamics for the population average. Individual ultradian rhythms are “smoothed out,” with only circadian rhythms prominent in mean data.
An established numerical identifiability analysis approach (12) was used to explore the brain submodel parameter space for feasible solutions with finite parameter estimation variances. A range of physiologically reasonable values for the k's were tested by generating perfect simulated data for each trial and reestimating the parameters and their variances. Infinite (or very large) variances indicate unidentifiability.
Two model comparison measures were used: the Akaike Information Criterion (AIC: −0.83 vs. −0.89) and the optimization criterion function (−3.6 vs. −3.7), for the updated and original submodels, both reported in SAAM II optimization results (11).
Acknowledgments
This project was supported in part by a Howard Hughes Medical Institute grant through the Undergraduate Biological Sciences Education Program to UCLA, the UCLA Graduate Research Mentorship Fellowship, and the National Institutes of Health National Research Service Award (T32-GM008185) from the National Institute of General Medical Sciences (NIGMS).
Disclosure Statement
No competing financial interests exist.
References
- 1.Eisenberg M. Samuels M. DiStefano JJ., 3rd L-T4 bioequivalence and hormone replacement studies via feedback control simulations. Thyroid. 2006;16:1279–1292. doi: 10.1089/thy.2006.0144. [DOI] [PubMed] [Google Scholar]
- 2.Samuels MH. Henry P. Luther M. Ridgway EC. Pulsatile TSH secretion during 48-hour continuous TRH infusions. Thyroid. 1993;3:201–206. doi: 10.1089/thy.1993.3.201. [DOI] [PubMed] [Google Scholar]
- 3.Kuku SF. Harsoulis P. Kjeld M. Fraser TR. Human thyrotropic hormone kinetics and effects in euthyroid males. Horm Metab Res. 1975;7:54–59. [Google Scholar]
- 4.Odell WD. Utiger RD. Wilber JF. Condliffe PG. Estimation of the secretion rate of thyrotropin in man. J Clin Invest. 1967;46:953–959. doi: 10.1172/JCI105601. [DOI] [PMC free article] [PubMed] [Google Scholar]
- 5.Ridgway EC. Weintraub BD. Maloof F. Metabolic clearance and production rates of human thyrotropin. J Clin Invest. 1974;53:895–903. doi: 10.1172/JCI107630. [DOI] [PMC free article] [PubMed] [Google Scholar]
- 6.Visser TJ. Kaptein E. Terpstra OT. Krenning EP. Deiodination of thyroid hormone by human liver. J Clin Endocrinol Metab. 1988;67:17–24. doi: 10.1210/jcem-67-1-17. [DOI] [PubMed] [Google Scholar]
- 7.Sharifi J., St. Germain DL. The cDNA for the type I iodothyronine 5′-deiodinase encodes an enzyme manifesting both high Km and low Km activity. Evidence that rat liver and kidney contain a single enzyme which converts thyroxine to 3,5,3′-triiodothyronine. J Biol Chem. 1992;267:12539–12544. [PubMed] [Google Scholar]
- 8.Goswami A. Rosenberg IN. Effects of glutathione on iodothyronine 5′-deiodinase activity. Endocrinology. 1988;123:192–202. doi: 10.1210/endo-123-1-192. [DOI] [PubMed] [Google Scholar]
- 9.Bianco AC. Salvatore D. Gereben B. Berry MJ. Larsen PR. Biochemistry, cellular and molecular biology, and physiological roles of the iodothyronine selenodeiodinases. Endocr Rev. 2002;23:38–89. doi: 10.1210/edrv.23.1.0455. [DOI] [PubMed] [Google Scholar]
- 10.Blakesley VA. Awni W. Locke C. Ludden TM. Granneman GR. Braverman LE. Are bioequivalence studies of levothyroxine sodium formulations in euthyroid volunteers reliable? Thyroid. 2004;14:191–200. doi: 10.1089/105072504773297867. [DOI] [PubMed] [Google Scholar]
- 11.Barrett PH. Bell BM. Cobelli C. Golde H. Schumitzky A. Vicini P. Foster DM. SAAM II: simulation, analysis, and modeling software for tracer and pharmacokinetic studies. Metabolism. 1998;47:484–492. doi: 10.1016/s0026-0495(98)90064-6. [DOI] [PubMed] [Google Scholar]
- 12.Jaquez JA. Greif P. Numerical parameter identifiability, estimatability: integrating identifiability, estimatability, optimal sampling design. Math Biosci. 1985;77 [Google Scholar]
- 13.Larsen PR. Thyroid-pituitary interaction: feedback regulation of thyrotropin secretion by thyroid hormones. N Engl J Med. 1982;306:23–32. doi: 10.1056/NEJM198201073060107. [DOI] [PubMed] [Google Scholar]
- 14.Larsen PR. Bavli SZ. Castonguay M. Jove R. Direct radioimmunoassay of nuclear 3,5,3′ triiodothyronine in rat anterior pituitary. J Clin Invest. 1980;65:675–681. doi: 10.1172/JCI109713. [DOI] [PMC free article] [PubMed] [Google Scholar]
- 15.Silva JE. Larsen PR. Contributions of plasma triiodothyronine and local thyroxine monodeiodination to triiodothyronine to nuclear triiodothyronine receptor saturation in pituitary, liver, and kidney of hypothyroid rats. Further evidence relating saturation of pituitary nuclear triiodothyronine receptors and the acute inhibition of thyroid-stimulating hormone release. J Clin Invest. 1978;61:1247–1259. doi: 10.1172/JCI109041. [DOI] [PMC free article] [PubMed] [Google Scholar]
- 16.Larsen PR. Regulation of thyrotropin secretion by 3,5,3′-triiodothyronine and thyroxine. Prog Clin Biol Res. 1981;74:81–93. [PubMed] [Google Scholar]
- 17.Larsen PR. Silva JE. Kaplan MM. Relationships between circulating and intracellular thyroid hormones: physiological and clinical implications. Endocr Rev. 1981;2:87–102. doi: 10.1210/edrv-2-1-87. [DOI] [PubMed] [Google Scholar]
- 18.Silva JE. Larsen PR. Pituitary nuclear 3,5,3′-triiodothyronine and thyrotropin secretion: an explanation for the effect of thyroxine. Science. 1977;198:617–620. doi: 10.1126/science.199941. [DOI] [PubMed] [Google Scholar]
- 19.Bigos ST. Ridgway EC. Kourides IA. Maloof F. Spectrum of pituitary alterations with mild and severe thyroid impairment. J Clin Endocrinol Metab. 1978;46:317–325. doi: 10.1210/jcem-46-2-317. [DOI] [PubMed] [Google Scholar]
- 20.DeGroot LJ. Hennemann G. Thyroid disease manager: the thyroid, its diseases. 2002. http://www.thyroidmanager.org/thyroidbook.htm. [Sep;2004 ]. http://www.thyroidmanager.org/thyroidbook.htm
- 21.Patel YC. Burger HG. Serum triiodothyronine in health and disease. Clin Endocrinol (Oxf) 1973;2:339–349. doi: 10.1111/j.1365-2265.1973.tb01720.x. [DOI] [PubMed] [Google Scholar]
- 22.Patel YC. Pharoah PO. Hornabrook RW. Hetzel BS. Serum triiodothyronine, thyroxine and thyroid-stimulating hormone in endemic goiter: a comparison of goitrous and nongoitrous subjects in New Guinea. J Clin Endocrinol Metab. 1973;37:783–789. doi: 10.1210/jcem-37-5-783. [DOI] [PubMed] [Google Scholar]
- 23.Wennlund A. Variation in serum levels of T3, T4, FT4 and TSH during thyroxine replacement therapy. Acta Endocrinol (Copenh) 1986;113:47–49. doi: 10.1530/acta.0.1130047. [DOI] [PubMed] [Google Scholar]
- 24.Sarapura VD. Samuels MH. Ridgway EC. Thyroid-stimulating hormone. In: Melmed S, editor. The Pituitary. Second. Blackwell Science; Malden, MA: 2002. pp. 187–229. [Google Scholar]
- 25.Ueda S. Takamatsu J. Fukata S. Tanaka K. Shimizu N. Sakata S. Yamaji T. Kuma K. Ohsawa N. Differences in response of thyrotropin to 3,5,3′-triiodothyronine and 3,5,3′-triiodothyroacetic acid in patients with resistance to thyroid hormone. Thyroid. 1996;6:563–570. doi: 10.1089/thy.1996.6.563. [DOI] [PubMed] [Google Scholar]
- 26.DiStefano JJ., 3rd Mak PH. On model and data requirements for determining the bioavailability of oral therapeutic agents: application to gut absorption of thyroid hormones. Am J Physiol. 1979;236:R137–R141. doi: 10.1152/ajpregu.1979.236.3.R137. [DOI] [PubMed] [Google Scholar]
- 27.Hays MT. Parenteral thyroxine administration. Thyroid. 2007;17:127–129. doi: 10.1089/thy.2006.0283. [DOI] [PubMed] [Google Scholar]
- 28.Hays MT. McGuire RA. Distribution of subcutaneous thyroxine, triiodothyronine, and albumininman: comparison with intravenous administration using a kinetic model. J Clin Endocrinol Metab. 1980;51:1112–1117. doi: 10.1210/jcem-51-5-1112. [DOI] [PubMed] [Google Scholar]
- 29.Samuels MH. Lillehei K. Kleinschmidt-Demasters BK. Stears J. Ridgway EC. Patterns of pulsatile pituitary glycoprotein secretion in central hypothyroidism and hypogonadism. J Clin Endocrinol Metab. 1990;70:391–395. doi: 10.1210/jcem-70-2-391. [DOI] [PubMed] [Google Scholar]
- 30.Huysmans DA. Nieuwlaat WA. Erdtsieck RJ. Schellekens AP. Bus JW. Bravenboer B. Hermus AR. Administration of a single low dose of recombinant human thyrotropin significantly enhances thyroid radioiodide uptake in nontoxic nodular goiter. J Clin Endocrinol Metab. 2000;85 doi: 10.1210/jcem.85.10.6869. [DOI] [PubMed] [Google Scholar]
- 31.Nielsen VE. Bonnema SJ. Hegedus L. Effects of 0.9mg recombinant human thyrotropin on thyroid size and function in normal subjects: a randomized, double-blind, cross-over trial. J Clin Endocrinol Metab. 2004;89:2242–2247. doi: 10.1210/jc.2003-031783. [DOI] [PubMed] [Google Scholar]
- 32.Ramirez L. Braverman LE. White B. Emerson CH. Recombinant human thyrotropin is a potent stimulator of thyroid function in normal subjects. J Clin Endocrinol Metab. 1997;82:2836–2839. doi: 10.1210/jcem.82.9.4205. [DOI] [PubMed] [Google Scholar]
- 33.Torres MS. Ramirez L. Simkin PH. Braverman LE. Emerson CH. Effect of various doses of recombinant human thyrotropin on the thyroid radioactive iodine uptake and serum levels of thyroid hormones and thyroglobulin in normal subjects. J Clin Endocrinol Metab. 2001;86:1660–1664. doi: 10.1210/jcem.86.4.7405. [DOI] [PubMed] [Google Scholar]
- 34.Dietrich JW. Tesche A. Pickardt CR. Mitzdorf U. Fractal properties of the thyrotropic feedback control implications of a nonlinear model compared with empirical data. In: Trappl R, editor. Cybernetics and Systems. Austrian Society for Cybernetic Studies; Vienna: 2002. pp. 329–34. [Google Scholar]
- 35.Dietrich JW. Tesche A. Pickardt CR. Mitzdorf U. Thyrotropic feedback control: evidence for an additional ultrashort feedback loop from fractal analysis. Cybern Syst. 2004;35:315–331. [Google Scholar]
- 36.DiStefano JJ., 3rd Stear EB. Neuroendocrine control of thyroid secretion in living systems: a feedback control system model. Bull Math Biophys. 1968;30:3–26. doi: 10.1007/BF02476936. [DOI] [PubMed] [Google Scholar]
- 37.DiStefano JJ., 3rd Stear EB. On identification of hypothalamo-hypophysial control and feedback relationships with the thyroid gland. J Theor Biol. 1968;19:29–50. doi: 10.1016/0022-5193(68)90003-9. [DOI] [PubMed] [Google Scholar]
- 38.Li G. Liu B. Liu Y. A dynamical model of the pulsatile secretion of the hypothalamo-pituitary-thyroid axis. Biosystems. 1995;35:83–92. doi: 10.1016/0303-2647(94)01484-o. [DOI] [PubMed] [Google Scholar]
- 39.Liu YW. Liu BZ. Xie JL. Liu YX. A new mathematical-model of hypothalamo-pituitary-thyroid axis. Math Comput Model. 1994;19:81–90. [Google Scholar]
- 40.Fisher DA. Physiological variations in thyroid hormones: physiological and pathophysiological considerations. Clin Chem. 1996;42:135–139. [PubMed] [Google Scholar]
- 41.Green WL. New questions regarding bioequivalence of levothyroxine preparations: a clinician's response. AAPS J. 2005;7:E54–E58. doi: 10.1208/aapsj070107. [DOI] [PMC free article] [PubMed] [Google Scholar]
- 42.Samuels M. Luther M. Hentry P. Ridgway EC. Effects of hydrocortisone on pulsatile pituitary glycoprotein secretion. JCEM. 1994;76:211–215. doi: 10.1210/jcem.78.1.8288706. [DOI] [PubMed] [Google Scholar]