

Abstract
Purpose
To explore the prognostic value of metabolic tumor volume measured on post-radiation 18F-fluorodeoxyglucose positron emission tomography (PET) imaging in head-and-neck cancer patients.
Methods and Materials
Forty-seven head-and-neck cancer patients who received pre- and post-treatment PET/CT imaging along with definitive chemoradiotherapy were included in this study. PET/CT parameters evaluated include the maximum standardized uptake value, metabolic tumor volume (MTV2.0-MTV4.0; where MTV2.0 refers to the volume above an SUV threshold of 2.0), and integrated tumor volume. Kaplan-Meier and Cox-regression models were used to test for association between PET endpoints and disease-free survival (DFS) and overall survival (OS).
Results
Multiple post-radiation PET endpoints correlated significantly with outcome, however the most robust predictor of disease progression and death was MTV2.0. An increase in MTV2.0 of 21cm3 (difference between 75th and 25th percentile) was associated with an increased risk of disease progression (hazard ratio [HR]=2.5, p=0.0001) and death (HR=2.0, p=0.003). In patients with non-nasopharyngeal carcinoma (non-NPC) histology (n=34), MTV2.0<18cm3 and MTV2.0≥18cm3 yielded 2-year DFS rates of 100% and 63%, respectively (p=0.006) and 2-year OS rates of 100% and 81%, respectively (p=0.009). There was no correlation between MTV2.0 and DFS or OS with NPC histology (n=13). On multivariate analysis only post-radiation MTV2.0 was predictive of DFS (HR=2.47, p=0.0001) and OS (HR=1.98, p=0.003).
Conclusions
Post-radiation metabolic tumor volume is an adverse prognostic factor in head-and-neck cancer. Biomarkers such as MTV are important for risk stratification, and will be valuable in the future with risk-adapted therapies.
Keywords: Head-and-neck cancer, Positron emission tomography, metabolic tumor volume
INTRODUCTION
18F-fluorodeoxyglucose (FDG) positron emission tomography (PET) imaging combined with computed tomography (CT) plays an important role in staging and radiation treatment planning in patients with head and neck cancer (HNC) (1-3). Additionally, PET/CT in the pre- and post-radiotherapy setting has emerged as a potential prognostic factor for outcome in HNC (4, 5). When analyzing the prognostic capability of PET/CT, the most common PET endpoint analyzed is the maximum tumor FDG uptake measured by the maximum standardized uptake value (SUVmax). As an alternative to SUVmax, we have previously reported on a more functional PET/CT metric that measures the metabolic tumor burden (6). We found that pre-radiation metabolic tumor volume (MTV) predicted disease progression and survival in HNC, whereas SUVmax did not, suggesting that metabolic tumor burden may be a more robust predictor of outcome.
Ideally, SUVmax in the post-radiation setting would predict the presence of residual or recurrent disease, however factors such as inflammation and other post-radiation effects tend to obscure the predictive nature of SUVmax (7). Indeed, studies that evaluate SUVmax as a prognostic factor in the post-treatment setting have been mixed (8-14). A PET/CT endpoint that increases the distinction between residual tumor and treatment effects would enhance the prognostic capability of PET/CT. We hypothesize that an endpoint based on the volume of hypermetabolic tissue above a given SUV threshold would discriminate between tumor and treatment effect, and thus could improve the prognostic utility of post-radiation PET/CT. The purpose of this study was to 1) explore different metabolic volume based threshold techniques, and 2) to test for association between disease progression and overall survival.
METHODS
Patients and treatment
After Institutional Review Board approval, we retrospectively reviewed the medical records of all patients with squamous cell HNC who were treated with definitive chemoradiotherapy at Stanford University between February 2003 and October 2007. At our institution, for non-nasopharyngeal HNC, patient treatment response is typically assessed at six to eight weeks after the completion of chemoradiation with clinical exam, endoscopy and cross-sectional imaging studies (either CT or MRI). After this initial assessment, patients with obvious residual disease or tumor progression are considered for biopsy of the primary tumor site or fine needle aspiration (FNA) of a persistently enlarged node. If there is evidence of viable tumor, patients proceed to immediate salvage surgery. In contrast, patients with equivocal findings or no detectable disease are followed with a PET-CT at 10 weeks to 4 months after completion of chemoradiotherapy. For NPC patients, follow up PET-CT is obtained at one to two months after completion of adjuvant chemotherapy. Patients were included in this study if they had both a pre-treatment PET/CT as part of staging or radiation treatment planning, and had a post-treatment PET/CT for follow up within one year of the last day of radiation. Patients were excluded if they had metastatic disease at presentation, prior definitive surgery, or if the post-treatment PET/CT was done at an outside facility or done after histologic confirmation of disease progression. Patients with salivary gland, paranasal sinus, thyroid and skin primary tumors were also excluded. One-hundred and fifty-two patients with locally advanced HNC received PET/CT scans along with radiation during the above study period. Of these patients, 47 met the above criteria, and these patients formed the cohort of this study. Patient characteristics are provided in Table 1.
Table 1.
Patient characteristics
| Parameter | No. of patients (%) |
|---|---|
| Age | |
| Median (range) | 55.1 (15-86.1) |
| Gender | |
| Male | 39 (83) |
| Female | 8 (17) |
| Site | |
| Nasopharynx | 13 (28) |
| Oropharynx | 21 (45) |
| Oral cavity | 2 (4) |
| Larynx | 7 (15) |
| Hypopharynx | 4 (9) |
| AJCC stage | |
| II | 2 (4) |
| III | 11 (23) |
| IVA | 29 (62) |
| IVB | 5 (11) |
| Pathology grade | |
| Well differentiated | 2 (4) |
| Moderately differentiated | 15 (32) |
| Poorly differentiated | 24 (51) |
| Unknown | 6 (13) |
| Karnofsky performance status | |
| 70 | 2 (4) |
| 80 | 8 (17) |
| 90 | 36 (77) |
| 100 | 1 (2) |
Abbreviations: AJCC = American Joint Committee on Cancer
FDG-PET CT imaging
The imaging protocol prior to treatment has been reported previously (6), and will only briefly be described here. Prior to simulation, patients were positioned supine with arms by their sides. A custom molded foam cushion (AcuForm, Medtec, Orange City, IA), and a thermoplastic mask (Aquaplast, WFR/Aquaplast Corp., Wyckoff, NJ) were used to support and immobilize the patient’s head and neck. Prior to pre- and post-treatment scans, patients fasted for at least 8 hours prior to injection with 10 to 18 mCi of FDG. Image acquisition was done 45-60 minutes after FDG administration. CT imaging was collected in helical acquisition mode. Two-dimensional (2-D) PET imaging was obtained over 3-5 minutes of acquisition time per bed position. The 2-D PET data were reconstructed with an ordered set expectation maximization algorithm, using the CT images for attenuation correction. The complete PET/CT examination required approximately 90 minutes, including patient setup, radiotracer uptake, and CT and PET image acquisition.
Treatment
All patients were treated with definitive chemoradiotherapy, and most (89%) were treated with cisplatin or carboplatin based chemotherapy regimens. The majority of patients (89%) were treated with intensity modulated radiation therapy (IMRT), and the remainders were treated with 3-D conformal radiation therapy. Patients received radiation doses between 66-70 Gy, and 12 of the 13 nasopharyngeal cancer patients were treated with a sequential 7-8 Gy stereotactic radiosurgical boost. Table 2 contains additional treatment characteristics.
Table 2.
Treatment characteristics
| Parameter | No. of patients (%) |
|---|---|
| Radiation dose | |
| 66 Gy in 2.2 Gy fractions | 28 (60) |
| 70 Gy in 2 Gy fractions | 7 (15) |
| 66 Gy in 2.2 Gy fractions + SRS boost* | 12 (26) |
| Radiation type | |
| IMRT | 42 (89) |
| 3D-CRT | 5 (11) |
| Chemotherapy | |
| Cisplatin +/− 5-FU/capecitabine | 36 (77) |
| Carboplatin +/− 5-FU/capecitabine | 2 (4) |
| Cis/carbo + cetuximab | 1 (2) |
| Cis/carbo + paclitaxel | 3 (6) |
| Cis/carbo + paclitaxel + cetuximab | 1 (2) |
| Cetuximab only | 4 (9) |
Abbreviations: CRT = conformal radiation therapy; Gy = Gray; IMRT = intensity-modulated radiation therapy; SRS = stereotactic radiosurgery.
SRS boost ranged from 7-8 Gy.
PET/CT analysis
At the time of treatment, the primary tumor and nodal gross tumor volumes (GTV) were contoured on the treatment planning CT by the treating physician (Q.L., and B.L.), with the aid of the pre-treatment PET. With the pre- and post-treatment PET/CT scans, the metabolic volumes of interest were retrospectively outlined by an experienced radiation oncologist (J.M., T.L. and K.C.) with the aid of the treatment planning GTV and diagnostic nuclear medicine reports. The pre- and post-treatment metabolic tumor volume (MTVx) was defined as the volume of hypermetabolic tissue within the region of the GTV (as identified on the pretreatment PET/CT scan) with an SUV greater than a threshold value x. We previously defined the pre-treatment MTV threshold as 50% of the maximum SUV (MTV50%) (6). In the post-treatment setting, a relative threshold of 50% of the maximum SUV is often below the surrounding background SUV level, so therefore with post-treatment MTV we utilized an absolute SUV threshold. To identify the optimal absolute SUV threshold with post-treatment MTV, we explored multiple threshold levels with SUVs ranging from 2.0 to 4.0 in intervals of 0.5 (MTV2.0 – MTV4.0). In determining the MTV, care was taken to exclude normal hypermetabolic tissues such as brown fat, brain or salivary glands. Pre- and post-treatment MTV is demonstrated in Figure 1.
Figure 1.
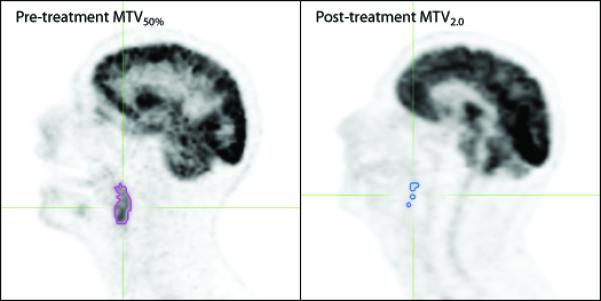
Metabolic tumor volume on pre- (left) and post-treatment (right) PET images. The purple outline circumscribes the pre-treatment MTV50% (metabolic tumor volume with relative threshold of 50% maximum SUV), and the blue outline circumscribes the post-treatment MTV2.0 (metabolic tumor volume with an absolute SUV threshold of 2.0).
The integrated tumor volume (ITVx) was defined as the following:
ITVx is also equal to MTVx multiplied by the average SUV. Analysis of PET/CT imaging for this project was done with the MIM® Software Suite along with the MIMfusion® and MIMcontouring® packages (MIMvista Corporation, Cleveland, OH).
Statistics
Disease free survival (DFS) and overall survival (OS) were calculated from the date of diagnosis. An event for DFS was defined as any disease progression (local, regional or distant) or death from any cause. Survival curves for DFS and OS were generated with the method of Kaplan and Meier (15). Cox proportional hazard models were used for both univariate and multivariate analysis (16). Prognostic factors evaluated included pre- and post-treatment MTV, ITV, SUVmax, as well as Karnofsky performance status (KPS) which we previously found to be associated with outcome (6). To enable a rough comparison of hazard ratios, the various SUV thresholds tested with MTV and ITV were individually normalized to their interquartile range (difference between 75th and 25th percentile), prior to analysis with a Cox proportional hazard model. Pearson correlation coefficients were used to test for association between continuous prognostic factors. We used a Bonferroni correction to adjust for multiple comparisons. Statistical analysis was performed with SPSS version 17.0 (SPSS Inc, Chicago, IL).
RESULTS
Patient outcome
The median follow-up for the entire cohort was 34 months (range 12 – 68 months). Of the 47 patients in this study, three patients ultimately developed isolated distant metastasis. Four additional patients developed concurrent locoregional disease progression and distant metastatic disease. The median time to disease progression was 19 months (range 5.3 – 29 months). Six patients died, and the median time to death was 18 months (range 12 – 42 months). The Kaplan-Meier estimates of 1-, 2-, and 3-year DFS rates for the entire population were 96%, 83%, and 80%, respectively. The Kaplan-Meier estimates of 1-, 2-, and 3-year OS rates were 100%, 91%, and 89%, respectively.
Post-treatment MTV and ITV predict outcome
The median time from completion of radiotherapy to post-treatment PET/CT was 3.4 months (range 0.7-11.5 months; Figure 2). Twelve patients (26%) had their post-treatment PET/CT outside our ideal imaging timeframe (i.e. outside of 10 weeks to 4 months after chemoradiotherapy for non-NPC histology, or outside of 1-2 months after adjuvant chemotherapy for NPC histology). PET/CT imaging was done too early because of scheduling errors (4 patients), and abnormal physical exam findings (1 patient). PET/CT imaging was delayed due to patient preference (2 patients), unrelated medical problems (2 patients), treatment-related complication (2 patients), and delayed wound healing from a post-treatment biopsy (1 patient; biopsy demonstrated radiation-related changes). Forty-three (91%) of the post-treatment PET/CT scans were done for routine surveillance. The four (9%) non-surveillance scans were done to follow up on abnormal MR imaging (2 patients), physical exam findings (1 patient) and suspicious symptoms (1 patient). Of these four non-surveillance scans, only one patient ultimately suffered disease progression.
Figure 2.

Time of post-treatment PET/CT. Figure represents the time from end of radiotherapy (RT) to follow up PET/CT. White bars represent the proportion of patients who ultimately developed disease progression or death. Black bars represent patients who did not experience disease progression or death.
To explore the relationship between post-treatment PET and outcome, we used a Cox-regression model to analyze post-treatment SUVmax, MTV and ITV with multiple SUV threshold levels (Figure 3). Because we tested multiple PET parameters, the Bonferroni adjusted level of significance was p=0.0045. While multiple PET endpoints were associated with outcome, the endpoint that was associated with the greatest hazard of disease progression or death was MTV2.0. The median MTV2.0 was 15 cm3 (range 0.5 – 117; interquartile range 21 cm3). An increase in MTV2.0 of 21 cm3 was associated with an increased hazard of disease progression (DFS) and death (OS), with hazard ratios of 2.5 (95% CI 1.6-3.9; p=0.0001) and 2.0 (95% CI 1.3-3.1; p=0.003), respectively.
Figure 3.

Multiple post-treatment PET metrics predict outcome.
Plots represent hazard ratios (solid diamonds in A and C) and associated p-values (open circles in B and D) from a univariate Cox-regression model for DFS (A and B), and OS (C and D) conducted on the entire study population (n=47). Prior to analysis, each PET parameter was normalized to its interquartile range. The Bonferroni corrected significance level was p=0.0045. Abbreviations: DFS = disease-free survival, OS = overall survival, MTV2.0 = metabolic tumor volume with an SUV threshold of 2.0 (described in methods), ITV2.0 = integrated threshold tumor volume with an SUV threshold of 2.0 (described in methods), SUVmax = maximum SUV.
Correlation between post-treatment MTV and pre-treatment MTV
We sought to determine the relationship and predictive properties between pre-and post-treatment PET/CT endpoints. We have previously reported that pre-treatment MTV50% was associated with outcome (6), and this present study demonstrated that several post-treatment PET/CT metrics were associated with outcome. For this analysis, we opted to use pre-treatment MTV50%, and post-treatment MTV2.0, as these were the most robust predictors of outcome. First we tested for correlation between these two variables with a Pearson correlation coefficient. There was a positive but weak correlation between pre-treatment MTV50% and post-treatment MTV2.0 (r=0.42, p=0.003). Next we tested pre-treatment MTV50%, post-treatment MTV2.0, and KPS (previously shown to predict outcome (6)) in a multivariate Cox-regression model. Post-treatment MTV2.0 was the sole predictive variable associated with DFS and OS, with hazard ratios of 2.47 (p=0.0001) and 1.98 (p=0.0033), respectively (Table 3).
Table 3.
Multivariate analysis
| Variable | p-value | HR (95% CI) |
|---|---|---|
| Disease free survival | ||
| KPS | 0.88 | 0.99 (0.88-1.12) |
| Pre-treatment MTV50% | 0.11 | 1.42 (0.93-2.17) |
| Post-treatment MTV2.0 | 0.0001 | 2.47 (1.56-3.90) |
| Overall survival | ||
| KPS | 0.95 | 1.00 (0.87-1.14) |
| Pre-treatment MTV50% | 0.48 | 1.25 (0.67-2.32) |
| Post-treatment MTV2.0 | 0.0033 | 1.98 (1.26-3.12) |
Abbreviations: KPS = Karnofsky Performance Status; MTV = metabolic tumor volume
Non-nasopharyngeal carcinoma
Given that nasopharyngeal carcinoma (NPC) is associated with a different epidemiology, natural history and response to treatment (18-20) compared with non-nasopharyngeal carcinoma (non-NPC), we explored differences among these two populations with subset analyses. The NPC patients (n=13) had a lower post-treatment MTV2.0 compared with non-NPC patients (n=34). The mean MTV2.0 for NPC and non-NPC was 14 cm3, and 26 cm3, respectively (p=0.043 with two-tailed t-test). Analysis of the non-NPC cohort revealed that higher post-treatment MTV2.0 predicted DFS, and OS (Figure 4A and 4C). Because this analysis divided the cohort into two groups, we used a Bonferroni corrected significance level of p=0.025. In non-NPC patients, MTV2.0 <18 cm3 (median value) and MTV2.0 ≥18cm3 yielded 2-yr DFS rates of 100% and 63%, respectively (p=0.0062). Additionally, in non-NPC patients, MTV2.0 <18 cm3 and MTV2.0 ≥18cm3 yielded 2-yr OS rates of 100% and 81%, respectively (p=0.0093). Within the NPC cohort, there was no significant correlation between post-treatment MTV2.0 and DFS (p=0.43) or OS (p=0.28) (Figure 4B and 4D).
Figure 4.
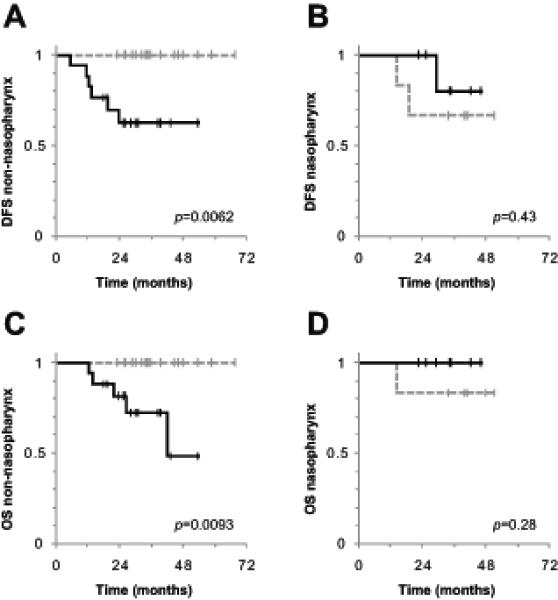
Post-treatment MTV2.0 predicts outcome in non-nasopharyngeal histology.
Plots represent Kaplan-Meier curves of DFS (A and B), and OS (C and D), in patients with non-nasopharyngeal (A and C), and nasopharyngeal histology (B and D). The Bonferroni corrected level of significance was p=0.025. The dotted gray lines represent post-treatment MTV2.0 <median, and the solid black lines represent post-treatment MTV2.0 ≥median. Abbreviations: DFS = disease free survival, OS = overall survival, MTV2.0 = metabolic tumor volume with an SUV threshold of 2.0 (described in methods).
DISCUSSION
Over the past two decades, strategies combining chemotherapy and radiation have significantly improved outcome in locally advanced HNC (21, 22). Despite these improvements, treatment regimens continue to be plagued with heterogeneous rates of locoregional disease progression. There is a need for biomarkers in HNC to categorize patients according to risk of disease progression, especially as we move towards risk-adapted therapy in the future. One potential use of a risk-stratifying biomarker would be to identify high-risk patients who could benefit from closer follow up or earlier intervention with salvage surgery, before the tumor becomes unresectable. The use of a more quantitative PET parameter such as MTV2.0 that incorporates volumetric data rather than SUVmax alone may help to improve PET’s performance in predicting for persistent nodal disease and guide the decision for appropriate neck dissection. PET/CT is emerging as a biomarker for outcome because its functional and anatomical imaging characteristics give it the tools necessary to stratify patients by disease burden.
The prognostic utility of post-radiation SUVmax has been extensively studied in HNC. While retrospective studies have demonstrated that SUVmax is superior to CT alone in predicting outcome (9, 10, 12, 14), a recently completed prospective trial from M.D. Anderson Cancer Center (MDACC) yielded conflicting results (11). MDACC prospectively evaluated 98 locally advanced HNC patients with PET/CT and contrast-enhanced CT eight weeks after completion of radiotherapy. These investigators found SUVmax to outperform CT in patients with high-risk HNC (human papillomavirus [HPV] -negative tumors, non-oropharyngeal primaries, or history of tobacco use), however found no difference in patients with low-risk disease. These somewhat conflicting results highlight the challenges inherent in using SUVmax as a prognostic factor. The primary goal of any SUV based measurement is to discriminate between residual tumor and other sources of FDG uptake. Unfortunately, several factors inherent in an SUV measurement will tend to obscure its predictive power, including post-radiation inflammation, normal tissue FDG uptake and infection (7). In this study we hypothesized that a PET/CT measurement which incorporates the volume of hypermetabolic tissue above an absolute threshold could improve the discrimination between normal tissue and tumor, and therefore could improve the prognostic capability of PET/CT. While we found multiple PET endpoints to predict outcome, the most robust predictor was the metabolic tumor volume (MTV2.0).
Another important factor in the discrimination between residual tumor and normal tissue is the timing of post-radiation PET/CT. Imaging done too soon after treatment will be heavily influenced by post-radiation inflammation, whereas imaging done too late may miss the window for potentially beneficial salvage treatment, such as surgery. Andrade et al. retrospectively analyzed a cohort of 28 HNC patients, and found that the response to treatment was more accurately assessed when PET/CT was done more that 8 weeks after completion of treatment (23). Greven et al. conducted a prospective trial during which 45 HNC patients received post-radiation PET imaging at 1-, 4-, 12- and 24-months (24). Greven found the 4-month PET to be more accurate in predicting recurrent disease than the 1-month PET. In our study, 94% of our imaging occurred more than 2 months after completion of therapy. While the imaging timeframe in this current study is comparable to the above studies, the optimal timing of PET/CT in the post-radiotherapy setting warrants further investigation.
An interesting observation of this present study relates to our multivariate analysis comparing pre- and post-treatment PET measurements. While both pre-radiation MTV50% (previously demonstrated (6)) and post-radiation MTV2.0 (Figure 3) predicted outcome on univariate analysis, only post-radiation MTV2.0 remained significant on multivariate analysis (Table 3). This finding suggests that response to treatment (measured by post-treatment MTV) is more predictive of outcome than initial tumor burden (measured by pre-treatment MTV), however this conclusion should be taken with caution because of the small sample sizes in this study.
Although our sample size was too small to determine the prognostic impact of MTV separately for the low- and the high-risk head and neck cancer groups, as defined in the MDACC study (11), we did have a high percentage of NPC patients in our study and therefore evaluated the effect of post-treatment MTV separately for NPC and non-NPC cancers. The association between post-treatment MTV2.0 and outcome was only valid in the subset of patients without NPC. In fact, in patients without NPC, no patient with a MTV2.0 less than the median value (18 cm3) suffered disease progression or death (Figure 4). While we found no correlation with MTV in the NPC population, other investigators have found that outcome is associated with post-treatment SUVmax (19, 25, 26). The differing predictive powers of post-radiation MTV and SUVmax in the NPC cohort is difficult to explain, however could be related to the increased radiosensitivity inherent in NPC, or could be a spurious finding related to our small sample size.
Limitations of this study include the small sample size, heterogeneous patient population and diversity of treatment regimens. Additionally, the methods involved with determining post-treatment MTV are more labor-intensive and user-dependent than the semi-automated method of determining pre-treatment MTV (6), however we are developing software to help automate this process. Finally, given the retrospective nature of this study, conclusions put forth here are hypothesis generating, and should be validated prospectively in the future.
In conclusion, this is the first study to demonstrate a relationship between the post-treatment MTV and outcome. While we found multiple PET/CT endpoints to predict outcome, the most robust predictor was the MTV2.0. In fact, MTV2.0 was the sole independent predictive factor of disease progression and death on multivariate analysis. As we move towards risk-adapted therapy in the future, biomarkers such as MTV will be important to stratify patients into different risk-based categories.
Acknowledgments
Supported in part by: R01 CA118582-04 (QTL, EEG)
Footnotes
Publisher's Disclaimer: This is a PDF file of an unedited manuscript that has been accepted for publication. As a service to our customers we are providing this early version of the manuscript. The manuscript will undergo copyediting, typesetting, and review of the resulting proof before it is published in its final citable form. Please note that during the production process errors may be discovered which could affect the content, and all legal disclaimers that apply to the journal pertain.
Conflict of interest: none
REFERENCES
- 1.Ford EC, Herman J, Yorke E, et al. 18F-FDG PET/CT for image-guided and intensity-modulated radiotherapy. J Nucl Med. 2009;50:1655–1665. doi: 10.2967/jnumed.108.055780. [DOI] [PMC free article] [PubMed] [Google Scholar]
- 2.Schmid DT, Stoeckli SJ, Bandhauer F, et al. Impact of positron emission tomography on the initial staging and therapy in locoregional advanced squamous cell carcinoma of the head and neck. Laryngoscope. 2003;113:888–891. doi: 10.1097/00005537-200305000-00021. [DOI] [PubMed] [Google Scholar]
- 3.Tucker R, Coel M, Ko J, et al. Impact of fluorine-18 fluorodeoxyglucose positron emission tomography on patient management: first year’s experience in a clinical center. J Clin Oncol. 2001;19:2504–2508. doi: 10.1200/JCO.2001.19.9.2504. [DOI] [PubMed] [Google Scholar]
- 4.Allal AS, Dulguerov P, Allaoua M, et al. Standardized uptake value of 2-[(18)F] fluoro-2-deoxy-D-glucose in predicting outcome in head and neck carcinomas treated by radiotherapy with or without chemotherapy. J Clin Oncol. 2002;20:1398–1404. doi: 10.1200/JCO.2002.20.5.1398. [DOI] [PubMed] [Google Scholar]
- 5.Allal AS, Slosman DO, Kebdani T, et al. Prediction of outcome in head-and-neck cancer patients using the standardized uptake value of 2-[18F]fluoro-2-deoxy-D-glucose. Int J Radiat Oncol Biol Phys. 2004;59:1295–1300. doi: 10.1016/j.ijrobp.2003.12.039. [DOI] [PubMed] [Google Scholar]
- 6.La TH, Filion EJ, Turnbull BB, et al. Metabolic tumor volume predicts for recurrence and death in head-and-neck cancer. Int J Radiat Oncol Biol Phys. 2009;74:1335–1341. doi: 10.1016/j.ijrobp.2008.10.060. [DOI] [PMC free article] [PubMed] [Google Scholar]
- 7.Goerres GW, Von Schulthess GK, Hany TF. Positron emission tomography and PET CT of the head and neck: FDG uptake in normal anatomy, in benign lesions, and in changes resulting from treatment. AJR Am J Roentgenol. 2002;179:1337–1343. doi: 10.2214/ajr.179.5.1791337. [DOI] [PubMed] [Google Scholar]
- 8.Gourin CG, Williams HT, Seabolt WN, et al. Utility of positron emission tomography-computed tomography in identification of residual nodal disease after chemoradiation for advanced head and neck cancer. Laryngoscope. 2006;116:705–710. doi: 10.1097/01.MLG.0000215176.98582.A9. [DOI] [PubMed] [Google Scholar]
- 9.Kubota K, Yokoyama J, Yamaguchi K, et al. FDG-PET delayed imaging for the detection of head and neck cancer recurrence after radio-chemotherapy: comparison with MRI/CT. Eur J Nucl Med Mol Imaging. 2004;31:590–595. doi: 10.1007/s00259-003-1408-6. [DOI] [PubMed] [Google Scholar]
- 10.Li P, Zhuang H, Mozley PD, et al. Evaluation of recurrent squamous cell carcinoma of the head and neck with FDG positron emission tomography. Clin Nucl Med. 2001;26:131–135. doi: 10.1097/00003072-200102000-00008. [DOI] [PubMed] [Google Scholar]
- 11.Moeller BJ, Rana V, Cannon BA, et al. Prospective risk-adjusted [18F]Fluorodeoxyglucose positron emission tomography and computed tomography assessment of radiation response in head and neck cancer. J Clin Oncol. 2009;27:2509–2515. doi: 10.1200/JCO.2008.19.3300. [DOI] [PMC free article] [PubMed] [Google Scholar]
- 12.Sakamoto H, Nakai Y, Ohashi Y, et al. Monitoring of response to radiotherapy with fluorine-18 deoxyglucose PET of head and neck squamous cell carcinomas. Acta Otolaryngol Suppl. 1998;538:254–260. [PubMed] [Google Scholar]
- 13.Wong RJ, Lin DT, Schoder H, et al. Diagnostic and prognostic value of [(18)F]fluorodeoxyglucose positron emission tomography for recurrent head and neck squamous cell carcinoma. J Clin Oncol. 2002;20:4199–4208. doi: 10.1200/JCO.2002.02.590. [DOI] [PubMed] [Google Scholar]
- 14.Yao M, Smith RB, Graham MM, et al. The role of FDG PET in management of neck metastasis from head-and-neck cancer after definitive radiation treatment. Int J Radiat Oncol Biol Phys. 2005;63:991–999. doi: 10.1016/j.ijrobp.2005.03.066. [DOI] [PubMed] [Google Scholar]
- 15.Kaplan EL, Meier P. Nonparametric estimation from incomplete observations. Journal of the American Statistical Association. 1958;53:457–481. [Google Scholar]
- 16.Cox DR. Regression models and life tables. Journal of the Royal Statistical Society Series B. 1972;34:187–220. [Google Scholar]
- 17.Sainani KL. The problem of multiple testing. Pm R. 2009;1:1098–1103. doi: 10.1016/j.pmrj.2009.10.004. [DOI] [PubMed] [Google Scholar]
- 18.Chan AT, Teo PM, Huang DP. Pathogenesis and treatment of nasopharyngeal carcinoma. Semin Oncol. 2004;31:794–801. doi: 10.1053/j.seminoncol.2004.09.008. [DOI] [PubMed] [Google Scholar]
- 19.Tao Q, Chan AT. Nasopharyngeal carcinoma: molecular pathogenesis and therapeutic developments. Expert Rev Mol Med. 2007;9:1–24. doi: 10.1017/S1462399407000312. [DOI] [PubMed] [Google Scholar]
- 20.Wei WI, Sham JS. Nasopharyngeal carcinoma. Lancet. 2005;365:2041–2054. doi: 10.1016/S0140-6736(05)66698-6. [DOI] [PubMed] [Google Scholar]
- 21.Budach W, Hehr T, Budach V, et al. A meta-analysis of hyperfractionated and accelerated radiotherapy and combined chemotherapy and radiotherapy regimens in unresected locally advanced squamous cell carcinoma of the head and neck. BMC Cancer. 2006;6:28. doi: 10.1186/1471-2407-6-28. [DOI] [PMC free article] [PubMed] [Google Scholar]
- 22.Pignon JP, le Maitre A, Maillard E, et al. Meta-analysis of chemotherapy in head and neck cancer (MACH-NC): an update on 93 randomised trials and 17,346 patients. Radiother Oncol. 2009;92:4–14. doi: 10.1016/j.radonc.2009.04.014. [DOI] [PubMed] [Google Scholar]
- 23.Andrade RS, Heron DE, Degirmenci B, et al. Posttreatment assessment of response using FDG-PET/CT for patients treated with definitive radiation therapy for head and neck cancers. Int J Radiat Oncol Biol Phys. 2006;65:1315–1322. doi: 10.1016/j.ijrobp.2006.03.015. [DOI] [PubMed] [Google Scholar]
- 24.Greven KM, Williams DW, 3rd, McGuirt WF, Sr., et al. Serial positron emission tomography scans following radiation therapy of patients with head and neck cancer. Head Neck. 2001;23:942–946. doi: 10.1002/hed.1136. [DOI] [PubMed] [Google Scholar]
- 25.Yen RF, Hong RL, Tzen KY, et al. Whole-body 18F-FDG PET in recurrent or metastatic nasopharyngeal carcinoma. J Nucl Med. 2005;46:770–774. [PubMed] [Google Scholar]
- 26.Yen RF, Hung RL, Pan MH, et al. 18-fluoro-2-deoxyglucose positron emission tomography in detecting residual/recurrent nasopharyngeal carcinomas and comparison with magnetic resonance imaging. Cancer. 2003;98:283–287. doi: 10.1002/cncr.11519. [DOI] [PubMed] [Google Scholar]