

Abstract
Obesity has been associated with increased incidence and aggressiveness of prostate cancer. Although controversial, several studies suggest that leptin could influence tumour cell growth and proliferation. The main goal of this study was to assess cellular growth of prostate adenocarcinoma cells in obese mice with different endogenous hormonal environments in what relates to leptin circulating levels and sensitivity. Four groups of mice (n = 6/group) were used, namely obese mice with congenital non-functioning leptin receptor OBR (db/db), obese mice with congenital leptin deficiency (ob/ob), mice with diet induced obesity (DIO) and normal weight C57BL/6J mice (control). All groups of mice were injected subcutaneously with 3.0 × 10⁵ RM1 cells/500 μl PBS (murine prostate carcinoma androgen insensitive cells) and tumour growth and angiogenesis were evaluated 14 days after inoculation. The tumours induced in ob/ob and DIO mice were significantly larger (P < 0.001) while those induced in db/db mice were significantly smaller (P= 0.047), when compared with controls. Morphometric analysis revealed that mitotic index and Ki-67 positive nuclear density, both cell proliferation markers, were also significantly lower in the tumours of db/db mice (P < 0.001) when compared to controls. An inverse correlation was observed between leptin plasma levels and tumour weight (r = −0.642, P < 0.001), mitotic index (r = −0.646, P < 0.01) and Ki-67 positive nuclear density (r = −0.795, P < 0.001). These results suggest that high leptin concentrations are not favourable to RM1 cell growth and proliferation. On the contrary, high plasma leptin levels were associated with less cellular proliferation and angiogenesis in vivo.
Keywords: leptin, morphometry, obesity, OBR, prostate cancer, RM1 cells
In the last century, obesity has taken epidemic proportions at most western populations (Hedley et al. 2004; Ogden et al. 2006; James 2008). The rising prevalence of obesity and overweight has been attributed to the increase of caloric consumption, in particular of high fat diets, together with the sedentary lifestyle of population (Crespo et al. 2001; Calle & Kaaks 2004; Stubbs & Lee 2004). Obesity is a major public health problem as it is associated with increased risk for several co-morbid conditions such as hypertension, type 2 diabetes, cardiovascular disease and some types of cancer like colon, breast, and prostate among others (Calle & Kaaks 2004). Since the 1970s, epidemiological studies have disclosed the possible association between increased adiposity and increased incidence of colon (Schoen et al. 1999; Calle & Kaaks 2004; Pischon et al. 2006; Giovannucci & Michaud 2007), breast (Calle & Kaaks 2004; Majed et al. 2007), kidney (Asal et al. 1988; Calle & Kaaks 2004; Luo et al. 2007), oesophagus (Brown et al. 1995; Vaughan et al. 1995; Calle & Kaaks 2004; Veugelers et al. 2006) and endometrial (Calle & Kaaks 2004; Chia et al. 2007) cancers, in addition to an unfavourable prognosis and increased death rate from cancer (Calle & Kaaks 2004).
In opposite to what was thought for many years, the adipose tissue is not a passive deposit of triglycerides, it is an active tissue with many biological and endocrine functions (Trayhurn & Beattie 2001; Kershaw & Flier 2004; Ronti et al. 2006). It was after the discovery of leptin, the first hormone secreted by the adipocyte to be identified in 1994 that the adipose tissue was formally accepted and recognized as a new endocrine organ (Zhang et al. 1994). Besides leptin other hormones and factors like IL-6, TNFα and VEGF have also been found to be secreted by the adipose tissue in proportion to the tissue mass and have been related to the risk of development of some types of cancer, such as prostate cancer (Mistry et al. 2007). While some other factors, like adiponectin, seem to have a protective role in carcinogenesis (Goktas et al. 2005; Bub et al. 2006; Mistry et al. 2006).
Leptin is a protein, codified by the ob gene, with 16 kDa containing 167 aminoacids, it is secreted predominantly by the adipocytes of the subcutaneous adipose tissue and in most individuals circulates in plasma levels that are proportional to the adipose tissue mass as well as the nutritional state of the individual (Frederich et al. 1995; Boden et al. 1996; Haque & Garg 2004). Leptin acts at the hypothalamus where it regulates body weight and energy balance (Zhang et al. 1994). Leptin is also considered a mitogenic, anti-apoptotic (Hoda & Popken 2008) and angiogenic mediator (Ambrosini et al. 2002), because by acting on one of its transmembrane receptor (Tartaglia et al. 1995), OBRb, which is the long isoform, also activates many genes involved in cellular proliferation such as c-fos, c-jun, junB, egr-1 and socs3 and angiogenesis regulation, like VEGF factor (Fruhbeck 2006).
The association between prostate cancer and obesity is a controversial issue since the results obtained by different studies have been contradictory (Giovannucci et al. 2003). Obesity seems to be a risk factor for the development of aggressive prostate tumours and increased mortality although low grade prostate tumours are also increased in obesity (Freedland et al. 2006, 2008; Ribeiro et al. 2006; Mistry et al. 2007). Increased leptin, insulin and IGF-1 plasma levels observed in obesity are potential mediators which may promote latent prostate cancer progression to an aggressive state (Amling 2004; Ribeiro et al. 2006; Mistry et al. 2007).
Since there is a controversial association of obesity and prostate cancer and on the role of leptin on cellular proliferation, angiogenesis, and in tumour development, our aim was to assess in vivo the degree of prostate cancer cell proliferation and angiogenesis in different strains of obese mice, namely in leptin deficient mice (ob/ob), leptin resistant and diabetic mice (db/db) and in mice with diet induced obesity.
Materials and methods
RM-1 murine prostate cancer cells
RM-1 cells are a murine androgen insensitive prostate cancer cell line, which was gently offered by T Thompson (MD Anderson Cancer Center, Houston, TX, USA) for this study (Baley et al. 1995). The cells were grown at 25 cm2 flasks in Dulbecco’s Modified Essential Medium (DMEM – Invitrogen, New York, NY, USA) with high glucose (4500 mg/l), 50 mM EPES buffer solution (Invitrogen), sodium bicarbonate (Sigma, St Louis, MO, USA), Penicillin–Streptomycin 100 U/ml (Invitrogen) and Nystatine 100 U/ml (Sigma) in a incubator (Function Line – Heraeus Instruments, Hanau, Germany) which maintained constant humid atmosphere with 5% CO2 at 37 °C. The cells were separated (passaged) every time they became confluent using trypsin 0.25% (Invitrogen). Mycoplasm test was performed in the cell culture medium, without any antibiotics, to exclude contamination. Cellular viability was evaluated using the trypan blue (Sigma) test and a viability superior to 90% was considered satisfactory.
RM1 Cellular characterization
Immunocytochemistry
A sample of RM1 cells in suspension, obtained at 17th passage, was analysed to check the presence or absence of leptin receptor OBRb (long form). After performing a 50 μl cytospin (Cytospin 3 – Shandon, Cheshire, UK) of the cell suspension on poly-l-lysine (Sigma) microscope slides, the cellular preparation was fixed with 10% formaldehyde. Cells were pepsin digested (0.1%) at HCl 0.01 N (pH 2.25) for 10 min and after this the endogenous peroxidase was blocked by adding H2O2 0.3% and incubating for 5 min. The preparation was first incubated with the primary antibody OBR 12-A (Alpha Diagnostics International, San António, TX, USA) 1:100 BSA 1% overnight at 4 °C and then with the secondary antibody (pig antibody anti-rabbit, DaKoCytomation, Glostrup, Denmark) 1:100 BSA 1% for 1 h. At the end of this time period the preparation was incubated with avidin–biotin complex (ABC, DaKoCytomation) for 30 min and after this the immune reaction was revealed using diaminobenzidine (DAB, DaKoCytomation) during 7 min.
Internal negative control was obtained by omitting the primary antibody (OBR 12-A) and external positive and negative controls were obtained by performing the same technique in mice peritoneal exudate obtained 5 h after intra-peritoneal injection of 1.5 mL casein 10% in C57BL/6J mice.
Normal mice prostate histological study
Native prostate of normal weight C57BL/6J adult male mice were collected and processed for routine histological analysis after being fixed in a paraformaldehyde and picric acid 14% solution. Microscopy slides with tumour sections were incubated in a pepsin solution (0.1%) HCl 0.01 N pH 2.25 during 45 min at 37 °C for antigen retrieval. Endogenous peroxidase blockade was performed by peroxide hydrogen 0.3% incubation for 5 min. Unspecific bindings were eliminated by incubation during 5 min with Protein Block (Novolink Polymer Detection System, Newcastle, UK). Slides were incubated overnight with primary antibody OBR 12-A (Alpha Diagnostics International) 1:100 BSA 1% at 4 °C. After this time were washed with PBS and incubated with Post Primary Block (Novolink Polymer Detection System) during 30 min and then with Polymer (Novolink Polymer Detection System) during another 30 min and the immune reaction was revealed with DAB.
Internal negative control was done as described above except for the omission of the primary antibody.
In vivo studies
Animals
Normal weight C54BL/6J (control), ob/ob, db/db and C54BL/6J male mice with diet induced obesity (DIO) were purchased to a certified commercial breeder (Charles River Laboratories, Barcelona, Spain) and maintained in standard animal house conditions, temperature 21 ± 1 °C and constant humidity, 12 h controlled photoperiod (7—19 h) with unrestricted assess to regular rat chow (SAFE – Scientific Animal Food & Engineering) and tap water, except for DIO mice that were fed from weaning with hypercaloric diet (45% fat, Charles River). All procedures were approved by the local Ethics Board for Animal Research and followed the European Union laws on animal protection (86/609/EC).
RM1 cellular growth dose–response curve in normal weight mice C57BL/6J
To evaluate RM1 cell growth in vivo seven groups of normal weight mice C57BL/6J (n= 6 mice/group) were inoculated subcutaneously with a suspension of RM1 cells in seven different concentrations: 1.5 × 10⁵, 3.0 × 10⁵, 6.0 × 10⁵, 7.5 × 10⁵, 9.0 × 10⁵, 1.2 × 10⁶ e 1.8 × 10⁶ cells/500 μl PBS. Tumour growth and development was then followed-up and monitored for 14 days after inoculation. At the end of the experiment mice were sacrificed by 99% CO2 atmosphere exposition, blood was collected by cardiac puncture and plasma was separated and kept at −20 °C for later hormone assays. The induced tumours were collected, weighed and processed for histological analysis.
RM1 cellular growth in obese mice
To access RM1 cell growth in obese mice, ob/ob mice (n = 6), db/db mice (n = 6), DIO mice (n = 6) and normal weight C57BL/6J mice (n = 6) (control) were subcutaneously inoculated with a suspension of RM1 at a concentration of 3.0 × 10⁵ cells/500 μl in PBS that was chosen from the dose-response curve performed in normal weight mice. All the experimental procedures were similar to the ones described above. At the end of the experimental period besides the tumour, epididymal fat was also collected and weighed, while plasma was collected to perform the hormone assays.
Tumours histological analysis
Ki-67 Immunohistochemistry
Tumour cellular proliferation was evaluated with the aid of Ki-67 nuclear antigen immunohistochemistry which is expressed during cellular cycle at G1, S, G2 and M phases.
Tumour sections were placed on poly-l-lysine covered microscopy slides. Microwaves were used for antigen retrieval by emerging the slides in tampon citrate solution 0.01 M (pH 6.0) and exposure to microwave oven at 900 W for 20 min. Endogenous peroxidase was neutralized using hydrogen peroxide (LabVision) and unspecific bindings were blocked with ultra block serum (LabVision, Fremont, CA, USA), then slides were incubated, for 60 min, with the primary antibody Ki67 (Novocastra, NCL-L-Ki67-MM1, Newcastle, UK) (1:30) at 25 °C, followed by the biotinylated secondary antibody Goat-Antipolyvalent (Labvision) incubation for 15 min at room temperature. The immune reaction was then marked by an enzymatic polyvalent complex Streptavidin HRP (Labvision) and revelled by adding DAB substrate (Diaminobenzidine tetrahydrochloride, Sigma).
Internal negative control was obtained by omission of the primary antibody and by the observation of unstained muscular cells.
Caveolin immunohistochemistry
Angiogenesis was evaluated with the aid of anti-caveolin immunohistochemistry performed on the tumour sections. The technique was similar to the one described for Ki-67 immunohistochemistry except for the primary antibody used that in this case was anti-caveolin antibody (BD Biosciences, San Jose, CA, USA) 1:400.
Internal negative control was obtained by omission of the primary anti-body and absence of staining in mice pancreatic glandular cells was used as external negative control.
For each antibody, samples were processed the same day and simultaneously to decrease inter-assay variability.
Morphometric analysis
Morphometric analysis was done in 10 digital pictures per slide of 10 high magnification fields (400×, 10× ocular 40× objective) corresponding to an area of 4567.8 μm2/picture selected by peripheral scanning of the tumour section and avoiding the central area of necrosis. Nuclei and cells in mitosis stained by Ki-67 and vascular vessels stained by caveolin immune reaction were counted in each picture with the aid of a specifically calibrated computer software acopulated to the microscope digital camera (Leica Qwin, Leica Microsystems, Wetzlar, Germany).
Hormone assays
Leptin, insulin and IGF-1 plasma levels were determined using commercial ELISA kits (EZML-82K, EZRML-13K, Linco Research and RMEE25R, BioVendor, respectively) according to the manufacturer instructions.
Statistical analysis of the results
Means, standard error of the mean (SEM), normality and homogeneity of variances were calculated for each group. Differences between means were analysed by anova test with LSD post-hoc correction or Kruskal–Wallis test as appropriate. For correlation studies Pearson and Spearman tests were used. P < 0.05 was considered statistical significant. All statistically analyses were done using windows spss software (version 16).
Results
RM1 cellular characterization
Immunocytochemistry
RM1 cells stained positive for OBRb using the specific antibody OBR 12-A, as demonstrated by the brown coloration of the RM1 cells on the cell periphery (Figure 1a) which supports the OBRb presence at this prostate cancer cellular line. Antibody specificity was further tested by performing the same immunocytochemistry study on a sample of peritoneal exudates, which permitted to verify that macrophages stained positively whereas neutrophils did not stain for OBRb (Figure 1b), as anticipated since OBRb is known to be expressed by macrophages but not by neutrophils (O’Rourke et al. 2001; Bruno et al. 2005). Mice native prostate glandular epithelium also stained positive on the OBRb immunohistochemistry study (Figure 1c, d).
Figure 1.
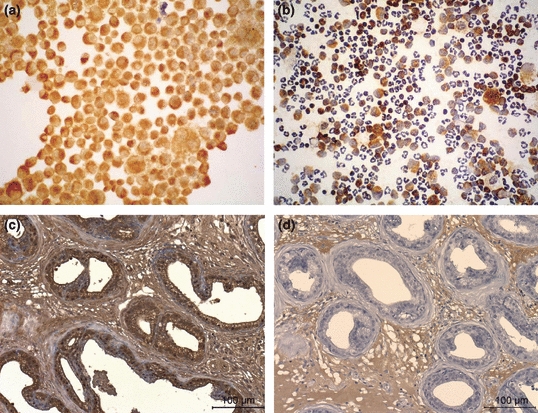
RM1 cells (a) show a brown coloration on the membrane of the cell which corresponds to the location of the leptin receptors after ObR immunocytochemistry. Mice peritoneal exudates (b) with macrophages marked positively for ObR (brown coloration) and neutrophils (unstained) that were used as controls (100×). Immunohistochemistry for ObR of normal C57BL/6J mice prostate (400×) showing the epithelial prostate cells positively stained (c) and negative control (d).
In vivo studies
Dose–response curve in normal weight C57BL/6J mice
Tumour growth 14 days after dorsal subcutaneous inoculation of different concentrations of RM1 cells (1.5 × 10⁵, 3.0 × 10⁵, 6.0 × 10⁵, 7.5 × 10⁵, 9.0 × 10⁵, 1.2 × 10⁶ and 1.8 × 10⁶ cells in 500 μl of PBS) in C57BL/6J mice was proportional to the concentration of the inoculums’. The 3.0 × 10⁵ cells/500 μl PBS concentration was chosen as the ideal one to be used in the obese mice study because tumours obtained after inoculation of this cellular suspension concentration since these were large enough to allow morphological analysis, presented the smaller dimension variability (SE = 0.242), a small area of central necrosis and high mitotic density (data not known).
RM1 cells growth in obese mice
RM1 cells (3.0 × 10⁵ cells/500 μl PBS) where inoculated in obese ob/ob mice, db/db mice, DIO mice and normal weight C57BL/6J mice (control). Animals mean body weight was significantly higher in the obese ob/ob (57.5 ± 0.99 g) and in obese diabetic db/db mice (43.0 ± 1.69 g) when compared with DIO (30.2 ± 1.47 g) and control mice (31.7 ± 0.66 g) (P < 0.001) (Table 1). Epididymal fat weight for 100 g of body weight, used as a surrogate marker of fatty body content, was significantly higher at all three groups of obese mice ob/ob (4.59 ± 0.26 g), db/db (4.70 ± 0.08 g) and DIO (2.29 ± 0.03 g) when compared with control (1.19 ± 0.09 g); (P < 0.001, P < 0.001, P < 0.01, respectively) (Table 1).
Table 1.
Mice body weight, epididymal fat weight for percentage of body weight, tumour final weight, leptin, insulin and IGF-1 plasma levels 14 days after RM1 cell inoculation in the different experimental groups
| Control | db/db | ob/ob | DIO | P | |
|---|---|---|---|---|---|
| Body weight (g) | 31.72 ± 0.66 | 43.0 ± 1.69 | 57.5 ± 0.99 | 30.2 ± 1.47 | P< 0.001*† |
| Epididymal fat tissue (g) | 1.19 ± 0.09 | 4.70 ± 0.08 | 4.59 ± 0.26 | 2.29 ± 0.03 | P< 0.001*†P< 0.01‡ |
| Tumour weight (g) | 1.00 ± 0.24 | 0.16 ± 0.069 | 2.82 ± 0.46 | 2.78 ± 0.19 | P< 0.001*‡P< 0.05† |
| Leptin (ng/ml) | 2.10 ± 0.44 | 26.62 ± 3.38 | ND | 2.92 ± 0.42 | P< 0.001† |
| Insulin (ng/ml) | 1.07 ± 0.24 | 1.90 ± 0.38 | 7.15 ± 1.27 | 0.76 ± 0.18 | P< 0.01* |
| IGF-1 (ng/ml) | 385.33 ± 66.51 | 437.16 ± 153.32 | 486.18 ± 216.98 | 360.44 ± 129.08 | NS |
ob/ob vs control.
db/db vs control.
DIO vs control.
ND, below detection level; NS, non-significant.
The tumour weight 14 days after inoculation was significantly higher in ob/ob (2.82 ± 0.46 g) and DIO (2.78 ± 0.19 g) mice (P < 0.001) while db/db mice displayed significantly smaller tumours (0.16 ± 0.069 g) (P < 0.05) when compared to control mice (1.00 ± 0.24 g) tumours (Table 1).
Morphometric studies
Tumour cell proliferation as accessed by counting ki-67 positive nuclei density was higher in the ob/ob and DIO mice and lower in the db/db mice when compared with controls (Figure 2a–d), although only the difference between db/db mice and control has been statistically significant (P < 0.001) as shown on Figure 2e. The mitotic index determined by mitosis counting on the same slides stained with anti-Ki67 to allow a better visualization of mitotic nuclei was also significantly lower in the db/db mice tumours when compared to tumours of control mice group (P < 0.001) (Figure 3a–e).
Figure 2.
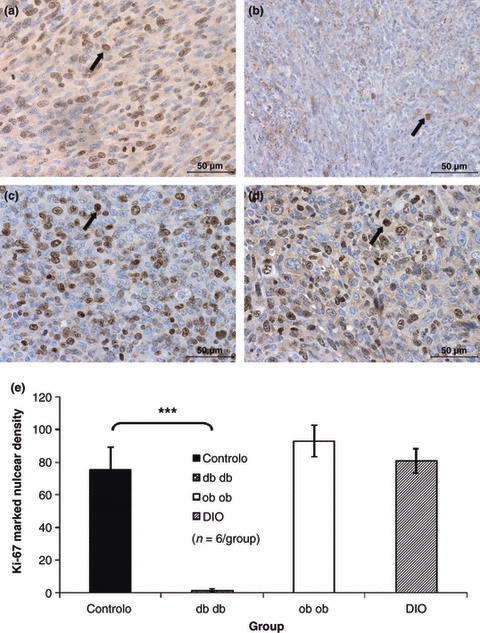
Immunohistochemistry for Ki-67 used to quantify cell proliferation, showing that the density of positively stained nuclei (arrows) was lower in the tumours of db/db mice (b) when compared with controls (a), while tumours developed by ob/ob (c) and DIO (d) mice presented a similar nuclear density and not significantly different from controls (400×).Graphic representation of Ki-67 positive nuclear density, db/db mice tumours presented a cell proliferation index significantly smaller when compared to the controls (anova***P < 0.001) (e).
Figure 3.
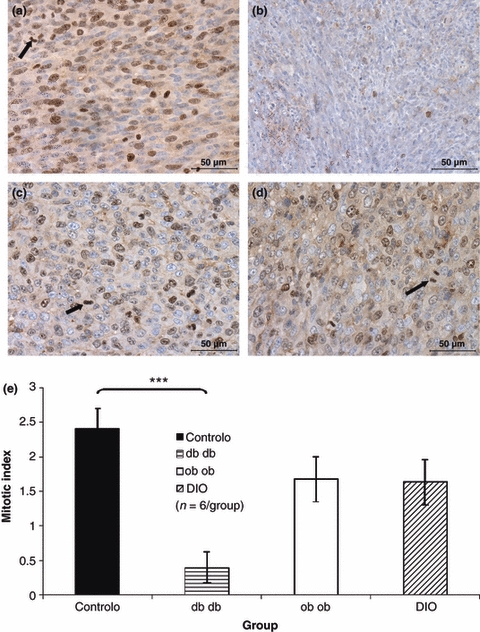
Immunohistochemistry for Ki-67 used to count mitosis (arrows) and to determine the mitotic index, which was significantly smaller in db/db mice tumours (b) when compared to controls, while the mitotic index of the tumours induced in ob/ob (c), DIO (d) mice were similar to the ones presented by the controls (a) (400×). Mitotic index graphic representation of the tumours presented by the different study groups, showing that db/db mice tumours presented a mitotic density significantly smaller than the control group (anova***P < 0.001) (e).
Vascular density was significantly higher in tumours of db/db mice (P< 0.05) while vascular density of tumours of ob/ob and DIO mice was not statistically different from controls as it can be observed in Figure 4.
Figure 4.
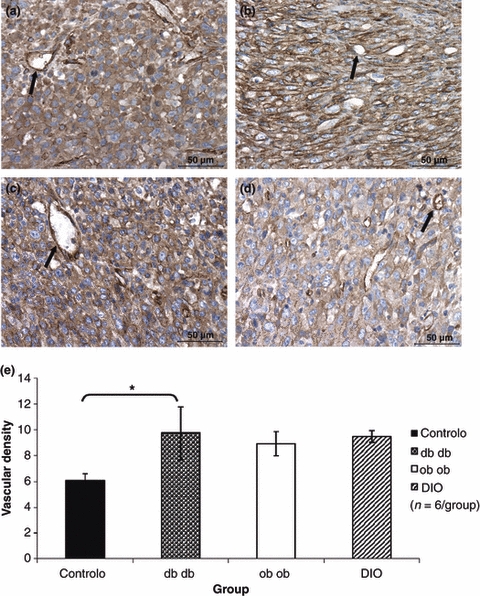
Tumour immunohistochemistry for caveolin used to count stained vessels (arrows) and quantify angiogenesis: these pictures show an increased capillary density in the tumours of the db/db group (b) when compared to tumours of the control group (a), while tumours depicted by ob/ob and DIO mice present a similar degree of angionegenesis (400×). Graphic representation of the vascular density determined after counting caveolin stained vessels, showing that db/db mice tumours had a significantly higher vascular density when compared with the ones of the control group (anova*P = 0.040) (e).
Hormonal plasma levels
Leptin plasma levels of ob/ob mice were undetectable while those of db/db mice (26.62 ± 3.38 ng/ml) were significantly higher when compared with control mice (2.10 ± 0.44 ng/ml) (P < 0.001) (Table 1).
Insulin plasma levels were significantly higher in ob/ob mice (7.15 ± 1.27 ng/ml) when compared to the control group (P < 0.01), insulin plasma levels of db/db (1.90 ± 0.38 ng/ml) and DIO mice (0.76 ± 0.18 ng/ml) were similar to control group (1.07 ± 0.24 ng/ml), as shown on Table 1. IGF-1 levels were not significantly different between the four groups of animals, namely in ob/ob mice (486.18 ± 216.98 ng/ml), db/db mice (437.16 ± 153.32 ng/ml), DIO mice (360.44 ± 129.08 ng/ml) and control mice (385.33 ± 66.51 ng/ml) (Table 1).
Correlations
After obtaining these results a further statistical analysis was performed to determine whether there was any correlation between leptin levels and tumour weight and the histological parameters evaluated. A negative correlation was observed between leptin plasma levels and tumour weight that was statistically significant (r = −0.642, P < 0.001). Leptin plasma levels were also negatively correlated with Ki67 labelled nuclei density (r = −0.795, P < 0.001) and with the mitotic index (r= −0.646, P < 0.01). There was no correlation between insulin or IGF-1 levels and any of the other parameters evaluated.
Discussion
Although controversial, obesity has been considered a risk factor for prostate cancer (Giovannucci et al. 2003; Baillargeon et al. 2006). Leptin, a hormone produced primarily by the adipocyte which circulates in the plasma at concentrations that are usually directly proportional to body fat content (Frederich et al. 1995; Maffei et al. 1995), has been considered as a putative link between obesity and cancer development (Chang et al. 2001; Mistry et al. 2007). This hormone acts after binding to a membrane receptor and activates intracellular pathways, such as JAK2/STAT3, MAPK/ERK and PI3K/Akt, promoting antiapoptotic, cellular proliferation, mitogenesis and angiogenesis (Baumann et al. 1996; Nakashima et al. 1997; Fruhbeck 2006). Leptin receptor isoform OBRb, localized at the cellular membrane, has been pointed as the principle responsible for activation of the pathways mentioned above. In vitro studies, using human prostate cancer cells in culture, namely androgen independent DU145 and PC-3 cell lines (Somasundar et al. 2003; Deo et al. 2008; Hoda & Popken 2008) and androgen dependent LNCaP cell line (Deo et al. 2008) performed to evaluate cellular proliferation and intracellular pathways activation in the presence of leptin have demonstrated that this hormone induces proliferation while diminishes cell apoptosis in androgen independent prostate cancer cells (DU145 and PC-3) through PI-3K and MAPK pathways activation (Somasundar et al. 2004; Hoda & Popken 2008). Deo et al. has also observed that leptin also leads to STAT-3 pathway activation in androgen dependent (DU145 and PC-3) and independent cell lines (LNCaP) and to cellular proliferation in LNCaP cells (Deo et al. 2008). These results diverge from the ones presented by Onuma et al. (2003) that have demonstrated that cell proliferation is only increased in androgen independent cells.
The aim of our study was to evaluate in vivo, the effect of leptin on prostate cancer cell growth, by injecting RM1 cells that are murine androgen insensitive epithelial prostate cancer cells in obese mice. We have deliberately chosen an androgen insensitive cell line to exclude androgen levels from the confounding variables, as obese individuals may present a decrease in circulating androgen levels (Cohen 2001).
Since RM1 cells had not been previously characterized in what concerns leptin receptor presentation, our first aim has been to access the OBR presence by performing an immunocytochemistry using a specific antibody for the long isoform (OBRb), which has confirmed the presence of the receptor by showing a positive staining of the RM1 cell membrane. This result has been confirmed by performing external controls, namely by applying the same technique to mice peritoneal exudates in which macrophages that express the long isoform of the leptin receptor were also labelled positively (O’Rourke et al. 2001) while neutrophils that only express the short isoform (OBRa) were not labelled (Bruno et al. 2005). Normal mice prostate OBRb immunohistochemistry, using the same antibody also showed that the prostate glandular epithelium labelled positively for the long isoform of the leptin receptor, as previously demonstrated by Malendowicz et al. (2006).
Since these results were positive, we have proceeded to the in vivo study in order to evaluate leptin effect on RM1 cellular proliferation.
The RM1 cells were inoculated subcutaneously in the dorsal region of normal weight C57BL/6J mice at seven different cell concentrations and were followed up for 14 days in order to determine the most appropriate concentration to be used in the subsequent studies. Tumours obtained were analysed in what concerns mitotic index, area of necrosis and intra-group variability. Our results were similar to the results obtained by Voeks et al. (2002) that reported that RM1 cells, when inoculated subcutaneously, present a fast growth, conducting to high grade tumours 10 Gleason score (5+5), since cells present a high abnormality grade and are poorly differentiated (McNeal & Gleason 1991). After tumour histological analysis, we have chosen the 3.0 × 10⁵ cells/500 μl PBS cell concentration since tumours obtained after the inoculation of this concentration presented a small intra-group variability, a high mitotic index and a necrosis area practically inexistent and thus allowing the development of tumours at ideal conditions for morphologic analysis.
To evaluate RM1 cell growth in obese animals with different endogenous environments with regards to leptin sensitivity and leptin levels, the cells were inoculated in obese mice ob/ob with congenital leptin deficiency due to a mutation that inactivates the leptin gene ob (Zhang et al. 1994); in obese db/db mice, diabetic and hiperleptinemic in result of congenital leptin resistance due to a spontaneous mutation on the gene of the leptin receptor db (Chua et al. 1996); in C57BL/6J with diet induced obesity (DIO) by feeding with hypercaloric and hyperlipidic diet (45% fat) started after weaning and thus inducing fat mass gain and increased leptin levels in animals with functional leptin receptors; and in normal weight C57BL/6J mice that were used as controls.
As expected, db/db and ob/ob mice presented body weights significantly higher when compared with control mice, while DIO mice weight was not statistically different from the control group. Nevertheless, when relative body composition was evaluated, DIO mice presented an increased epididymal fat percentage, a surrogate marker of visceral fat content (Monteiro et al. 2006), when compared with the control group, so in spite of DIO mice having the same body weight body as controls these mice have an increased fat mass. Likewise, as expected, leptin plasma levels were undetectable in ob/ob mice and were significantly higher in db/db mice when compared with control mice. DIO mice also presented higher leptin plasma levels than control mice but this difference was not statistically significant.
After RM1 cell inoculation, leptin deficient mice (ob/ob) developed significantly larger tumours than control mice, while leptin resistant mice (db/db) presented significantly smaller tumours when compared with control mice. This is the opposite to what was expected if leptin worked as a tumour growth factor as some authors have proposed (Chang et al. 2001; Somasundar et al. 2003, 2004; Mistry et al. 2008). Chang et al. has evaluated the association of leptin plasma levels with tumour volume at total prostatectomy in patients and has verified that after stratification for age, testosterone levels, body weight and body mass index, individuals with higher leptin levels presented a superior risk of developing larger tumours (Chang et al. 2001). While some other authors by conducting in vitro studies have verified that PC3 and DU145 cells (Somasundar 2003, 2004; Hoda & Popken 2008), both androgen independent human prostate cancer cell lines, presented increased cellular proliferation when cultivated in the presence of leptin. On the contrary, some other authors, like Stattin et al. (2003) in an epidemiologic study did not find any significant relationship between leptin plasma levels and risk of tumour development, while Hsing et al. (2001) which evaluated cellular growth of PC3 and DU145 cells in the presence of leptin also could not find any statistically significant association.
In our study, DIO mice developed tumours of similar size to those observed in ob/ob mice and significantly larger than the ones presented by the control group despite leptin plasma levels not being significantly higher. After morphometric analysis to evaluate the mitotic index and tumour cell proliferation, we have verified that leptin deficient ob/ob mice presented higher cellular proliferation indexes when compared to hyperleptinemic db/db mice, which presented tumours with a low cellular proliferation index, suggesting that leptin may act as a cellular proliferation repressor. A negative correlation statistically significant was also observed between leptin plasma levels and cellular proliferation and mitotic index of induced RM1 tumours.
Although vascular density of all obese mice tumours was higher than the observed in the tumours of controls, with the exception of the db/db mice group this failed to reach statistical significance, nevertheless we cannot exclude that the small sample size could be one of the reasons for not finding a significant difference. We were unable to find any correlation between leptin plasma levels and angiogenesis degree.
Contrary to our results, Sierra-Honigmann et al. have studied HUVECs cells (human umbilical vein endothelial cells) growth in the presence of leptin, after having verified that the cells presented the OBRb receptor by immunocytochemistry and that the receptor was functional by analysing OBRb tyrosine phosforilation and by determining STAT3 levels by SDS-PAGE and immunobloting. To determine whether leptin had any effect on angiogenesis in vitro, cellular migration evaluation through a porous membrane in response to leptin was evaluated. The authors demonstrated that HUVECs cells formed tubules similar to capillaries in a three-dimensional collagen gel in the presence of leptin. The same effect was demonstrated in in vivo studies, namely in rats rendered hyperleptinemic after implantation of a polymer with leptin solution in the rats cornea and in leptin resistant OBR deficient rats (fa/fa Zucker rats), In these animal models a vigorous angiogenic response was observed in leptin implanted rats, while the same was absent in fa/fa leptin resistant rats, thus in favour of a positive effect of leptin in angiogenesis (Sierra-Honigmann et al. 1998). Bouloumie et al. have demonstrated the expression of the OBR receptor by RT-PCR in the same cell line and have also observed that leptin acted as a pro-angiogenic factor, in vitro and in vivo (Bouloumie et al. 1998).
In our study, since the results obtained after immunocytochemistry for the long isoform of the leptin receptors supported the presence of OBRb in RM1 cells, and leptin levels were negatively correlated with tumour size, these results suggest that leptin is not a tumour growth factor for RM1 cells in vivo, and could even function as RM1 proliferation inhibitor. To further clarify the role of the OBR receptor in RM1 cell proliferation activated by leptin it would be pertinent to evaluate cellular growth in the presence of leptin in vitro and to study the intracellular pathways of signal activation like MAPK, STAT3 and PI3-K similarly to what has been done with other cell lines (Deo et al. 2008; Hoda & Popken 2008).
Our results are in agreement with the results obtained by Hsing et al. (2001) and Stattin et al. (2003) that have not found any statistically significant association between leptin plasma levels and risk of prostate cancer development in clinical studies. The same authors in turn attribute the risk association to other circulating factors, namely insulin and IGF-1, which are frequently increased in the obese state (Hsing et al. 2001), nevertheless we also could not find any association between IGF-1 levels and tumour growth in our study.
Hoda and Popken (2008) in in vitro studies using two androgen independent human prostate cancer cell lines, DU145 and PC-3, grown in the presence of leptin have demonstrated that leptin promotes cellular proliferation and inhibits apoptosis, while Deo et al. (2008) that studied the same two cellular lines mentioned above and also the LNCaP androgen independent cell line, has verified that leptin only enhanced the cellular growth in the last one.
Nunez et al. to dissociate the effect of obesity in carcinogenesis from other hormones that are frequently increased in obesity, studied breast and skin cancer development in ‘Fatless A-ZIP/F-1’ lipodistrophic transgenic mice, which is an animal model with practically inexistent white adipose tissue and low leptin levels, but presenting insulin resistance and increased insulin levels. Fatless mice develop more breast and skin tumours than wild mice suggesting that insulin, IGF-1 and IL-6 which levels are elevated in these mice as result of insulin resistance and pro-inflammatory state might be the principal link factors between obesity and cancer (Nunez et al. 2006). Ablamunits et al. (2006) to study leptin and adipose tissue effects on tumour development have also induced skin cancer in ob/ob and A-ZIP/F-1 mice and verified that leptin deficient mice when compared to control mice did not present augmented carcinogenesis while lipodistrophic and leptin deficient mice presented higher carcinogenesis suggesting adipose tissue could function has protector factor for tumour development.
In our study, and as expected, ob/ob mice, which are hyperphagic, obese and insulin resistant, presented plasma insulin levels significantly higher than control mice while db/db mice, which have a similar phenotype to ob/ob mice, but besides presenting insulin resistance are diabetic due to pancreatic beta cell insufficiency, present insulin plasma levels not significantly different from control mice. In spite of these differences in insulin levels we also could not find any association between insulin and tumour growth in our current study.
Cox et al. (2009) has demonstrated the presence of insulin receptors in human prostate primary tumours suggesting that hyperinsulinemia associated to obesity could have an adverse effect in this carcinoma development. Insulin binds to its receptor and activates several intracellular pathways RAS/RAF/MEK/ERK which stimulate mitogenesis and Akt by PI-3K phosphorilation that inhibit apoptosis and promote carcinogenesis (Frasca et al. 2008). Insulin also acts at the autonomous nervous system, in hyperinsulinemic conditions, insulin promotes sympathetic nervous system activation which in turn stimulates catecolamines production which could have a trophic effect in tumour cells by decreasing apoptosis (Nandeesha 2008). Leitzmann et al. in a prospective epidemiologic study followed up a cohort of 33 088 men, aged between 55 and 74 years during 8.9 years and has verified an inverse relation between diabetes and prostate cancer development risk, total risk (non-aggressive and aggressive forms) and non-aggressive risk, which suggests that diabetes could act as a protector for initial prostate cancer states (Leitzmann et al. 2008).
To our knowledge the presence of insulin receptors in RM1 cells has not been assessed it would be pertinent in future studies, to explore this signalling pathway, namely by verifying whether the cells express the insulin receptor and by determining the role of insulin in in vitro and in vivo cellular proliferation. Also, we could not find any association between insulin levels and any of the parameters evaluated in this study.
Obesity is a pathological state characterized by altered circulating levels of several hormones, growth factors and cytokines with potential influence on cellular proliferation, thus from the results obtained in our study we cannot exclude that other factors such as adiponectin (Goktas et al. 2005; Lihn et al. 2005; Mistry et al. 2006; Michalakis et al. 2007) or IL-6 (Fried et al. 1998; Stienstra et al. 2007) could be involved on tumour cell proliferation. These factors and pathways were not evaluated in this study.
Our results could also be due to the fact that the chosen animal models diverge not only in leptin levels but also in other circulating factors, such as insulin among others previously mentioned, with a potential to interfere on tumour growth. In future studies it would be important to repeat this study using normal weight mice rendered hyperleptinemic by exogenous leptin administration to allow the evaluation of the leptin role on tumour cell proliferation independently of other factors which are also altered in obesity. Testosterone levels could also potentially interact with leptin levels and lead to different patterns of tumour growth in this animal model, as we know that obese animals have lower androgen levels than lean controls it would be important to further characterize whereas testosterone levels are able to modulate the response to leptin regarding tumour growth and angiogenesis. However, the RM1 cells used in this study are androgen insensitive and not suitable to study such interaction which would require the use of an androgen dependent murine prostate cell line, namely TRAMP cells.
In conclusion, in our research work performed to evaluate the influence of obesity and leptin on prostate cancer cell growth and angiogenesis in vivo, we verified that androgen insensitive murine prostate cancer RM1 cells when inoculated in obese hyperleptinemic db/db mice induced the development of small tumours with a low proliferation index and angiogenesis while in obese leptin deficient ob/ob mice induced larger tumours with high cell proliferation index when compared to control mice, suggesting that high leptin levels are not favourable to this androgen insensitive prostate cancer cell line and that the hormone will rather limit the growth of this type of prostate tumours.
Acknowledgments
We thank Prof. Thompson for kindly providing the RM1 cells that made this work possible; Rui Medeiros, Ricardo Ribeiro and Susana Carrilho for support with cell culture and experimental work; and Carlos Gouveia for technical support with immunohistochemistry. UMIB is funded by grants from FCT (POCTI/FEDER), Portugal.
References
- Ablamunits V, Cohen Y, Braazee IB, Gaetz HP, Vinson C, Klebanov S. Susceptibility to induced and spontaneous carcinogenesis is increased in fatless A-ZIP/F-1 but not in obese ob/ob mice. Cancer Res. 2006;66:8897–8902. doi: 10.1158/0008-5472.CAN-05-4679. [DOI] [PubMed] [Google Scholar]
- Ambrosini G, Nath AK, Sierra-Honigmann MR, Flores-Riveros J. Transcriptional activation of the human leptin gene in response to hypoxia. Involvement of hypoxia-inducible factor 1. J. Biol. Chem. 2002;277:34601–34609. doi: 10.1074/jbc.M205172200. [DOI] [PubMed] [Google Scholar]
- Amling CL. The association between obesity and the progression of prostate and renal cell carcinoma. Urol. Oncol. 2004;22:478–484. doi: 10.1016/j.urolonc.2004.10.004. [DOI] [PubMed] [Google Scholar]
- Asal NR, Risser DR, Kadamani S, Geyer JR, Lee ET, Cherng N. Risk factors in renal cell carcinoma: I. Methodology, demographics, tobacco, beverage use, and obesity. Cancer Detect. Prev. 1988;11:359–377. [PubMed] [Google Scholar]
- Baillargeon J, Platz EA, Rose DP, et al. Obesity, adipokines, and prostate cancer in a prospective population-based study. Cancer Epidemiol. Biomarkers Prev. 2006;15:1331–1335. doi: 10.1158/1055-9965.EPI-06-0082. [DOI] [PubMed] [Google Scholar]
- Baley PA, Yoshida K, Sehgal I, Thompson TCl. Progression to androgen insensitivity in a novel in vitro mouse model for prostate cancer. J. Steroid Biochem. Mol. Biol. 1995;52:403–413. doi: 10.1016/0960-0760(95)00001-g. [DOI] [PubMed] [Google Scholar]
- Baumann H, Morella KK, White DW. The full-length leptin receptor has signaling capabilities of interleukin 6-type cytokine receptors. Proc. Natl Acad. Sci. USA. 1996;93:8374–8378. doi: 10.1073/pnas.93.16.8374. [DOI] [PMC free article] [PubMed] [Google Scholar]
- Boden G, Chen X, Mozzoli M, Ryan I. Effect of fasting on serum leptin in normal human subjects. J. Clin. Endocrinol. Metab. 1996;81:3419–3423. doi: 10.1210/jcem.81.9.8784108. [DOI] [PubMed] [Google Scholar]
- Bouloumie A, Drexler HC, Busse R. Leptin, the product of Ob gene, promotes angiogenesis. Circ. Res. 1998;83:1059–1066. doi: 10.1161/01.res.83.10.1059. [DOI] [PubMed] [Google Scholar]
- Brown LM, Swanson CA, Gridley G, et al. Adenocarcinoma of the esophagus: role of obesity and diet. J. Natl Cancer Inst. 1995;87:104–109. doi: 10.1093/jnci/87.2.104. [DOI] [PubMed] [Google Scholar]
- Bruno A, Conus S, Simon HU. Apoptotic pathways are inhibited by leptin receptor activation in neutrophils. J. Immunol. 2005;174:8090–8096. doi: 10.4049/jimmunol.174.12.8090. [DOI] [PubMed] [Google Scholar]
- Bub JD, Miyazaki T, Iwamoto Y. Adiponectin as a growth inhibitor in prostate cancer cells. Biochem. Biophys. Res. Commun. 2006;340:1158–1166. doi: 10.1016/j.bbrc.2005.12.103. [DOI] [PubMed] [Google Scholar]
- Calle EE, Kaaks R. Overweight, obesity and cancer: epidemiological evidence and proposed mechanisms. Nat. Rev. Cancer. 2004;4:579–591. doi: 10.1038/nrc1408. [DOI] [PubMed] [Google Scholar]
- Chang S, Hursting SD, Contois JH. Leptin and prostate cancer. Prostate. 2001;46:62–67. doi: 10.1002/1097-0045(200101)46:1<62::aid-pros1009>3.0.co;2-v. [DOI] [PubMed] [Google Scholar]
- Chia VM, Newcomb PA, Trentham-Dietz A, Hampton JM. Obesity, diabetes, and other factors in relation to survival after endometrial cancer diagnosis. Int. J. Gynecol. Cancer. 2007;17:441–446. doi: 10.1111/j.1525-1438.2007.00790.x. [DOI] [PubMed] [Google Scholar]
- Chua SC, Jr, Chung WK, Wu-Peng XS, et al. Phenotypes of mouse diabetes and rat fatty due to mutations in the OB (leptin) receptor. Science. 1996;271:994–996. doi: 10.1126/science.271.5251.994. [DOI] [PubMed] [Google Scholar]
- Cohen PG. Aromatase, adiposity, aging and disease. The hypogonadal-metabolic-atherogenic-disease and aging connection. Med. Hypotheses. 2001;56:702–708. doi: 10.1054/mehy.2000.1169. [DOI] [PubMed] [Google Scholar]
- Cox ME, Gleave ME, Zakikhani M, et al. Insulin receptor expression by human prostate cancers. Prostate. 2009;69:33–40. doi: 10.1002/pros.20852. [DOI] [PubMed] [Google Scholar]
- Crespo CJ, Smit E, Troiano RP, Bartlett SJ, Macera CA, Andersen RE. Television watching, energy intake, and obesity in US children: results from the third National Health and Nutrition Examination Survey, 1988–1994. Arch. Pediatr. Adolesc. Med. 2001;155:360–365. doi: 10.1001/archpedi.155.3.360. [DOI] [PubMed] [Google Scholar]
- Deo DD, Rao AP, Bose SS, et al. Differential effects of leptin on the invasive potential of androgen-dependent and -independent prostate carcinoma cells. J. Biomed. Biotechnol. 2008;2008:163902. doi: 10.1155/2008/163902. [DOI] [PMC free article] [PubMed] [Google Scholar]
- Frasca F, Pandini G, Sciacca L, et al. The role of insulin receptors and IGF-I receptors in cancer and other diseases. Arch. Physiol. Biochem. 2008;114:23–37. doi: 10.1080/13813450801969715. [DOI] [PubMed] [Google Scholar]
- Frederich RC, Hamann A, Anderson S, Lollmann B, Lowell BB, Flier JS. Leptin levels reflect body lipid content in mice: evidence for diet-induced resistance to leptin action. Nat. Med. 1995;1:1311–1314. doi: 10.1038/nm1295-1311. [DOI] [PubMed] [Google Scholar]
- Frederich RC, Lollmann B, Hamann A, et al. Expression of ob mRNA and its encoded protein in rodents. Impact of nutrition and obesity. J. Clin. Invest. 1995;96:1658–1663. doi: 10.1172/JCI118206. [DOI] [PMC free article] [PubMed] [Google Scholar]
- Freedland SJ, Giovannucci E, Platz EA. Are findings from studies of obesity and prostate cancer really in conflict? Cancer Causes Control. 2006;17:5–9. doi: 10.1007/s10552-005-0378-3. [DOI] [PubMed] [Google Scholar]
- Freedland SJ, Wen J, Wuerstle M. Obesity is a significant risk factor for prostate cancer at the time of biopsy. Urology. 2008;72:1102–1105. doi: 10.1016/j.urology.2008.05.044. [DOI] [PMC free article] [PubMed] [Google Scholar]
- Fried SK, Bunkin DA, Greenberg AS. Omental and subcutaneous adipose tissues of obese subjects release interleukin-6: depot difference and regulation by glucocorticoid. J. Clin. Endocrinol. Metab. 1998;83:847–850. doi: 10.1210/jcem.83.3.4660. [DOI] [PubMed] [Google Scholar]
- Fruhbeck G. Intracellular signalling pathways activated by leptin. Biochem. J. 2006;393:7–20. doi: 10.1042/BJ20051578. [DOI] [PMC free article] [PubMed] [Google Scholar]
- Giovannucci E, Michaud D. The role of obesity and related metabolic disturbances in cancers of the colon, prostate, and pancreas. Gastroenterology. 2007;132:2208–2225. doi: 10.1053/j.gastro.2007.03.050. [DOI] [PubMed] [Google Scholar]
- Giovannucci E, Rimm EB, Liu Y, et al. Body mass index and risk of prostate cancer in U.S. health professionals. J. Natl Cancer Inst. 2003;95:1240–1244. doi: 10.1093/jnci/djg009. [DOI] [PubMed] [Google Scholar]
- Goktas S, Yilmaz MI, Caglar K, Sonmez A, Kilia S, Bedir S. Prostate cancer and adiponectin. Urology. 2005;65:1168–1172. doi: 10.1016/j.urology.2004.12.053. [DOI] [PubMed] [Google Scholar]
- Haque WA, Garg A. Adipocyte biology and adipocytokines. Clin. Lab. Med. 2004;24:217–234. doi: 10.1016/j.cll.2004.01.007. [DOI] [PubMed] [Google Scholar]
- Hedley AA, Ogden CL, Johnson CL, Carroll MD, Curtin LR, Flegal KM. Prevalence of overweight and obesity among US children, adolescents, and adults, 1999–2002. JAMA. 2004;291:2847–2850. doi: 10.1001/jama.291.23.2847. [DOI] [PubMed] [Google Scholar]
- Hoda MR, Popken G. Mitogenic and anti-apoptotic actions of adipocyte-derived hormone leptin in prostate cancer cells. BJU Int. 2008;102:383–388. doi: 10.1111/j.1464-410X.2008.07534.x. [DOI] [PubMed] [Google Scholar]
- Hsing AW, Chua S, Jr, Gao YT, et al. Prostate cancer risk and serum levels of insulin and leptin: a population-based study. J. Natl Cancer Inst. 2001;93:783–789. doi: 10.1093/jnci/93.10.783. [DOI] [PubMed] [Google Scholar]
- James WP. WHO recognition of the global obesity epidemic. Int. J. Obes. (Lond) 2008;32(Suppl 7):S120–S126. doi: 10.1038/ijo.2008.247. [DOI] [PubMed] [Google Scholar]
- Kershaw EE, Flier JS. Adipose tissue as an endocrine organ. J. Clin. Endocrinol. Metab. 2004;89:2548–2556. doi: 10.1210/jc.2004-0395. [DOI] [PubMed] [Google Scholar]
- Leitzmann MF, Ahn J, Albanes D, et al. Diabetes mellitus and prostate cancer risk in the Prostate, Lung, Colorectal, and Ovarian Cancer Screening Trial. Cancer Causes Control. 2008;19:1267–1276. doi: 10.1007/s10552-008-9198-6. [DOI] [PMC free article] [PubMed] [Google Scholar]
- Lihn AS, Pedersen SB, Richelsen B. Adiponectin: action, regulation and association to insulin sensitivity. Obes. Rev. 2005;6:13–21. doi: 10.1111/j.1467-789X.2005.00159.x. [DOI] [PubMed] [Google Scholar]
- Luo J, Margolis KL, Adami HO, Lopez AM, Lessin L, Ye W. Body size, weight cycling, and risk of renal cell carcinoma among postmenopausal women: the Women’s Health Initiative (United States) Am. J. Epidemiol. 2007;166:752–759. doi: 10.1093/aje/kwm137. [DOI] [PubMed] [Google Scholar]
- Maffei M, Halaas J, Ravussin E, et al. Leptin levels in human and rodent: measurement of plasma leptin and ob RNA in obese and weight-reduced subjects. Nat. Med. 1995;1:1155–1161. doi: 10.1038/nm1195-1155. [DOI] [PubMed] [Google Scholar]
- Majed B, Moreau T, Senouci K, Salmon RJ, Fourquet A, Asselain B. Is obesity an independent prognosis factor in woman breast cancer? Breast Cancer Res. Treat. 2008;111:329–342. doi: 10.1007/s10549-007-9785-3. [DOI] [PubMed] [Google Scholar]
- Malendowicz W, Rucinski M, Macchi C, et al. Leptin and leptin receptors in the prostate and seminal vesicles of the adult rat. Int. J. Mol. Med. 2006;18:615–618. [PubMed] [Google Scholar]
- McNeal JE, Gleason DF. Gleason’s classification of prostatic adenocarcinomas. Ann. Pathol. 1991;11:163–168. [PubMed] [Google Scholar]
- Michalakis K, Williams CJ, Mitsiades N, et al. Serum adiponectin concentrations and tissue expression of adiponectin receptors are reduced in patients with prostate cancer: a case control study. Cancer Epidemiol. Biomarkers Prev. 2007;16:308–313. doi: 10.1158/1055-9965.EPI-06-0621. [DOI] [PubMed] [Google Scholar]
- Mistry T, Digby JE, Chen J, Desai KM, Randeva HS. The regulation of adiponectin receptors in human prostate cancer cell lines. Biochem. Biophys. Res. Commun. 2006;348:832–838. doi: 10.1016/j.bbrc.2006.07.139. [DOI] [PubMed] [Google Scholar]
- Mistry T, Digby JE, Desai KM, Randeva HS. Obesity and prostate cancer: a role for adipokines. Eur. Urol. 2007;52:46–53. doi: 10.1016/j.eururo.2007.03.054. [DOI] [PubMed] [Google Scholar]
- Mistry T, Digby JE, Desai KM, Randeva HS. Leptin and adiponectin interact in the regulation of prostate cancer cell growth via modulation of p53 and bcl-2 expression. BJU Int. 2008;101:1317–1322. doi: 10.1111/j.1464-410X.2008.07512.x. [DOI] [PubMed] [Google Scholar]
- Monteiro MP, Monteiro JD, Aguas AP, Cardoso MH. Rats submitted to gastric banding are leaner and show distinctive feeding patterns. Obes. Surg. 2006;16:597–602. doi: 10.1381/096089206776944931. [DOI] [PubMed] [Google Scholar]
- Nakashima K, Narazaki M, Taga T. Overlapping and distinct signals through leptin receptor (OB-R) and a closely related cytokine signal transducer, gp130. FEBS Lett. 1997;401:49–52. doi: 10.1016/s0014-5793(96)01430-5. [DOI] [PubMed] [Google Scholar]
- Nandeesha H. Insulin: a novel agent in the pathogenesis of prostate cancer. Int. Urol. Nephrol. 2009;41:267–272. doi: 10.1007/s11255-008-9440-x. [DOI] [PubMed] [Google Scholar]
- Nunez NP, Oh WJ, Rosenberg J, et al. Accelerated tumor formation in a fatless mouse with type 2 diabetes and inflammation. Cancer Res. 2006;66:5469–5476. doi: 10.1158/0008-5472.CAN-05-4102. [DOI] [PubMed] [Google Scholar]
- Ogden CL, Carroll MD, Curtin LR, McDowell MA, Tabak CJ, Flegal KM. Prevalence of overweight and obesity in the United States, 1999–2004. JAMA. 2006;295:1549–1555. doi: 10.1001/jama.295.13.1549. [DOI] [PubMed] [Google Scholar]
- Onuma M, Bub JD, Rummel TL, Iwamoto Y. Prostate cancer cell-adipocyte interaction: leptin mediates androgen-independent prostate cancer cell proliferation through c-Jun NH2-terminal kinase. J. Biol. Chem. 2003;278:42660–42667. doi: 10.1074/jbc.M304984200. [DOI] [PubMed] [Google Scholar]
- O’Rourke L, Yeaman SJ, Shepherd PR, et al. Insulin and leptin acutely regulate cholesterol ester metabolism in macrophages by novel signaling pathways. Diabetes. 2001;50:955–961. doi: 10.2337/diabetes.50.5.955. [DOI] [PubMed] [Google Scholar]
- Pischon T, Lahmann PH, Boeing H, et al. Body size and risk of colon and rectal cancer in the European Prospective Investigation Into Cancer and Nutrition (EPIC) J. Natl Cancer Inst. 2006;98:920–931. doi: 10.1093/jnci/djj246. [DOI] [PubMed] [Google Scholar]
- Ribeiro R, Lopes C, Medeiros R. The link between obesity and prostate cancer: the leptin pathway and therapeutic perspectives. Prostate Cancer Prostatic. Dis. 2006;9:19–24. doi: 10.1038/sj.pcan.4500844. [DOI] [PubMed] [Google Scholar]
- Ronti T, Lupattelli G, Mannarino E. The endocrine function of adipose tissue: an update. Clin. Endocrinol. (Oxf) 2006;64:355–365. doi: 10.1111/j.1365-2265.2006.02474.x. [DOI] [PubMed] [Google Scholar]
- Schoen RE, Tangen CM, Kuller LH, et al. Increased blood glucose and insulin, body size, and incident colorectal cancer. J. Natl Cancer Inst. 1999;91:1147–1154. doi: 10.1093/jnci/91.13.1147. [DOI] [PubMed] [Google Scholar]
- Sierra-Honigmann MR, Nath AK, Murakami C, et al. Biological action of leptin as an angiogenic factor. Science. 1998;281:1683–1686. doi: 10.1126/science.281.5383.1683. [DOI] [PubMed] [Google Scholar]
- Somasundar P, Yu AK, Vona-Davis L, McFadden DW. Differential effects of leptin on cancer in vitro. J. Surg. Res. 2003;113:50–55. doi: 10.1016/s0022-4804(03)00166-5. [DOI] [PubMed] [Google Scholar]
- Somasundar P, Frankenberry KA, Skinner H, et al. Prostate cancer cell proliferation is influenced by leptin. J. Surg. Res. 2004;118:71–82. doi: 10.1016/j.jss.2004.01.017. [DOI] [PubMed] [Google Scholar]
- Stattin P, Kaaks R, Johansson R, et al. Plasma leptin is not associated with prostate cancer risk. Cancer Epidemiol. Biomarkers Prev. 2003;12:474–475. [PubMed] [Google Scholar]
- Stienstra R, Duval C, Muller M, Kersten S. PPARs, Obesity, and Inflammation. PPAR Res. 2007;2007:95974. doi: 10.1155/2007/95974. [DOI] [PMC free article] [PubMed] [Google Scholar]
- Stubbs CO, Lee AJ. The obesity epidemic: both energy intake and physical activity contribute. Med. J. Aust. 2004;181:489–491. doi: 10.5694/j.1326-5377.2004.tb06406.x. [DOI] [PubMed] [Google Scholar]
- Tartaglia LA, Dembski M, Weng X, et al. Identification and expression cloning of a leptin receptor, OB-R. Cell. 1995;83:1263–1271. doi: 10.1016/0092-8674(95)90151-5. [DOI] [PubMed] [Google Scholar]
- Trayhurn P, Beattie JH. Physiological role of adipose tissue: white adipose tissue as an endocrine and secretory organ. Proc. Nutr. Soc. 2001;60:329–339. doi: 10.1079/pns200194. [DOI] [PubMed] [Google Scholar]
- Vaughan TL, Davis S, Kristal A, Thomas DB. Obesity, alcohol, and tobacco as risk factors for cancers of the esophagus and gastric cardia: adenocarcinoma versus squamous cell carcinoma. Cancer Epidemiol. Biomarkers Prev. 1995;4:85–92. [PubMed] [Google Scholar]
- Veugelers PJ, Porter GA, Guernsey DL, Casson AG. Obesity and lifestyle risk factors for gastroesophageal reflux disease, Barrett esophagus and esophageal adenocarcinoma. Dis. Esophagus. 2006;19:321–328. doi: 10.1111/j.1442-2050.2006.00602.x. [DOI] [PubMed] [Google Scholar]
- Voeks DJ, Martiniello-Wilks R, Russel PJ. Derivation of MPR and TRAMP models of prostate cancer and prostate cancer metastasis for evaluation of therapeutic strategies. Urol. Oncol. 2002;7:111–118. doi: 10.1016/s1078-1439(01)00180-6. [DOI] [PubMed] [Google Scholar]
- Zhang Y, Proenca R, Maffei M, Barone M, Leopold L, Friedman JM. Positional cloning of the mouse obese gene and its human homologue. Nature. 1994;372:425–432. doi: 10.1038/372425a0. [DOI] [PubMed] [Google Scholar]