

Abstract
Human plasma high density lipoproteins (HDL), the primary vehicle for reverse cholesterol transport, are the target of serum opacity factor (SOF), a virulence determinant of Streptococcus pyogenes that turns serum opaque. HDL comprise a core of neutral lipids–cholesteryl esters and some triglyceride–surrounded by a surface monolayer of cholesterol, phospholipids, and specialized proteins–apolipoproteins (apos) A-I and A-II. HDL is an unstable particle residing in a kinetic trap from which it can escape via chaotropic, detergent or thermal perturbation. Recombinant (r) SOF catalyzes the transfer of nearly all neutral lipids of ~100,000 HDL particles (D ~ 8.5 nm) into a single, large cholesteryl ester-rich microemulsion (CERM; D >100 nm) leaving a new HDL-like particle–neo HDL (D ~5.8 nm) while releasing lipid-free (LF) apo A-I. CERM formation and apo A-I release have similar kinetics suggesting parallel or rapid consecutive steps. By using complementary physico-chemical methods, we have refined the mechanistic model for HDL opacification. According to size exclusion chromatography, HDL containing non-labile apo A-I resists rSOF-mediated opacification. Based on kinetic cryo electron microscopy, rSOF (10 nM) catalyzes the conversion of HDL (4 μM) to neo HDL via a step-wise mechanism in which intermediate-size particles are seen. Kinetic turbidimetry revealed opacification as a rising exponential reaction with a rate constant k = (4.400 ± 0.004) × 10−2 min−1. Analysis of the kinetic data using transition state theory gave an enthalpy, entropy and free energy of activation of ΔH‡ = 73.9 kJ/mol, ΔS‡ = −66.87 J/°K, and ΔG‡ = 94.6 kJ/mol respectively. The free energy of activation for opacification is nearly identical to that for the displacement of apo A-I from HDL by guanidine hydrochloride. We conclude that apo A-I lability is required for HDL opacification, LF apo A-I desorption is the rate-limiting step, and nearly all HDL particles contain at least one labile copy of apo A-I.
Keywords: Serum opacity factor, electron cryomicroscopy, HDL remodeling, lipid fusion, apolipoprotein A-I, Streptococcus pyogenes
Cardiovascular disease (CVD) is a major source of mortality and morbidity and identification of therapies that address its underlying causes is an important public health priority. Dysregulated lipid metabolism that leads to elevated levels of plasma low density lipoprotein (LDL)-cholesterol (C) and to low plasma levels of high density lipoprotein (HDL)-C are risk factors for CVD.1–3 With wider use of the statins, which lower plasma LDL-C, low HDL-C has emerged as the most important lipoprotein disorder for which current therapies are inadequate. HDL is the primary plasma vehicle for reverse cholesterol transport (RCT), the transfer of cholesterol from peripheral tissue including the arterial wall to the liver for recycling or disposal. HDL comprise a core of neutral lipids–cholesteryl esters (CE) and small amounts of triglyceride (TG)–surrounded by a surface monomolecular layer of free cholesterol (FC), phospholipids (PL), and specialized surface binding proteins– apolipoproteins (apos)–mainly apos A-I and A-II.3 HDL is an unstable particle residing in a kinetic trap from which it can escape via chaotropic,4 detergent,5 or thermal perturbation.4, 6 Release of lipid-free (LF)-apo A-I is a hallmark of its instability,4–7 and is important in two physiological contexts. First, the initiating step in RCT–cellular cholesterol efflux–occurs through the interaction of LF-apo A-I with an ATP-binding cassette (ABC)A1 transporter.8 Second, the terminal RCT step, selective removal of HDL-CE via the hepatic scavenger receptor class B, type I (SR-BI), excludes apo A-I 9, 10 via a delipidation step for which the mechanism is unknown.
Serum opacity factor (SOF), a protein produced by Streptococcus pyogenes, is a fusogen that causes serum to cloud.11 The opacification reaction is novel if not unprecedented; studies with a recombinant (r) SOF that contains the essential opacification sequence have shown that the plasma reaction is specific to HDL and is associated with disruption of HDL structure and liberation of apos.12 Opacification occurs by a mechanism in which rSOF is a heterodivalent fusogen that catalyzes the disproportionation of HDL into a large CE-rich microemulsion (CERM) and neo HDL, an apo A-II- and PL-rich HDL-like particle, with the concomitant release of LF apo A-I.13 This reaction transfers the CE of >100,000 HDL particles to a single CERM that contains mostly apo E.13 rSOF is potent and catalytic; at 37 °C, ~ 10 nM rSOF totally opacifies 8 μM HDL, an 800-fold excess, in ~1 hour. rSOF opacifies HDL without breaking covalent bonds; it is not an enzyme but rather opacifies via a physical destabilization of HDL.12, 13 A schematic for the net opacification reaction is shown in Figure 1A.
Figure 1.

The Opacification Reaction. A, Schematic Representation of the Opacification Reaction. rSOF (10 nM) catalyzes the conversion of human HDL (~20 μM) to a CERM that contains the CE of ~100,000 HDL particles, a new apo A-II-rich particle called neo HDL, and LF apo A-I. Apo E is the major protein associated with the CERM. Apos A-I and A-II are shown as black and gray helices respectively. B – D, Representative cryo EM images obtained after incubation of human HDL (1.5 mg/mL) with rSOF (1 μg/mL) for 45 min. The scales are indicated in each panel; the CERM diameters in B – D are ~500, ~325, and ~100 nm respectively; the arrows point to new particles on the CERM, presumably HDL being process to neo HDL.
The rates for rSOF-mediated production of CERM and LF-apo A-I are similar suggesting either concerted (parallel) or rapidly successive steps.13 If concerted, the rate-limiting step might involve simultaneous apo A-I desorption and CE fusion. On the other hand, the reaction could occur in a step-wise mechanism in which one step, formation of CERM or LF-apo A-I, is rate-limiting. We have used kinetic cryo EM and turbidimetry and transition state theory to refine the mechanism for HDL opacification and to identify its rate-limiting step–desorption of LF-apo A-I.
Materials and Methods
Materials
HDL was isolated according to its density by sequential flotation of human plasma obtained from The Methodist Hospital Blood Donor Center;13 the HDL were further purified by SEC and for some tests HDL were subfractionated according to size by SEC using two Superose HR 6 columns (GE Healthcare, Piscataway, NJ) in tandem;13 fractions from multiple injections (0.5 mL) were pooled as needed for kinetic analysis. “Ultrastable” HDL7 was prepared by saturating HDL with guanidinium chloride (Gdm-Cl), warming to 40 °C for one hour, and stirring at room temperature for 24 hours. After exhaustive dialysis against TBS, the density was adjusted to 1.21 g/mL by the addition of KBr and centrifuged at 40,000 rpm (Beckman Ti 50.2 rotor) for 24 hours. The apo A-II-rich HDL, i.e., ultrastable HDL, was collected from the top of the tube by pipette. Cholesterol-free rHDL comprising apo A-I and 1-palmitoyl-2-oleoyl phosphatidylcholine was prepared by cholate dialysis.14 A recombinant polyhistidine-tagged, truncated form of sof2, rSOF, encoding amino acids 38–843 was cloned and expressed in Escherichia coli (rSOF) and purified by metal affinity chromatography as described previously.11
Kinetic Cryo EM
Opacification was initiated by combining rSOF and HDL, 1 μg/mL (~10 nM) and 0.5 mg/mL (~4 μM) respectively, at 37 °C. Aliquots were removed at 0 (no rSOF), 16, 45 and 94 min for vitrification, a rapid freezing process that fixes particles in their native solution conformation without a chemical fixative. Vitrification was performed in liquid ethane using standard procedures on a Vitrobot (FEI, Inc.) vitrification robot. Frozen specimens were stored in liquid nitrogen until imaging on a JEOL 2010F electron microscope equipped with a field emission gun and JEOL semi-automated automation software (FasTEM). The microscope was operated at a specimen temperature of 97 °K with an acceleration voltage of 200 kV. Images were recorded at a magnification of 40,000 with a GATAN 4k × 4k CCD camera (Gatan, Pleasanton CA) at a total dose of 18 electron/Å2.
Images of individual HDL particles were selected at 0, 16, 45 and 94min (5,000, 33,000, 8,000 and 35,000 particles respectively). The particle images were classified and averaged using an iterative alignment procedure in the EMAN15 software package, which produces a set of characteristic views from a heterogeneous particle population. The shortest and longest linear dimensions of each HDL class-average was measured and weighted by the number of particles contributing to that class. Averages were then integrated and interpolated yielding size distributions at each time point. Particle classification and averaging was performed using the refine2d.py program from the EMAN software package.16 This program performs iterative multivariate statistical analysis-based classification of 2-D particle images, producing a set of class-averages representative of the variation in the overall particle population.
Kinetic Turbidimetry
The rates of rSOF-mediated opacification of HDL were measured as a function of temperature by kinetic turbidimetry which monitors light scattering produced by the appearance of the very large (>100 nm) CERM. It is likely that the measured signal is not proportional to the extent of the reaction since it is dominated by large particles. However, the exponential fits were very close to the experimental data at all four temperatures studied. Moreover, any over weighting by large particles would expect to be similar at all temperatures.
After thermal preequilibration of HDL (0.8 mg/mL) at each temperature, rSOF (1 μg/mL) was added and the increase in right angle scattering light intensity at 325 nm was measured as a function of time on a Jobin Yvon Fluorolog. The intensity vs. time data were fitted to the growing exponential function, It = I0 + a(1 − e−kt), where I0 is the initial scattering intensity, It is the intensity as a function of time (t), a is a pre exponential instrumental factor and k is the rate constant. Using transition state theory, the respective enthalpy (ΔH‡) and entropy (ΔS‡) of formation of the activated state were determined as ΔH‡ = Ea − RT, ΔS‡ = 2.303 R logNhX/RT where R is the gas constant, T is the absolute temperature, k is the reaction rate constant, N is Avogadro’s number, h is Planck’s constant, and X = k/(exp−ΔH‡/RT). The free energy of activation (ΔG‡) was calculated as ΔG‡ = H‡ - TΔS‡.
Results
The Opacification Reaction
According to our previous work,13 summarized in Figure 1A, rSOF catalyzes the conversion of HDL to CERM, neo HDL, and LF apo A-I. To obtain a “snap shot” of this reaction, we incubated rSOF and HDL and “viewed” the reaction before its completion (45 min) by cryo EM (Figure 1B – D). Our assignment, according to the reaction chemistry,13 is that the large circles are CERM, and that some of these are surrounded by clusters of small quasi-spherical particles (arrows) with D ~ 13.5 – 27 nm, greater than the dimensions of HDL or neo HDL. Other views showed the putative CERM with striations reminisent of those seen in human low density lipoproteins, another CE-rich particle;16, 17 LF apo A-I was not visible in these images. These data suggested that the kinetics of this reaction could be determined by following the rate of appearance of neo HDL by cryo EM and the production of the large CERM by kinetic turbidimetry.
Kinetic Cryo EM
rSOF catalyzes HDL disproportionation into small lipid-protein particles–neo HDL, and large lipid-protein particles–CERM, with the concomitant release of LF-apo A-I. Given the dramatic rSOF-mediated changes in particle size, cryo electron microscopy was selected to follow the rate of neo HDL formation. While quenching the opacification reaction, cryofixation also allows a “freeze-frame” view of the structures of the reactants, intermediates, and products.
Representative views of HDL as observed by cryo electron microscopy before and at various times following addition of rSOF reveal that the HDL particle size decreases during opacification (Figure 2). Many images of individual HDL particles were selected at each time point, classified and averaged. The integrated averages were interpolated giving the size distributions at each time point (Figure 3A – D); the corresponding frequency distributions and cumulative frequency distributions are shown in Figure 3E – H. Inflection points (I1 and I2) in the latter identify the size ranges in which the most particles are clustered. Control HDL comprise particles with D = 8.54 ± 0.76 nm (Figure 3A, E); the cumulative frequency distribution contains a single inflection point very close to the mean particle size. In contrast, 16 min after mixing rSOF and HDL, we observed a broad range of particle sizes with the mean size lying between two inflection points, I1 and I2, in the cumulative frequency distribution (Figure 3F); the frequency range of I1 is broader than that of I2 indicating that many particles in the size range of HDL have disappeared but not all have been converted to the much smaller neo HDL (Figure 3B, F). At 45 min, we found a mean particle size, which is smaller than that found at 16 min and between two inflection points with similar cumulative frequency ranges (Figure 3C, G). At 94 min, most of the large HDL seen at t = 0 min, have been replaced by particles with D = 5.76 ± 1.12 nm (Figure 3D, H). According to the height of I2 (Figure 3G), the majority of sizes of the particles have begun to cluster at ~5.3 nm, the size of neo HDL. These sizes correspond to an rSOF-mediated mean reduction in particle volume from 326 to 100 nm3 (−67%; Figure 3D, H). Analysis of the rate data showed that rSOF-mediated conversion of HDL to neo HDL is a first-order reaction with a rate constant, (4.2 ± 1.5) × 10−2 min−1 (Figure 4A; r2 >0.91). Based on these kinetics, the reaction is >98% complete at 94 min (Figure 3D, H).
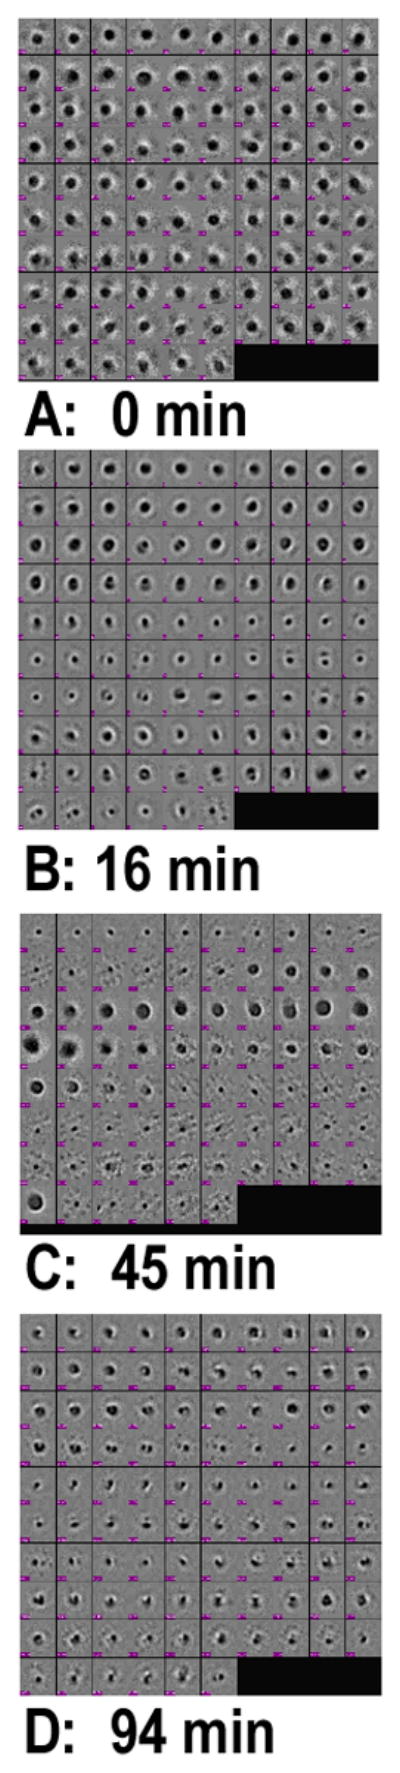
Figure 2.
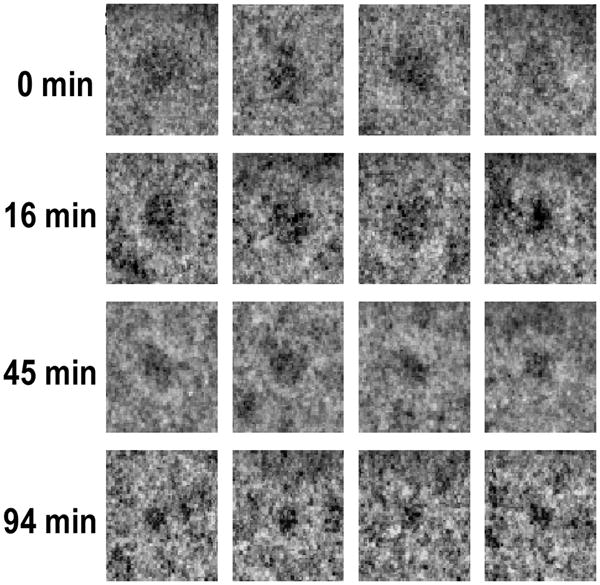
Representative images of individual HDL particles as they are converted to neo HDL particles. Images of HDL after mixing with SOF (37 °C). Samples were quick-frozen at various times after mixing and viewed on a JEOL 2010F electron cryo microscope. The times are 0, 16, 45 and 94 min as labeled.
Figure 3.
Cryo EM analysis of the rSOF-HDL reaction. (Left) Images of individual particles (~5000, 33000, 8000 and 35000 particles respectively) were selected at 0, 16, 45 and 94 min, classified, and iteratively averaged using EMAN software. E – F, size distribution as a function of time (0, 16, 45, and 94 min respectively). Linear dimensions of each class-average were measured and weighted by the number of particles contributing to that average. Each point (red) is a class-average. The cumulative freqency distributions are also shown (E – H) with the inflection points labeled as I1 and I2. At 0 min, most particles are ~8.54 nm; at 94 min, the majority are ~5.9 nm. The vertical and horizontal lines in each panel indicated the average sizes and standard deviations at each time point.
Figure 4.
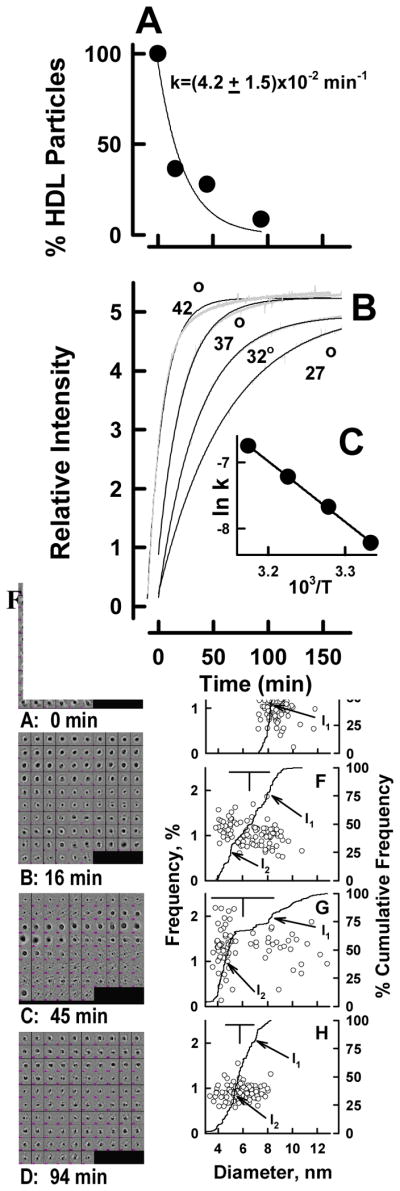
Opacification Kinetics. A. Kinetic analysis of Cryo EM data of Figure 3. The kinetics was calculated according to the rate of disappearance of particles in the HDL size-range (to the right of the vertical bar in Figure 3). A two-parameter exponential fit gave a rate constant, k = (4.2 ± 1.5) × 10−2 min-1 (r2 >0.96). B. Turbidimetric Kinetics of HDL Opacification at various temperatures showing the data (−) and the fitted curve (−). C. Arrhenius plot of opacification; Ea = 76.5 kJ/mole. r2 > 0.99.
Kinetic Turbidimitry
Opacification of plasma is a hallmark of the reaction catalyzed by SOF. Thus, light scattering by the CERM particles, which are very large (>100 nm), provided another way–kinetic turbidimetry–to follow reaction kinetics in real time. According to kinetic turbidimetry (Figure 4B), the rate of CERM formation at 37 °C is k = (4.4 ± 0.004) × 10−2 min−1, a value that compares well with the rate observed by kinetic cryo EM. The rate constant for opacification of HDL was temperature dependent and increased from 2.7 to 7.3 × 10⁻² min−1 between 300 and 315 °K (Figure 4B). The activation energy for CERM formation determined from its temperature dependence according to Arrhenius was 76.5 kJ/mol (Figure 4B, C). On the basis of the rate constant at 37 °C and the activation energy, the thermodynamics of the transition state for CERM formation were calculated using transition state theory, which gave ΔH‡ = 73.9 kJ/mol, ΔS‡ = −66.87 J/°K, and ΔG‡ = 94.6 kJ/mol. Thus, most (~80%) of the free energy of activation for opacification is enthalpically derived with the entropic component contributing the remaining ~20% (Table 1).
Table 1.
Transition State Parameters for HDL Opacification by rSOF
| k, min−1 | Ea, kJ | ΔH‡, kJ | −TΔS‡, kJ | ΔG‡, kJ | |
|---|---|---|---|---|---|
| CP* | 0.0032 | 110 | 107.5 | 11.6 | 95.9 |
| rSOF** | 0.044 | 76.5 | 73.9 | 20.7 | 94.6 |
From reference 7.
From data of Figure 4B, C.
Ultrastable HDL Resists Opacification
Chaotropic perturbation of HDL with Gdm-Cl releases a labile apo A-I fraction leaving an “ultrastable” apo A-II-rich particle4 from which additional apo A-I cannot be displaced by 6 M Gdm-Cl.7 We incubated saturating concentrations of Gdm-Cl (~7 M) with HDL at 40 and 25 °C for 1 and 24 hours respectively and isolated two major fractions–ultrastable HDL and LF-apo A-I (Figure 5A). The ultrastable HDL was isolated by flotation (Figure 5B), and the effects of rSOF on HDL and ultrastable HDL were compared by SEC. As previously observed, rSOF converts HDL into three fractions–CERM, neo HDL, and LF apo A-I (Figure 5C). In contrast, the rSOF had no effect of the SEC profile of ultrastable HDL (Figure 5D). Thus, ultrastable HDL is highly resistant to opacification and does not release LF apo A-I in response to rSOF treatment.
Figure 5.
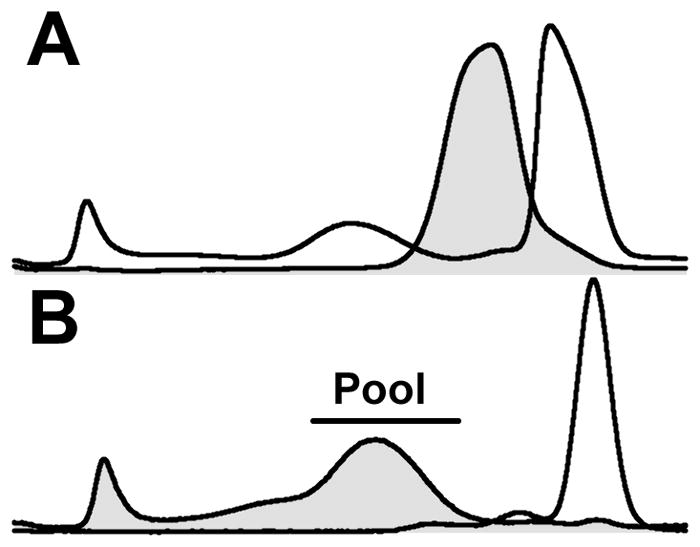
Effect of rSOF on Ultrastable HDL and rHDL. A: SEC profile of HDL before (filled curve) and after treatment (unfilled curve) with 6 M Gdm-Cl. B: SEC profile of the d < 1.21 g/mL (filled curve) and d > 1.21 g/mL fractions of HDL after treatment with 6 M Gdm-Cl; the horizontal bar indicates the ultrastable HDL pool. C. SEC profille of HDL (0.65 mg/mL) before (filled curve) and after (unfilled curve) treatment with rSOF (1 μg/mL for 3 hours). D. SEC profille of ultrastable HDL (0.65 mg/mL) before (filled curve) and after (unfilled curve) treatment with rSOF (1 μg/mL). E: SEC profiles of rHDL (0.5 mg/mL) before (filled curve) and after (unfilled curve) incubation with rSOF (1 μg/mL); difference between curves (dashed curve).
Given that the CE of HDL is one of the major components of the CERM, we used SEC to test the effects of rSOF on rHDL comprising apo A-I and POPC but no CE (Figure 5E). The effects of rSOF on rHDL are similar to those seen with HDL but much less profound. The SEC of the products of rSOF and rHDL contains a small peak in the void volume and a small shift in the peak for HDL. This effect is more readily seen in the calculated difference between the SEC curves for HDL before and after incubation with rSOF, which show that rSOF slightly reduces the size of rHDL. In addition, there is a shoulder on the main peak (Figure 5E, arrow) with an elution volume corresponding to that of LF apo A-I.
Effect of HDL Size on Opacification Kinetics
The rates of opacification of HDL subfractions isolated by SEC were compared by kinetic turbidimetry (Figure 6). These data revealed a linear relationship (Figure 6, insert) between HDL particle size and opacification rate with opacification of the largest subfraction being faster (+45%) than that of the smallest one.
Figure 6.

Kinetics of Opacification of HDL Subfractions. HDL was subfractionated by SEC and the kinetics of opacfication determined at 37 °C by measuring the increase in turbidity as a function of time. The HDL particle volumes are indicated adjacent to each curve. The particle volumes were calculated from the elution volumes of each HDL subfraction from a calibrated SEC column. Insert shows the linear relationship between size and the rate of opacification (r2 > 0.97).
Discussion
Kinetic Cryo EM
A Cryo EM view of the opacification reaction shows each CERM is associated with particles that are larger than HDL (Figure 1B – D) suggesting that there are opacification intermediates that involve some HDL fusion followed by complete delipidation. On the other hand, these could be small CERM intermediates that were seen by SEC.13 On the basis of SEC data, we previously proposed a model of SOF as a heterodivalent protein that binds and delipidates HDL particles in one concerted step that transfers the HDL-CE to a growing CERM. However, SEC does not have the size-discriminating power of cryo EM, which in the present study provides “snap shots” of the SOF reaction at various reaction time points. Our data show a relatively narrow distribution of HDL and neo HDL sizes at 0 and 94 min with few particles of intermediate size. In contrast, at 16 and 45 min, many of the particles have disappeared from the HDL size range but have not reached the size of mature neo HDL particles; these particles, which extend across the broad inflection point-1 in Figure 3F and G are likely intermediates in the conversion of HDL to neo HDL. These data strongly support a refined model of SOF-mediated delipidation of HDL in which some if not most HDL are only partially delipidated by rSOF and then released as intermediates that are seen at 16 and 45 min. These intermediates then reassociate via SOF with the growing CERM (Figure 3) until the delipidation process is completed.
HDL-Size Dependence of Opacification
Previous studies have shown similar kinetics for the opacification and the release of apo A-I.13 Other studies have shown that the rate of spontaneous lipid desorption increased with decreasing lipoprotein size.18 This is in accordance with the Kelvin equation, which states that the rate of desorption from particle surfaces is an inverse function of particle radius. Our new kinetic data show the opposite effect; opacification rates are a positive function of HDL size; thus, the rate-limiting step, LF apo A-I desorption, is not likely a simple spontaneous process but rather one that is intrinsic to rSOF catalysis.
Apo A-I Lability and a CE Core are Central to HDL Opacification
Release of LF apo A-I and CERM formation have similar kinetics13 suggesting that these two steps are mechanistically linked or occur in rapid succession. Three pieces of evidence suggest that opacification is dependent on the lability of apo A-I and that its desorption from HDL likely precedes CERM formation. First, LDL and VLDL, lipoproteins that do not contain apo A-I, are resistant to opacification.12 Second, ultrastable HDL which contains non labile, i.e., nondissociable apo A-I but is similar to native HDL in most other respects including lipid composition7 is highly resistant to rSOF-mediated opacification (Figure 5). Lastly, the transition state energetics of HDL opacification and chaotropic perturbation of HDL with Gdm-Cl are similar. Like opacification, chaotropic perturbation releases LF apo A-I (~50% of total HDL protein); unlike opacification, chaotropic perturbation does not form neo HDL nor CERM.7 Remarkably, the free energy of activation for opacification, 94.6 kJ, is virtually identical to that of the chaotropic perturbation of HDL (95.9 kJ; Table 1). Although the entropies and enthalpies of activation for opacification and chaotropic perturbation are quite different, the free energy of activation could be associated with the same step in opacification and chaotropic perturbation. Our previous studies showed that even if very different enthapies and entropies of activation are observed, the free energy of activation is essentially the same if the magnitude of the energy barrier is controlled by the same determinants.19 Given that the common characteristics of opacification and chaotropic perturbation of HDL are formation of LF apo A-I and similar free energies of activation, we conclude that apo A-I desorption is the rate-limiting step in HDL opacification, apo A-I is necessary but not sufficient for opacification, and some HDL-apo A-I must be labile; given that nearly all, ~98%, HDL is converted to neo HDL, >99% of HDL particles must contain at least one molecule of labile apo A-I.
The effects of rSOF on rHDL are subtle (Figure 5E). Whereas rSOF quantitatively converts HDL to CERM, neo HDL, and LF apo A-I, only a small amount of product is formed from rHDL for two likely reasons. First, rHDL contains no CE, the major component of the CERM, the essential opacifying product. Second, according to the model of Gursky,4, 25 CE formation via lecithin:cholesterol acyltransferase is destabilizing and puts HDL in a kinetic trap where it remains unless a mechanism for its escape is imposed, e.g., heat, denaturants, or rSOF. Each of these mechanisms promotes HDL-CE fusion, which satisfies in part the thermodynamic tendency of hydrocarbon-like substances to phase separate unless opposed by the association of surface components, phospholipids and apolipoproteins.26, 27 Having no CE, the rHDL lacks this important fusogenic force.
Opacification as a Rational Therapeutic Target
HDL is an unstable particle that resides in a kinetic trap from which it can escape by thermal, chaotropic and detergent perturbations, all of which release LF apo A-I.4–7 This instability, which is also revealed by HDL-remodeling proteins–cholesteryl ester and phospholipid transfer proteins, lecithin:cholesterol acyltransferase–makes HDL unique.20–23 Some of these activities are likely important in the formation of LF apo A-I that is needed to remove free cholesterol from macrophages via their ABCA1 transporters in the subendothelial space of the arterial wall.24 HDL instability is also likely involved in the selective uptake of CE by SR-BI-expressing cells, a process that segregates apo A-I from CE which is internalized without any associated apo A-I.
The products formed by rSOF are expected to participate in RCT in a way that is different from HDL. LF apo A-I is known to interact with ABACA1 thereby promoting cholesterol efflux; neo HDL, which has a higher phospholipid content than HDL, is expected to be a better acceptor of cholesterol via ABCG1 or spontaneous transfer; lastly, with its high apo E content, the CERM could bind to hepatocyte low density lipoprotein receptors. It has been proposed that the disruption of HDL by SOF may alter the anti-inflammatory properties of HDL and contribute to the pathogenesis of group A streptococcal infections.12 Therefore, SOF may not be suitable for direct use in therapy. However, our investigations into the mechanisms of opacification by SOF and the products formed by interactions between SOF and HDL may provide insights for the development of a therapeutic product that could be useful in enhancing RCT and controlling cholesterol concentrations.
Abbreviations
- apo
apolipoprotein
- LF
lipid-free
- rSOF
recombinant serum opacity factor
- Gdm-Cl
guanidinium chloride
- HDL
high density lipoproteins
- PL
phospholipid
- CE
cholesteryl ester
- PC
phosphatidylcholine
- CERM
cholesteryl ester-rich microemulsion
- SEC
size exclusion chromatography
- RCT
reverse cholesterol transport
- TBS
tris-buffered saline
- D
diameter
- cryo EM
electron cryomicroscopy
References
- 1.Gordon T, Hjortland M, Kannel W, Dawber T. High density lipoprotein as a protective factor against coronary heart disease: the Framingham Study. Am J Med. 1977;66:707–714. doi: 10.1016/0002-9343(77)90874-9. [DOI] [PubMed] [Google Scholar]
- 2.Miller NE, Thelle DS, Førde OH, Mjøs OD. The Tromsø heart study: high-density lipoprotein and coronary heart-disease: a prospective case-control study. Lancet. 1977;1:964–968. doi: 10.1016/s0140-6736(77)92274-7. [DOI] [PubMed] [Google Scholar]
- 3.Havel RJ, Goldstein JL, Brown MS. Lipoproteins in Lipid Transport. In: Bondy PK, Rosenberg LE, editors. The Metabolic Control of Disease. Saunders Publishing; Philadelphia: 1980. pp. 398–494. [Google Scholar]
- 4.Mehta R, Gantz DL, Gursky O. Human plasma high-density lipoproteins are stabilized by kinetic factors. J Mol Biol. 2003;328:183–192. doi: 10.1016/s0022-2836(03)00155-4. [DOI] [PubMed] [Google Scholar]
- 5.Pownall HJ. Remodeling of human plasma lipoproteins by detergent perturbation. Biochemistry. 2005;44:9714–9722. doi: 10.1021/bi050729q. [DOI] [PubMed] [Google Scholar]
- 6.Sparks DL, Phillips MC, Lund-Katz S. The charge and structural stability of apolipoprotein A-I in discoidal and spherical recombinant high density lipoprotein particles. J Biol Chem. 1992;267:25839–25847. [PubMed] [Google Scholar]
- 7.Pownall HJ, Hosken BD, Gillard BK, Higgins CL, Lin HY, Massey JB. Speciation of Human Plasma High Density Lipoprotein: HDL Stability and Apolipoprotein A-I Partitioning. Biochemistry. 2007;46:7449–7459. doi: 10.1021/bi700496w. [DOI] [PubMed] [Google Scholar]
- 8.Oram JF, Lawn RM, Garvin MR, Wade DP. ABCA1 is the cAMP-inducible apolipoprotein receptor that mediates cholesterol secretion from macrophages. J Biol Chem. 2000;275:34508–34511. doi: 10.1074/jbc.M006738200. [DOI] [PubMed] [Google Scholar]
- 9.Acton S, Rigotti A, Landschulz KT, Xu S, Hobbs HH, Krieger M. Identification of scavenger receptor SR-BI as a high density lipoprotein receptor. Science. 1996;271:518–520. doi: 10.1126/science.271.5248.518. [DOI] [PubMed] [Google Scholar]
- 10.Glass C, Pittman RC, Weinstein DB, Steinberg D. Dissociation of tissue uptake of cholesterol ester from that of apoprotein A-I of rat plasma high density lipoprotein: selective delivery of cholesterol ester to liver, adrenal, and gonad. Proc Natl Acad Sci USA. 1983;80:5435–5439. doi: 10.1073/pnas.80.17.5435. [DOI] [PMC free article] [PubMed] [Google Scholar]
- 11.Courtney HS, Hasty DL, Li Y, Chiang HC, Thacker JL, Dale JB. Serum opacity factor is a major fibronectin-binding protein and a virulence determinant of M type 2 Streptococcus pyogenes. Mol Microbiol. 1999;32:89–98. doi: 10.1046/j.1365-2958.1999.01328.x. [DOI] [PubMed] [Google Scholar]
- 12.Courtney HS, Zhang YM, Frank MW, Rock CO. Serum opacity factor, a streptococcal virulence factor that binds to apolipoproteins A-I and A-II and disrupts high density lipoprotein structure. J Biol Chem. 2006;281:5515–5521. doi: 10.1074/jbc.M512538200. [DOI] [PubMed] [Google Scholar]
- 13.Gillard BK, Courtney HS, Massey JB, Pownall HJ. Serum Opacity Factor Unmasks Human Plasma High Density Lipoprotein Instability via Selective Delipidation and Apolipoprotein A-I Desorption. Biochemistry. 2007;46:12968–12978. doi: 10.1021/bi701525w. [DOI] [PMC free article] [PubMed] [Google Scholar]
- 14.Matz CE, Jonas A. Micellar complexes of human apolipoprotein A-I with phosphatidylcholines and cholesterol prepared from cholate-lipid dispersions. J Biol Chem. 1982;257:4535–4540. [PubMed] [Google Scholar]
- 15.Ludtke SJ, Baldwin PR, Chiu W. EMAN: semiautomated software for high-resolution single-particle reconstructions. J Struct Biol. 1999;128:82–97. doi: 10.1006/jsbi.1999.4174. [DOI] [PubMed] [Google Scholar]
- 16.Chen DH, Song JL, Chuang DT, Chiu W, Ludtke SJ. An expanded conformation of single-ring GroEL-GroES complex encapsulates an 86 kDa substrate. Structure. 2006;11:1711–1722. doi: 10.1016/j.str.2006.09.010. [DOI] [PubMed] [Google Scholar]
- 17.Orlova EV, Sherman MB, Chiu W, Mowri H, Smith LC, Gotto AM., Jr Three-dimensional structure of low density lipoproteins by electron cryomicroscopy. Proc Natl Acad Sci U S A. 1999;96:8420–8425. doi: 10.1073/pnas.96.15.8420. [DOI] [PMC free article] [PubMed] [Google Scholar]
- 18.Massey JB, Hickson D, She HS, Sparrow JT, Via DP, Gotto AM, Jr, Pownall HJ. Measurement and prediction of the rates of spontaneous transfer of phospholipids between plasma lipoproteins. Biochim Biophys Acta. 1984;794:274–280. doi: 10.1016/0005-2760(84)90156-5. [DOI] [PubMed] [Google Scholar]
- 19.Pownall HJ, Hickson DL, Smith LC. Transport of biological lipophiles: Effect of lipophile structure. J Amer Chem Soc. 1983;105:2440–2445. [Google Scholar]
- 20.Lusa S, Jauhiainen M, Metso J, Somerharju P, Ehnholm C. The mechanism of human plasma phospholipid transfer protein-induced enlargement of high-density lipoprotein particles: evidence for particle fusion. Biochem J. 1996;313 (Pt 1):275–282. doi: 10.1042/bj3130275. [DOI] [PMC free article] [PubMed] [Google Scholar]
- 21.Silver ET, Scraba DG, Ryan RO. Lipid transfer particle-induced transformation of human high density lipoprotein into apolipoprotein A-I-deficient low density particles. J Biol Chem. 1990;265:22487–22492. [PubMed] [Google Scholar]
- 22.Liang HQ, Rye KA, Barter PJ. Remodelling of reconstituted high density lipoproteins by lecithin: cholesterol acyltransferase. J Lipid Res. 1996;37:1962–1970. [PubMed] [Google Scholar]
- 23.Rye KA, Hime NJ, Barter PJ. Evidence that cholesteryl ester transfer protein-mediated reductions in reconstituted high density lipoprotein size involve particle fusion. J Biol Chem. 1997;272:3953–3960. doi: 10.1074/jbc.272.7.3953. [DOI] [PubMed] [Google Scholar]
- 24.Curtiss LK, Valenta DT, Hime NJ, Rye KA. What is so special about apolipoprotein AI in reverse cholesterol transport? Arterioscler Thromb Vasc Biol. 2006;26:12–19. doi: 10.1161/01.ATV.0000194291.94269.5a. [DOI] [PubMed] [Google Scholar]
- 25.Gursky O. Apolipoprotein structure and dynamics. Curr Opin Lipidol. 2005;16:287–294. doi: 10.1097/01.mol.0000169348.61191.ac. [DOI] [PubMed] [Google Scholar]
- 26.Tanford C. The Hydrophobic Effect: Formation of Micelles and Biological Membranes. 2. Wiley-Interscience; New York: 1980. [Google Scholar]
- 27.Pownall HJ, Ehnholm C. The unique role of apolipoprotein A-I in HDL remodeling and metabolism. Curr Opin Lipidol. 2006;17:209–213. doi: 10.1097/01.mol.0000226110.66942.e8. [DOI] [PubMed] [Google Scholar]