

Summary
Purpose
Functional magnetic resonance imaging (fMRI) was used to identify areas of brain activation during absence seizures in an awake animal model.
Methods
Blood-oxygenation-level–dependent (BOLD) fMRI in the brain was measured by using T2*-weighted echo planar imaging at 4.7 Tesla. BOLD imaging was performed before, during, and after absence seizure induction by using γ-butyrolactone (GBL; 200 mg/kg, intraperitoneal).
Results
The corticothalamic circuitry, critical for spike–wave discharge (SWD) formation in absence seizure, showed robust BOLD signal changes after GBL administration, consistent with EEG recordings in the same animals. Predominantly positive BOLD changes occurred in the thalamus. Sensory and parietal cortices showed mixed positive and negative BOLD changes, whereas temporal and motor cortices showed only negative BOLD changes.
Conclusions
With the BOLD fMRI technique, we demonstrated signal changes in brain areas that have been shown, with electrophysiology experiments, to be important for generating and maintaining the SWDs that characterize absence seizures. These results corroborate previous findings from lesion and electrophysiological experiments and show the technical feasibility of noninvasively imaging absence seizures in fully conscious rodents.
Keywords: Absence seizure, fMRI, Epilepsy, Imaging, GHB
Typical absence seizures consist of multiple, brief (≤20 s) impairments of consciousness with characteristic bilaterally synchronous 3-Hz spike–wave discharges (SWDs) on electroencephalography (EEG). A typical absence seizure is manifested behaviorally as a “staring spell” and can be accompanied by atonic postures such as drooping of the head and/or automatisms such as lip smacking. The incidence of absence seizures in the United States is 1.9 to 8 per 100,000, usually occurring in children between the ages of 4 years and adolescence, with girls affected twice as often as boys (1).
Early studies on cats showed that electrical stimulation to the midline and intralaminar nuclei of the thalamus at a frequency of 3 Hz produced SWDs on EEG (2). This finding was corroborated after the discovery of identical 3-Hz SWDs in children with deep recording electrodes in the thalamus (3). These early seminal studies pointed to the thalamus as the initiation site of SWDs, and recent work with rodent models has shown that corticothalamic interactions are involved in the pathogenesis of absence seizures.
γ-Hydroxybutyric acid (GHB) is a naturally occurring metabolite of the inhibitory neurotransmitter γ-aminobutyric acid (GABA). Normal rats given an intraperitoneal (i.p.) injection of GHB will show all the behavioral and electrophysiological signs of generalized absence seizure (4). Synchronized bursting activity from recording electrodes in the somatosensory ventrobasal thalamic areas (i.e., ventral posteromedial thalamus and ventral posterolateral thalamus), reticular thalamic nucleus, and frontoparietal cortex has been demonstrated in rats treated with GHB (5). With the Genetic Absence Epilepsy Rats from Strasbourg (GAERS), it has been reported that the generation of SWDs was associated with concurrent multiunit activity in the ventral posteromedial and ventral posterolateral thalamus, layers IV/V of the somatosensory cortex, and the reticular thalamic nucleus (6). The onset of SWDs correlated with activity in somatosensory cortex followed by burst-like, rhythmic firing in thalamic nuclei. Lesioning the reticular thalamic nucleus in the GAERS abolishes SWDs, underscoring the significance of this subcortical site in the pathogenesis of absence seizures (7). Indeed, the reticular thalamic nucleus has a high density of GABAergic neurons, the connections of which to other thalamic areas are critical in organizing the rhythmic bursting pattern characteristic of SWDs (8).
The genetic WAG/Rij rat model of absence seizure has been used to study the coordinated electrical field activity between thalamic and cortical sites with multielectrode recordings (9). Spontaneous SWDs were associated first with activity in the perioral region of the somatosensory cortex followed by cortical propagation and then thalamic activation. This finding suggests that the somatosensory cortex may be the dominant factor initiating the oscillation between corticothalamic networks responsible for SWDs in absence seizures. These pharmacologic and electrophysiological studies in rodent models have helped identify key areas in the thalamus and cortex involved in absence seizures.
In recent years, functional magnetic resonance imaging (fMRI) has come to the forefront as a powerful tool in neuroscience for noninvasive imaging of brain function. Whereas many fMRI studies have been confined to awake humans and anesthetized animals, the technology has recently been developed for imaging fully conscious animals (10–17). The use of fMRI in rodent models may facilitate the visualization of other functional neuroanatomic circuits involved in generalized absence seizures outside the corticothalamic circuit.
Increased neuronal activity is accompanied by an increase in metabolism concomitant with changes in cerebral blood flow and blood volume to the area of elevated neural activity. Blood-oxygenation-level–dependent (BOLD) fMRI is a technique sensitive to the oxygenation status of hemoglobin (18–22). BOLD imaging has been widely used to map brain functions and has recently been shown to correlate with evoked potential measurements (23).
The present study was undertaken to examine the feasibility of using fMRI to study generalized absence seizure in rodent models. To this end, we chose to study the GHB model because it has a more predictable time course than either of the genetic GAERS or WAG/Rij models. With the genetic models, absence seizures are spontaneous, and their occurrence could not be readily predicted or coordinated with image acquisitions. Moreover, it was discovered that γ-butyrolactone (GBL), the precursor molecule to GHB, can induce absence seizure with better reproducibility, predictability, and rapidity of onset than GHB itself (24). Whereas it might take as much as 20 min after i.p. injection of GHB to induce absence seizures, GBL can produce bilaterally synchronous SWDs within 2–5 min of its peripheral administration, along with behavioral arrest, facial myoclonus, and vibrissal twitching (25). BOLD fMRI in the brain was measured by using T2*-weighted echo planar imaging at 4.7 Tesla. BOLD imaging was performed before, during, and after absence seizure induction with GBL. It was predicted that an increase in BOLD signal would be found in the ventral posteromedial and posterolateral thalamic nuclei, reticular thalamic nucleus, and somatosensory cortex.
Methods
Animals
Male Sprague–Dawley rats weighing 200–300 g were obtained from Charles River Laboratories (Charles River, MA, U.S.A.). Animals were housed in pairs in Plexiglas cages (48 × 24 × 20 cm), maintained on 12:12 light/dark cycle (lights on at 9:00 h), and provided food and water ad libitum. All animals were acquired and cared for in accordance with the guidelines published in the Guide for the Care and Use of Laboratory Animals (National Institutes of Health Publications No. 85-23, Revised 1985).
Bench-top studies
Before imaging, bench-top studies were run to characterize the dose–response effect of GBL on generalized absence seizures in both freely moving and restrained rats. Twelve rats were initially anesthetized with 2 mg ketamine (Ketaset; Fort Dodge Animal Health, Fort Dodge, IA, U.S.A.) and 0.02 mg medetomidine (Domitor; Pfizer Animal Health, New York, NY, U.S.A.). Epidural cortical electrodes were secured in the skull and connected to an EEG recorder by using the Biopac system (BIOPAC Systems Inc., Goleta, CA, U.S.A.). Animals were injected with 0.1 mg atipamezole (Antiseden; Pfizer Animal Health) to reverse the anesthesia and placed into an observation cage. EEG recordings were collected continuously from freely moving animals over a 30-min test period during which four groups of three animals each were injected i.p. with GBL in doses of 50, 100, 200, or 400 mg/kg. Motor behavior was videotaped over the 30-min test period. The latency, pattern, and duration of SWDs, and alterations in motor activity were measured for each dose to assess the reliability and reproducibility of GBL-induced seizures. GBL at 200 mg/kg was determined to be the lowest, most effective dose. All three animals treated with this dose showed onset of absence seizure within 4 min of injection, which persisted for over a period of 90 min. The absence seizure was characterized by arrest of motor activity, vibrissal twitching, mild orofacial myoclonus, and impaired responsiveness concomitant with robust SWDs of ∼6–7 Hz with amplitudes of 200–250 μV. These behavioral and EEG data after i.p. GBL in this dose range, in freely moving rats, agrees with previously published studies (26).
After this dose–response study, three rats were observed for the seizure-inducing effects of the 200-mg/kg i.p. dose of GBL while secured in the restraining device used for functional imaging studies. These bench-top studies were important to test whether the stress of immobilization associated with imaging might alter the onset, time course, or EEG characteristics of GBL-induced seizure. The animal restrainer used for imaging consisted of a multicon-centric Plexiglas head and body holder with built-in radiofrequency dual coil electronics (Insight Neuroimaging Systems, LLC, Worcester, MA, U.S.A.). Animals were anesthetized with Domitor, fixed with epidural EEG electrodes, secured in the restrainer, and awakened with Antiseden. There were no differences in the onset, pattern, and duration of GBL-induced SWDs between freely moving and restrained animals.
Imaging studies
Eight rats were anesthetized with Domitor, fixed with MR-compatible nonmagnetic epidural EEG electrodes, and implanted with an i.p. line for GBL injection. Animals were secured in the restrainer, awakened with Antiseden, and imaged 30 min later. All images were acquired by using a 4.7-T/40-cm (Oxford Magnet Technology, Oxford, U.K.) horizontal magnet interfaced to a Paravision console (Bruker Medical Instruments, Billerica, MA, U.S.A.). High-resolution anatomic data sets were acquired by using a fast spin-echo (RARE) sequence (TR = 2.5 s; TE = 56 ms; echo train length = 8; field of view = 3 × 3 cm; data matrix = 256 × 256; number of slices = 4; slice thickness = 1.0 mm) at the end of each imaging session. Functional images were acquired by using a two-segment gradient-echo planar imaging (EPI) sequence (TR = 1,000 ms; TE = 25 ms; FOV = 3 × 3 cm; matrix = 128 × 128; number of slices = 4; slice thickness = 1.0 mm).
EEG was recorded by using nonmagnetic epidural electrodes while the animal was in the magnet. The EEG signal was amplified inside the radiofrequency (RF)-shielded room by using a battery-operated preamplifier and converted to a fiberoptic signal. This signal was passed outside the RF-shielded room and was converted back to an electrical signal before recording with MP100 hardware and analysis with MP100 Manager Software (BIOPAC Systems Inc., Goleta, CA, USA). Similar setups have previously been used in human imaging experiments (27).
Functional imaging followed the experimental paradigm shown in Fig. 1. A baseline set of images was acquired for 3 min, followed by an i.p. injection of 0.9% saline. EEG recordings were done for 2 min, followed by image acquisition for 2 min. EEG was again recorded for 1 min, followed by another image acquisition of 2 min. GBL was then administered, and EEG was recorded for 2 min before starting image acquisition for 2 min. Scans were repeated 4 more times with wait times in between of 1 min, 1 min, 10 min, and 30 min, respectively.
FIG. 1.
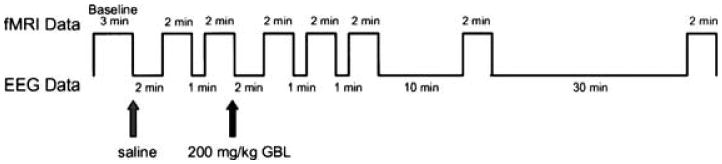
Experimental design used for functional imaging experiments. EEG data are collected during breaks in imaging because of the distortion caused by functional magnetic resonance imaging acquisition.
Cortical and thalamic regions of interest (ROIs) were drawn manually on the images according to a rat brain atlas and analyzed for changes in BOLD signal intensity (28). STIMULATE software was used to perform statistical comparisons of control periods with absence seizure periods with Student's paired t test to generate an activation map of the ROIs for each dataset (29). The control imaging period was defined as the average value of the baseline data collected in the initial 3 min of the experiment. The absence seizure imaging period was defined as the average value of the time from the injection of GBL to the end of the experiment. The comparison for the t tests, used to create activation maps, was the average of the baseline period and the average of the absence seizure period.
ROI analyses to calculate BOLD signal values and time course plots were based on the signal values averaged across the voxels in each respective region. These values were then averaged across all animals. Voxels whose BOLD percentage change, relative to the control period, was significant at a 95% confidence level were overlaid onto their respective anatomic data set. Activation maps are representative examples from one animal that have not been corrected for multiple comparisons.
Anesthetized versus awake imaging studies
Given the robust nature of the thalamocortical network in the initiation and maintenance of SWDs, we tested if it was possible to image changes in BOLD signal intensity in anesthetized animals treated with GBL. Three additional animals, under continuous 2% isoflurane anesthesia (Abbott Laboratories, Chicago, IL, U.S.A.), were given 200 mg/kg GBL, i.p., and imaged for changes in BOLD signal. Figure 2 shows activation maps comparing changes in BOLD signal intensity in response to GBL with and without anesthesia. Although SWDs were seen in both awake and anesthetized animals, isoflurane dramatically reduced BOLD signal changes, precluding the use of this anesthetic in fMRI studies of GBL-induced seizures. This observation is consistent with the notion that anesthetics in general suppress synaptic activity (30–34); therefore all subsequent experiments were done on awake animals.
FIG. 2.
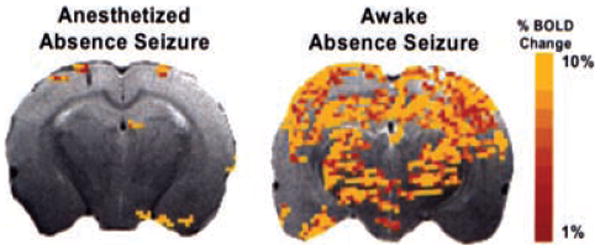
Functional magnetic resonance imaging of drug-induced absence seizure in anesthetized versus conscious rats. Left: Positive blood-oxygenation-level–dependent (BOLD) signal changes in an animal experiencing an absence seizure while continuously anesthetized with 2% isoflurane. Right: BOLD signal change in an animal experiencing an absence seizure, not anesthetized. The colored pixels indicate the statistically significant (p < 0.05) pixels determined by t test analysis and overlaid onto the corresponding anatomy (fast spin echo sequence). EPI image parameters were TR = 1,000 ms; TE = 25 ms; FOV = 3 × 3 cm; matrix = 128 × 128; slice thickness = 1.0 mm; and anatomic image parameters were TR = 2.5 s; TE = 56 ms; echo train length 8; FOV = 3 × 3 cm; data matrix = 256 × 256; slice thickness = 1.0 mm. This is a representative figure from a study with three animals.
Results
Over the course of each imaging session, EEG recordings were obtained between image acquisitions at the intervals noted in Fig. 1. Each of the eight animals studied showed GBL-induced bilateral SWDs, characteristic of absence seizures. A representative EEG tracing is shown in Fig. 3. No EEG changes were seen at any time after the control injection of saline.
FIG. 3.
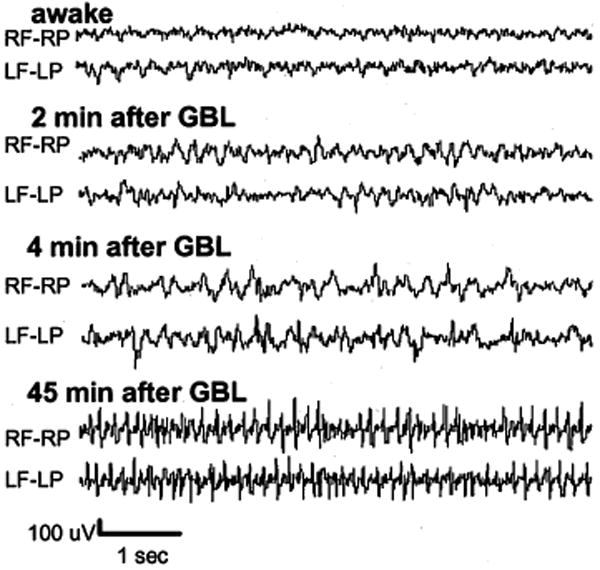
EEG recording collected during the functional magnetic resonance imaging experiment. Nonmagnetic epidural electrodes were placed in the frontal and parietal cortices to monitor seizure activity during the imaging session. Placement of electrode leads is labeled. RF, right frontal cortex; RP, right parietal cortex; LF, left frontal cortex; LP, left parietal cortex.
Injection of GBL caused robust changes in BOLD signal intensity in the corticothalamic circuit. Representative activation maps of two consecutive brain slices together with delineations of representative thalamic and cortical ROIs are shown in Fig. 4. The thalamic ROIs have an increase in the number of voxels with positive BOLD signal, but few thalamic areas had negative BOLD signal in response to GBL. This is in sharp contrast to cortical ROIs, which showed a preponderance of negative BOLD voxels during absence seizure. In addition, the sensory and parietal cortices have an increased number of voxels with positive BOLD signal.
FIG. 4.
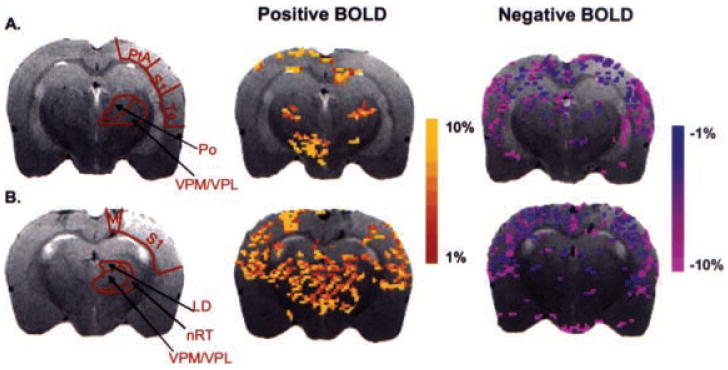
Activation maps of positive and negative blood-oxygenation-level–dependent (BOLD) signal responses during absence seizure. The colored pixels indicate the statistically significant (p < 0.05) pixels determined by t test analysis and overlaid onto the corresponding anatomy (fast spin echo sequence). A, B: BOLD activation maps for two consecutive slices through the brain. EPI image parameters were TR = 1,000 ms; TE = 25 ms; FOV = 3 × 3 cm; matrix = 128 × 128; slice thickness = 1.0 mm; and anatomic image parameters were TR = 2.5 s; TE = 56 ms; echo train length = 8; FOV = 3 × 3 cm; data matrix = 256 × 256; slice thickness = 1.0 mm. LD, laterodorsal thalamic nuclei; M, motor cortex; nRT, nucleus reticularis thalami; Po, posterior thalamic nuclear group; PtA, parietal cortex; S1, sensory cortex; Te, temporal cortex; VPM/VPL, ventral posteromedial/posterolateral thalamic nucleus.
Table 1 reports the group-average percentage changes of positive and negative BOLD signal intensity for each of the ROIs (N = 8 rats). ROIs on the left and right sides were initially analyzed separately and found to have statistically significant activations above baseline. Because all structures analyzed are bilateral and no significant differences were found between the left and right hemispheres, each rat included in the Table 1 analysis consists of a combination of both hemispheres. This was done because generalized SWDs are believed to be bilaterally synchronous, and EEG showed SWDs in both hemispheres. In addition, for all significant positive BOLD changes, all eight animals experienced signal changes of ≥5%. All eight animals also experienced negative BOLD changes of ≤5% in the sensory and temporal cortices, whereas seven of eight animals had signal changes of ≤5% in the motor and parietal cortices.
TABLE 1. Percentage changes of positive and negative BOLD signals over time.
| Positive BOLD | Negative BOLD | |||
|---|---|---|---|---|
| ROI | Saline | GBL | Saline | GBL |
| Parietal cortex | 0.8 ± 0.3% | 16.3 ± 2.2%b | −1.8 ± 0.4% | −11.9 ± 1.9%a |
| Sensory cortex | 1.9 ± 0.6% | 16.6 ± 2.3%a | −2.2 ± 0.5% | −11.1 ± 1.0%a |
| Temporal cortex | 1.9 ± 0.7% | 3.8 ± 0.5% | −2.3 ± 0.3% | −14.6 ± 0.9%b |
| Motor cortex | 1.8 ± 0.5% | 3.9 ± 0.4% | −1.8 ± 0.3% | −11.6 ± 1.7%a |
| Ventral posteromedial/posterolateral thalamic nuclei | 1.2 ± 0.4% | 11.8 ± 1.8%a | −1.0 ± 0.3% | −1.7 ± 0.1% |
| Nucleus reticularis thalami | 2.3 ± 0.7% | 9.7 ± 0.8%a | −1.4 ± 0.3% | −1.8 ± 0.3% |
| Posterior thalamic nuclear group | 1.3 ± 0.4% | 11.3 ± 1.5%a | −1.4 ± 0.4% | −1.9 ± 0.4% |
| Laterodorsal nucleus | 1.3 ± 0.5% | 14.7 ± 1.7%b | −1.9 ± 0.4% | −1.8 ± 0.2% |
Values presented as mean ± SEM (N = 8 rats).
Regions that are significantly different from results obtained after the control saline injection are noted (ap < 0.01, bp < 0.001).
As can be seen in Table 1, significant negative BOLD decreases were found in all cortical regions analyzed. These results are based on the signal values averaged across the voxels in an ROI. Parietal and somatosensory cortices had negative BOLD changes of −12% and −11.1%, whereas the motor and temporal cortices had negative BOLD changes of −11.7% and −14.7%, respectively. The reticular thalamic nucleus (nRT) and laterodorsal thalamic nuclei (LD) showed average BOLD signal increases of 9.7% and 14.7% above baseline, respectively. Ventral posteromedial/posterolateral thalamic nuclei and the posterior thalamic nuclear group (VPM/VPL, Po) also showed increased positive BOLD changes of 11.8% and 11.4% above baseline, respectively. The somatosensory and parietal cortices had significant positive BOLD increases of 16.7% and 16.4%, respectively. These results after GBL injection can be compared with those after the control injection of saline, in which comparatively minor activations of <2.5% occurred.
BOLD signal time courses for each cortical ROI are plotted in Fig. 5. These percentage-change plots were constructed by averaging the values for the bilateral ROIs at each time point, for all eight rats. After GBL injection, but before the onset of SWDs and absence seizure, the sensory cortex showed an increase in BOLD signal of ∼10%. However, during absence seizure, only a modest increase in BOLD signal intensity was seen above preseizure levels. The parietal cortex showed a post-GBL, preseizure increase in BOLD signal of 10%, followed by a gradual increase in BOLD signal to ∼20% during seizure. All cortical ROIs demonstrated an increase in negative BOLD signal, which appeared to correlate with the absence seizure and decreased over the remainder of the study.
FIG. 5.
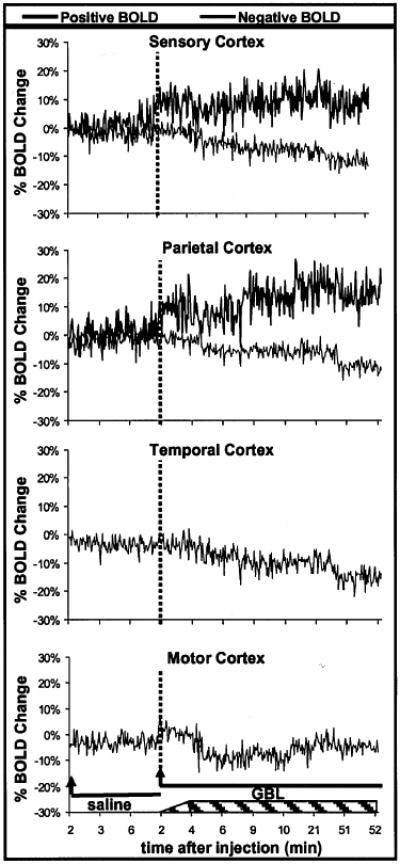
Change in blood-oxygenation-level–dependent (BOLD) signal intensity over time for each region of interest in the cortex. Temporal and motor cortices showed no significant positive BOLD changes. These plots were created by averaging the value for each animal at each time point. Each image acquisition was 2 s. Arrow, the start of imaging, 2 min after injection; solid lines, images acquired during periods after either saline or γ-butyrolactone (GBL) injections; dashed lines, the start of imaging, 2 min after the injection of GBL; hatched box at the bottom of the graph, spike–wave discharges began to form sometime between 2 and 4 min after GBL injection and lasted until the end of the imaging experiment.
The percentage change in BOLD signal intensity in the thalamus, after GBL injection, appears to have a biphasic “step-up” pattern (Fig. 6). This is an artifact of the experimental design and reflects stoppage of fMRI data acquisition for collection of EEG data (see Fig. 1). EEG data were collected for the first 2 min immediately after GBL injection. During this time, slight changes occurred in the EEG pattern, but no SWD formations for any of the eight animals studied (see Fig. 3 for representative recording). With the resumption of imaging, BOLD signal intensity was found to be ∼10% higher than the previous baseline taken before GBL injection. Four minutes after GBL injection, imaging was stopped again, and EEG data showed the appearance of SWDs. With the resumption of imaging, ∼5 min after GBL injection, BOLD signal changes were 10–20% higher than baseline. Over the experimental time course, no significant negative BOLD signal was seen in any of the thalamic ROIs.
FIG. 6.
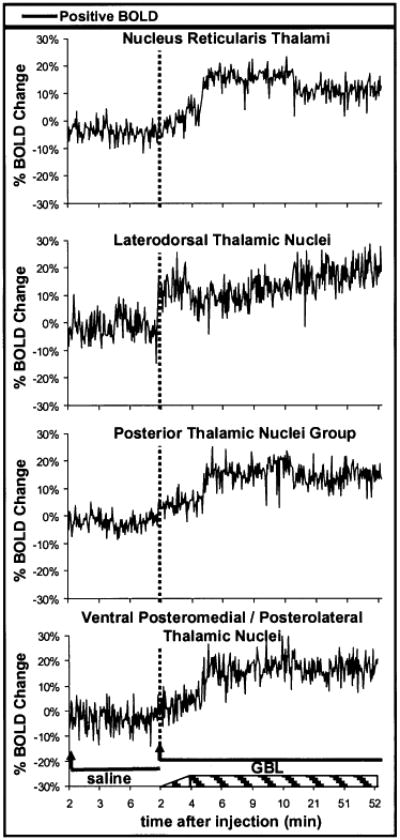
Change in blood-oxygenation-level–dependent (BOLD) signal intensity over time for each region of interest (ROI) in the thalamus. No significant negative BOLD changes occurred in any of the thalamic ROIs. These plots were created by averaging the value for each animal at each time point. Each image acquisition was 2 s. Arrow, the start of imaging, 2 min after injection; solid lines, images acquired during periods after either saline or γ-butyrolactone (GBL) injections; dashed lines, start of imaging, 2 min after the injection of GBL; hatched box at the bottom of the graph, spike–wave discharges began to form sometime between 2 and 4 min after GBL injection and lasted until the end of the imaging experiment.
Discussion
The data from this study, using fMRI to identify areas of brain activation during absence seizure, corroborate the findings from lesion and electrophysiological studies. The corticothalamic circuitry so critical for SWD formation shows robust changes in positive BOLD signal correlated with EEG changes showing the initiation of seizure activity after administration of GBL. The escalation of BOLD signal in the thalamus and cortex probably reflects increased blood flow associated with onset and maintenance of SWDs in absence seizures. These findings support the use of fMRI to study absence seizures in this rodent model and show the technical feasibility of imaging absence seizures in fully conscious rodents with minimal motion artifact.
The a priori hypothesis predicted activation of those ventrobasal thalamic sites (e.g., the ventral posteromedial and ventral posterolateral nuclei) with direct efferent connections to the sensory cortex. Neurotoxic lesions have been used to identify several thalamic nuclei involved in the generation and maintenance of SWDs in the GBL rodent model (35). Bilateral lesions in the dorsal thalamic nuclei abolished SWDs from both the cortex and thalamus. In addition, ventral posterolateral thalamic lesions did not stop SWDs, but decreased their duration, whereas lesions in the reticular thalamic nucleus suppressed GBL-induced seizures. Data from the current study demonstrate that these thalamic areas plus the sensory and parietal cortices show robust increases in positive BOLD signal with GBL treatment.
The results of the current study demonstrate a predominantly positive BOLD signal change in the thalamus, likely reflecting an increase in neuronal activity associated with seizure. Interestingly, the sensory and parietal cortices presented a functional heterogeneity characterized by significant increases and decreases in BOLD signal. The sensory cortex, the primary afferent thalamic connection, shows the anticipated increase in BOLD with some adjacent areas, particularly along the superficial layers of the cortex, showing negative BOLD signal changes. Simultaneous positive and negative BOLD response in adjacent brain regions also were reported in humans during photic stimulus-triggered seizures (36). In contrast, the temporal and motor cortices showed only a significant negative BOLD signal change, most likely reflecting a decrease in neuronal activity. Before SWD formation, no changes were seen in negative BOLD. However, at the resumption of imaging 5 min after GBL injection and with the onset of absence seizure, a “step down” in negative BOLD signal continued to decrease over the remainder of the study. It is interesting that the motor cortex shows deactivation, because the seminal feature of the absence seizure is arrest of motor activity.
It is important when interpreting these results to choose an appropriate “control period” to use as a comparison. Because the control imaging period chosen in this study was the time before GBL injection and BOLD changes seem to occur before the formation of identifiable SWDs, it is possible that these signal increases result partly from an effect of the GBL, independent of seizure activity. It also is likely that seizure activity is occurring in subcortical structures or other areas not represented by the cortical EEG electrodes. If so, the results in Figs. 5 and 6 suggest that, in the GBL model, cortical activity is occurring before that in the thalamus. For this reason, the control imaging period used in this experiment was the time before GBL injection.
No published reports used BOLD fMRI to study absence seizure activity. However, several other imaging modalities have been used to observe changes in cerebral blood flow and metabolism during absence seizures. Glucose utilization has been measured with the [14C]deoxyglucose autoradiographic technique in rats given GBL, and dose-dependant decreases in glucose utilization were reported (37). Studies using positron emission tomography (PET) to measure cerebral glucose metabolism show global increases in activity during ictal periods, but limitations in temporal and spatial resolution preclude the identification of specific corticothalamic areas and their correlation with the generation of SWDs (38–40). Use of PET to follow changes in cerebral blood flow shows global increases in perfusion during absence seizures, with a higher focal increase in the thalamus, but again no clear delineation of corticothalamic structures or temporal correlation with EEG activity (41). Studies with single-photon emission computed tomography (SPECT) in children show a homogeneous, diffuse increase in cerebral blood flow during absence seizure activity, but no focal changes (42). Better spatial resolution was reported in a recent SPECT study with adult patients, showing an increased perfusion in the cortex, cerebellum, thalamus, and basal ganglia (43).
Doppler flow techniques, providing good temporal resolution, have been used to study blood-flow changes in superficial cortical areas during absence seizures. Doppler studies in humans show that mean blood flow velocity increases a few seconds before clinical or EEG evidence of seizure activity, with a peak value occurring 2–3 s after the start of clinical and EEG seizure activity (44). An abrupt decrease in blood-flow velocity starts during seizure activity and reaches a minimum value within 4–6 s after the end of the seizure. Doppler studies with children and a genetic rat model of absence epilepsy report decreases in cerebral blood flow during the seizure, which subsequently returns to baseline values with the cessation of seizure activity (45). The decrease in blood flow during absence seizure was interpreted as a reduction in metabolism after reduced synaptic and neuronal activity. These data are not unlike our observation in the GBL model, showing significant negative BOLD signal changes in the cortices, likely reflecting decreased cortical blood flow.
Similar corticothalamic activity has been demonstrated in humans and rat models of absence seizure, with fundamental differences. The data in this study are based on sustained spike-and-wave activity, whereas in humans, seizures of just several seconds occur. In addition, the GBL animal model produces SWDs with a frequency of 6–7 Hz, whereas human absence seizures are characteristically 3 Hz. fMRI studies of a primate model of SWDs are necessary to make a closer approximation of the human condition, because 3-Hz SWDs occur in this model.
In conclusion, with the BOLD fMRI technique, we demonstrated signal changes in brain areas that have previously been shown to be important for generating and maintaining the SWDs that characterize absence seizures. These aberrant rhythms that characterize all epilepsies result from abnormal synchronous firing of neurons within neural networks. Although these rhythms have been studied extensively on a cellular and electrophysiological level, we have shown that fMRI, in awake animals, can noninvasively provide a global view of structures composing the implicated networks, such as cortico–cortico and thalamo–cortico connections.
Acknowledgments
This work was supported by grants from the NIMH (R01-MH58700) and NINDS (F30-NS044672), and its contents are the sole responsibility of the authors and does not represent the official views of the NIH. We thank Mathew Brevard for his assistance with the EEG equipment and Dr. Qiang Shen for his help with software development for data analysis. We also thank Dr. John Ives for his assistance with the fMRI-compatible EEG equipment.
References
- 1.Panayiotopoulos CP. Absence epilepsies. In: Engel JJ, Pedley TA, editors. Epilepsy: a comprehensive textbook. Philadelphia: Lippincott-Raven; 1997. pp. 2327–46. [Google Scholar]
- 2.Jasper HH, Droogleever-Fortuynn J. Experimental studies on the functional anatomy of petit epilepsy. Res Publ Assoc Nerv Ment Dis. 1947;26:272–98. [Google Scholar]
- 3.Williams D. A study of thalamic and cortical rhythms in petit mal. Brain. 1953;76:50–69. doi: 10.1093/brain/76.1.50. [DOI] [PubMed] [Google Scholar]
- 4.Snead OC. Basic mechanisms of generalized absence seizures. Ann Neurol. 1995;37:146–57. doi: 10.1002/ana.410370204. [DOI] [PubMed] [Google Scholar]
- 5.Banerjee PK, Snead OC. Presynaptic gamma-hydroxybutyric acid (GHB) and gamma-aminobutyric acid (GABAB) receptor-mediated release of GABA and glutamate (GLU) in rat ventrobasal nucleus (VB): a possible mechanism for the generation of absence-like seizures induced by GHB. J Pharmacol Exp Ther. 1995;273:1534–43. [PubMed] [Google Scholar]
- 6.Seidenbecher T, Staak R, Pape HC. Relations between cortical and thalamic cellular activities during absence seizures in rats. Eur J Neurosci. 1998;10:1103–12. doi: 10.1046/j.1460-9568.1998.00123.x. [DOI] [PubMed] [Google Scholar]
- 7.Avanzini G, Vergnes M, Spreafico R, et al. Calcium-dependent regulation of genetically determined spike and waves by the RTN of rats. Epilepsia. 1993;34:1–7. doi: 10.1111/j.1528-1157.1993.tb02369.x. [DOI] [PubMed] [Google Scholar]
- 8.Avanzini G, Panzica F, de Curtis M. The role of the thalamus in vigilance and epileptogenic mechanisms. Clin Neurophysiol. 2000;111 2:S19–26. doi: 10.1016/s1388-2457(00)00398-9. [DOI] [PubMed] [Google Scholar]
- 9.Meeren H, Pijn J, Luijtelaar E, et al. Cortical focus drives widespread corticothalamic networks during spontaneous absence seizures in rats. J Neurosci. 2002;22:1480–95. doi: 10.1523/JNEUROSCI.22-04-01480.2002. [DOI] [PMC free article] [PubMed] [Google Scholar]
- 10.Dubowitz DJ, Chen DY, Atkinson DJ, et al. Functional magnetic resonance imaging in macaque cortex. Neuroreport. 1998;9:2213–8. doi: 10.1097/00001756-199807130-00012. [DOI] [PubMed] [Google Scholar]
- 11.Dubowitz DJ, Chen DY, Atkinson DJ, et al. Direct comparison of visual cortex in human and non-human primates using functional magnetic resonance imaging. J Neurosci Methods. 2001;107:71–80. doi: 10.1016/s0165-0270(01)00353-3. [DOI] [PubMed] [Google Scholar]
- 12.Ferris CF, Snowden CT, King JA, et al. Functional imaging of brain activity in conscious monkeys responding to sexually arousing cues. Neuroreport. 2001;12:2231–6. doi: 10.1097/00001756-200107200-00037. [DOI] [PubMed] [Google Scholar]
- 13.Stefanacci L, Reber P, Costanza J, et al. FMRI of monkey visual cortex. Neuron. 1998;20:1051–7. doi: 10.1016/s0896-6273(00)80485-7. [DOI] [PubMed] [Google Scholar]
- 14.Logothetis NK, Guggenberger H, Peled S, et al. Functional imaging of the monkey brain. Nat Neurosci. 1999;2:555–62. doi: 10.1038/9210. [DOI] [PubMed] [Google Scholar]
- 15.Lahti KM, Ferris CF, Li F, et al. Imaging brain activity in conscious animals using functional MRI. J Neurosci Methods. 1998;82:75–82. doi: 10.1016/s0165-0270(98)00037-5. [DOI] [PubMed] [Google Scholar]
- 16.Zhang Z, Andersen AH, Avison MJ, et al. Functional MRI of apomorphine activation of the basal ganglia in awake rhesus monkeys. Brain Res. 2000;852:290–6. doi: 10.1016/s0006-8993(99)02243-x. [DOI] [PubMed] [Google Scholar]
- 17.Zhang Z, Andersen AH, Grodin R, et al. Pharmacological MRI mapping of age-associated changes in basal ganglia circuitry of awake rhesus monkeys. Neuroimage. 2001;14:1159–67. doi: 10.1006/nimg.2001.0902. [DOI] [PubMed] [Google Scholar]
- 18.Ogawa S, Lee TM, Nayak AS, et al. Oxygenation-sensitive contrast in magnetic resonance image of rodent brain at high magnetic fields. Magn Reson Med. 1990;14:68–78. doi: 10.1002/mrm.1910140108. [DOI] [PubMed] [Google Scholar]
- 19.Ogawa S, Tank DW, Menon R, et al. Intrinsic signal changes accompanying sensory stimulation: functional brain mapping with magnetic resonance imaging. Proc Natl Acad Sci U S A. 1992;89:5951–5. doi: 10.1073/pnas.89.13.5951. [DOI] [PMC free article] [PubMed] [Google Scholar]
- 20.Ogawa S, Menon RS, Tank DW, et al. Functional brain mapping by blood oxygenation level-dependent contrast magnetic resonance imaging. Biophys J. 1993;64:803–12. doi: 10.1016/S0006-3495(93)81441-3. [DOI] [PMC free article] [PubMed] [Google Scholar]
- 21.Kwong KK, Belliveau JW, Chesler DA, et al. Dynamic magnetic resonance imaging of human brain activity during primary sensory stimulation. Proc Natl Acad Sci U S A. 1992;89:5675–9. doi: 10.1073/pnas.89.12.5675. [DOI] [PMC free article] [PubMed] [Google Scholar]
- 22.Bandettini PA, Wong EC, Hinks RS, et al. Time course EPI of human brain function during task activation. Magn Reson Med. 1992;25:390–7. doi: 10.1002/mrm.1910250220. [DOI] [PubMed] [Google Scholar]
- 23.Logothetis NK, Pauls J, Augath M, et al. Neurophysiological investigation of the basis of the fMRI signal. Nature. 2001;412:150–7. doi: 10.1038/35084005. [DOI] [PubMed] [Google Scholar]
- 24.Bearden LJ, Snead OC, Healy CT, et al. Antagonism of gamma-hydroxybutyrate induced frequency shifts in the cortical EEG of rats by dipropylacetate. Electroencephalogr Clin Neurophysiol. 1980;49:181–3. doi: 10.1016/0013-4694(80)90365-x. [DOI] [PubMed] [Google Scholar]
- 25.Snead OC, Depaulis A, Vergnes M, et al. Absence epilepsy: advances in experimental animal models. Adv Neurol. 1999;79:253–78. [PubMed] [Google Scholar]
- 26.Snead OC. Gamma-hydroxybutyrate model of generalized absence seizures: further characterization and comparison with other absence models. Epilepsia. 1988;29:361–8. doi: 10.1111/j.1528-1157.1988.tb03732.x. [DOI] [PubMed] [Google Scholar]
- 27.Ives JR, Warach S, Schmitt F, et al. Monitoring the patient's EEG during echo planar MRI. Electroencephalogr Clin Neurophysiol. 1993;87:417–20. doi: 10.1016/0013-4694(93)90156-p. [DOI] [PubMed] [Google Scholar]
- 28.Paxinos G, Watson C. The rat brain in stereotaxic coordinates. San Diego: Academic Press; 1998. [Google Scholar]
- 29.Strupp JP. Stimulate: a GUI based fMRI analysis software package. Neuroimage. 1996;3:S607. [Google Scholar]
- 30.el-Beheiry H, Puil E. Anaesthetic depression of excitatory synaptic transmission in neocortex. Exp Brain Res. 1989;77:87–93. doi: 10.1007/BF00250570. [DOI] [PubMed] [Google Scholar]
- 31.Richards CD. On the mechanism of barbiturate anesthesia. J Physiol. 1972;227:749–67. doi: 10.1113/jphysiol.1972.sp010057. [DOI] [PMC free article] [PubMed] [Google Scholar]
- 32.Richards CD. On the mechanism of halothane anesthesia. J Physiol. 1973;233:439–56. doi: 10.1113/jphysiol.1973.sp010316. [DOI] [PMC free article] [PubMed] [Google Scholar]
- 33.Richards CD, Strupinski K. An analysis of the action of pentobarbitone on the excitatory post-synaptic potentials and membrane properties of neurons in the guinea-pig olfactory cortex. Br J Pharmacol. 1986;89:321–5. doi: 10.1111/j.1476-5381.1986.tb10263.x. [DOI] [PMC free article] [PubMed] [Google Scholar]
- 34.Richards CD, White AE. The actions of volatile anesthetics on synaptic transmission in the dentate gyrus. J Physiol. 1975;252:241–57. doi: 10.1113/jphysiol.1975.sp011142. [DOI] [PMC free article] [PubMed] [Google Scholar]
- 35.Banerjee PK, Snead OC. Thalamic mediodorsal and intralaminar nuclear lesions disrupt the generation of experimentally induced generalized absence-like seizures in rats. Epilepsy Res. 1994;17:193–205. doi: 10.1016/0920-1211(94)90050-7. [DOI] [PubMed] [Google Scholar]
- 36.Hill RA, Chiappa KH, Huang-Hellinger F, et al. Hemodynamic and metabolic aspects of photosensitive epilepsy revealed by functional magnetic resonance imaging and magnetic resonance spectroscopy. Epilepsia. 1999;40:912–20. doi: 10.1111/j.1528-1157.1999.tb00798.x. [DOI] [PubMed] [Google Scholar]
- 37.Wolfson LI, Sakurada O, Sokoloff L. Effects of γ-butyrolactone on local cerebral glucose utilization in the rat. J Neurochem. 1977;29:777–83. doi: 10.1111/j.1471-4159.1977.tb10718.x. [DOI] [PubMed] [Google Scholar]
- 38.Engel J, Lubens O, Kuhl DE, et al. Local cerebral metabolic rate for glucose during petit mal absences. Ann Neurol. 1985;17:121–8. doi: 10.1002/ana.410170204. [DOI] [PubMed] [Google Scholar]
- 39.Theodore WH, Brooks R, Margolin R, et al. Positron emission tomography in generalized seizures. Neurology. 1985;35:684–90. doi: 10.1212/wnl.35.5.684. [DOI] [PubMed] [Google Scholar]
- 40.Ochs RF, Gloor P, Tyler JL, et al. Effect of generalized spike-and-wave discharge on glucose metabolism measured by positron emission tomography. Ann Neurol. 1987;21:458–64. doi: 10.1002/ana.410210508. [DOI] [PubMed] [Google Scholar]
- 41.Prevett MC, Duncan JS, Jones T, et al. Demonstration of thalamic activation during typical absence seizures using H215O and PET. Neurology. 1995;45:1396–402. doi: 10.1212/wnl.45.7.1396. [DOI] [PubMed] [Google Scholar]
- 42.Yeni SN, Kabasakal L, Yalcinkaya C, et al. Ictal and interictal SPECT findings in childhood absence epilepsy. Seizure. 2000;9:265–9. doi: 10.1053/seiz.2000.0400. [DOI] [PubMed] [Google Scholar]
- 43.Iannetti P, Spalice A, De Luca F, et al. Ictal single photon emission computed tomography in absence seizures: apparent implication of different neuronal mechanisms. J Child Neurol. 2001;16:339–44. doi: 10.1177/088307380101600506. [DOI] [PubMed] [Google Scholar]
- 44.DeSimone R, Silvestrini M, Marciani MG, et al. Changes in cerebral blood flow velocities during childhood absence seizures. Pediatr Neurol. 1998;18:132–5. doi: 10.1016/s0887-8994(97)00165-3. [DOI] [PubMed] [Google Scholar]
- 45.Nehlig A, Vergnes M, Waydelich R, et al. Absence seizures induce a decrease in cerebral blood flow: human and animal data. J Cereb Blood Flow Metab. 1996;16:147–55. doi: 10.1097/00004647-199601000-00017. [DOI] [PubMed] [Google Scholar]