

Abstract
Functional magnetic resonance imaging (fMRI) in conscious animals is evolving as a critical tool for neuroscientists. The present study explored the effectiveness of an acclimation procedure in minimizing the stress experienced by the animal as assessed by alterations in physiological parameters including heart rate, respiratory rate, and serum corticosterone levels. Results confirm that as the stress of the protocol is minimized, there is a significant decrease in head movements and enhancement in data quality. The feasibility of improving the quality of fMRI data acquired in alert rats by utilizing a relatively simple technique is presented.
Keywords: Restraint stress, Heart rate, Imaging, Blood pressure, HPA axis, fMRI
1. Introduction
Functional magnetic resonance imaging (fMRI) is a non-invasive procedure for studying the localization of brain activity (Bandettini and Wong, 1997; Ogawa et al., 1992). This procedure has greater spatial and temporal resolution than positron emission tomography and single photon emission computerized tomography and is much more convenient and safer because it does not require the production and use of ionizing radiation. With this non-invasive technology specific neuronal functions of the brain can be mapped reliably in terms of localization, organization, and operation in humans and animals (Bandettini and Wong, 1997; Ogawa et al., 1992).
Most fMRI studies in animals are done under general anesthesia to minimize motion artifact and to simulate the absence of stress (Duong et al., 2000; Sicard et al., 2003). Unfortunately, the use of anesthesia limits the full potential of fMRI in behavioral and cognitive neuroscience. Not only does anesthesia preclude the study of brain activity associated with emotion and cognition, but use of general anesthetics diminish neuronal metabolism and cerebral blood flow (Sicard et al., 2003; Lahti et al., 1999; Brammer et al., 1993; Fox and Raichle, 1986) affecting BOLD (blood-oxygenation-level-dependent) signal intensity (Sicard et al., 2003; Lahti et al., 1999; Fox and Raichle, 1986). The conditions faced by human and animal subjects during an imaging session (e.g., enclosed space, restraint, long imaging time, and loud noise), can be challenging. In human studies, researchers have diligently evaluated interventions to reduce the discomfort of the scanning procedure by providing information about the protocol, prior exposure to the room, and to the tape-recorded scanner noises produced by pulsing of the magnetic field gradients (Grey et al., 2002; Hollenhorst et al., 2001; Lukins et al., 1997). These studies in humans systematically evaluated and reported a reduction in MR-imaging-related anxiety and facilitated improved MR data quality. Similar imaging approaches for non-human primates have involved lengthy training sessions and the construction of various MRI compatible systems built for ergonomic stimulus delivery with adequate restraint (Zhang et al., 2000; Dubowitz et al., 2001). In order to do similar studies on cognition and emotion in rats, the present studies were designed to determine whether conscious rats can acclimate to the imaging session such that a reduction in fMRI-related anxiety and improved data quality can be demonstrated. Acclimation was assessed by measuring changes over time in several physiological parameters including heart rate, respiratory rate, and blood levels of the stress hormone, corticosterone. In addition, using the BOLD technique prior to, and following acclimation, the impact on data clarity due to decreases in physiological noise (from head motion, respiratory alterations, and cardiac changes) was assessed by monitoring head movements throughout the scan period and contrast-to-noise ratios in response to carbon dioxide challenge.
2. Experimental methods
2.1. Animals
Male Sprague–Dawley (SD) rats were obtained from Harlan Sprague–Dawley Laboratories (Indianapolis, IN). Animals were housed in Plexiglas cages (two to a cage) and maintained in ambient temperature (22–24 °C) on a 12-h light:12-h dark schedule (lights on at 09:00 h). Food and water were provided ad libitum. All animals were acquired and cared for in accordance with the guidelines published in the NIH Guide for the Care and Use of Laboratory Animals (#80–23, Revised 1996). These studies were approved by the IACUC Committee of the University of Massachusetts Medical School.
2.2. Acclimation procedure
Acclimation experiments were performed 90 min per session on days 1–8 at the same time of day (09:00–11:00 h) to minimize the influence of circadian rhythm. Sprague–Dawley males (n = 8) were followed for all physiological and corti-costerone measurements throughout the acclimation period (reported below). Acclimation sessions on days 1 and 5 were performed in the magnet (see MRI methods below). On days 2–4, and 6–8, the acclimation procedure was performed in “mock scanner.”
Briefly, animals were lightly anesthetized with a combination of ketamine (10 mg/kg IP) and Domitor (medetomidine HCL; Pfizer, CT) (1 mg/kg IM) before being secured in a dual coil rodent restrainer developed for fMRI (Insight Neuroimaging Systems LLC, Worcester, MA). A plastic semicircular headpiece with blunted ear supports that fit into the ear canals was positioned over the ears. Lidocaine paste (2%) was added to points of mechanical restraint, e.g., bridge of the nose and ear canals to minimize any pain or discomfort during the study. The head was placed into the cylindrical head holder with the animals' incisors secured over a bite bar and ears positioned inside the head holder. The body of the animal was placed in a custom-fitted cylindrical body tube. The body restrainer isolates all of the body movement from the head restrainer and minimizes motion artifact (Lahti et al., 1998, 1999) while allowing for unrestricted respiration. After the animal was secured, it was administered Antisedan (atipamizole HCL; Pfizer CT) (5 mg/kg IM) to reverse the anesthesia. Following anesthesia reversal, rats restrained in the head holder and body tube were placed in a black opaque tube “mock scanner” with a tape-recording of scanner noises. Scanner noises were identical to the precise imaging protocol to which rats would later be exposed during the experimental imaging protocol.
2.3. Physiological monitoring
After restraining the animal, the respiratory rate and heart rate were obtained on days 1, 3, 5, and 8 of the acclimation period. The physiological monitoring unit consisted of nonmetallic sensors that were electronically compatible for use within the environment of the MR spectrometer. A Biopac thoracic force transducer was used for recording respiration and body movements. These components were integrated into a Biopac MP100 Analog to Digital converter with amplifiers that interfaced with a Dell Optiplex GMXT 5133 PC computer.
2.4. Determination of corticosterone levels
Blood was collected for baseline determinations and on days 1, 3, 5, and 8 post-acclimation. Briefly, blood was obtained (immediately after the 90 min acclimation period) via eye bleed with rapid inhalation CO2 for approximately 60 s (Airgas Inc., Radnor, PA). Blood was collected into a small plastic pipette (duration of entire procedure less than 120 s), at the same time of day. The samples were spun at 3500 RPM for 10 min and plasma was collected and stored in aliquot samples at −80 °C. Plasma corticosterone levels were determined with a RIA kit obtained from ICN Pharmaceutical (Costa Mesa, CA). The specificity of the corticosterone antiserum is 100% for corticosterone and less than 0.01% for estradiol, testosterone and androstenedione.
2.5. MR experiments
In another set of experiments, the roles of acclimation on MR parameters were examined in Sprague–Dawley males (n = 5). All MR experiments were performed on a 4.7-T/40-cm horizontal magnet (Oxford, UK) equipped with a Biospec Bruker console (Bruker, Germany), and a 20-G/cm magnetic field gradient insert (i.d. = 12 cm) capable of 120-μs rise time.
Animals were monitored and imaged during 1 h MR sessions. For cerebral blood flow (CBF) measurements, an actively decoupled surface coil (2.3 cm i.d.) was used for brain imaging and a neck coil (Duong et al., 2000; Sicard et al., 2003) for perfusion labeling. Coil-to-coil electromagnetic interaction was actively decoupled. Anatomical images were acquired using the fast spin-echo pulse sequence (RARE) with TR = 2500 ms (90° flip angle), eight echo trains, effective TE = 10 ms, matrix = 256 × 256, FOV = 2.56 cm × 2.56 cm, and eight 1.5-mm slices. Four transients were acquired for signal averaging. CBF measurements were made using the continuous arterial spin-labeling technique (Duong et al., 2000; Silva et al., 1997) with four-segmented gradient-echo, echo-planar-imaging (EPI) acquisition. Paired images were acquired alternately—one with arterial spin-labeling and the other without spin-labeling (control). The MR parameters were: data matrix = 128 × 128, FOV = 2.56 cm × 2.56 cm, and eight 1.5-mm slices, TE = 15 ms, and TR = 2 s (90° flip angle). Continuous arterial spin-labeling employed a 1.78 s square radio frequency pulse to the labeling coil in the presence of 1.0 G/cm gradient along the flow direction such that the condition of adiabatic inversion was satisfied (Detre et al., 1992). The sign of the frequency offset was switched for control (non-labeled) images. For each set of CBF measurement, 25 pairs of images (∼400 s) were acquired and the first two pairs were discarded and excluded from analysis.
For further assessment of other MRI parameters that may be affected by acclimation, we used male Sprague–Dawley rats (n = 4). An EPI functional scan was performed to determine the contrast-to-noise ratio. The MR parameters for EPI gradient-echo were: TR: 1000ms, TE: 28.0 m, six slices of 1.5 mm thickness, FOV: 9 mm, with matrix dimensions of 64 voxels × 64 voxels. For the baseline determinations (first 100 repetitions), the rats were allowed to inhale normal air. For the next 100 repetitions, the air was premixed with 5% CO2 (Airgas, Worcester, MA). At the end of the 100 repetitions, the CO2 was turned off and the animals were given 20 min to recover.
2.6. Data analysis
Image analysis employed codes written in Matlab (Math-Works Inc., Natick, MA) and the STIMULATE software (Strupp, 1996). All statistical tests employed the Student paired t-test. CBF image (SCBF) with intensity in units of ml/g tissue per min was calculated pixel-by-pixel as previously described (Duong et al., 2000; Silva et al., 1999). For contrast-to-noise determinations, all image acquisitions were viewed and assessed for motion during the trial. The initial two repetitions were eliminated from each scan because the acquisition was not at steady state. Three general regions of interest (ROIs) were defined for each animal namely the cortex (all cortical regions above the corpus callosum), sub-cortex (subcortical brain regions below the corpus callosum), and whole brain.
Percent change and contrast-to-noise ratios were calculated for each trial. The baseline mean and standard deviation was calculated for the period from repetitions 3–99, and the awake 5% CO2 challenge mean and standard deviation was calculated for the period from repetitions 100–200. For each time-course, the pixel intensities were normalized to 1 by dividing each value by the mean of the baseline. The mean pixel for every pixel within the ROI was tabulated at each time point during the CO2 condition and subtracted from mean baseline pixel intensity. The data were normalized by dividing by the mean of the baseline to produce a time-course of percent change. The time-courses for all the trials were then averaged together for each cohort on a specific day of acclimation.
Data collected throughout the scan were assessed for head motion by monitoring shifts in the mass-center of the image in the vertical and horizontal planes. Data were collected, compiled, and analyzed from acclimation days 1 and 5, for all subjects. The time-course of mass-center values were exported from STIMULATE (Strupp, 1996) and imported to an excel spreadsheet. The location of the mass-center was assessed throughout the scan for the horizontal and vertical axes and then subtracted from each value in the time-course. The standard deviations of the 14 time-courses were compiled and compared between days 1 and 5 for the x- and y-axes.
2.7. Physiological data analysis
The physiological data were analyzed using a repeated measures Friedman ANOVA followed by a Wilcoxon Signed-Rank Test for post hoc analysis.
3. Results
3.1. Acclimation lowers stress-induced physiological indices
Fig. 1a–c summarizes the data from several stress-related parameters including respiration (collected via a thoracic transducer), heart rate (measured with a pulse oximeter) and blood levels of corticosterone during acclimation to the imaging procedures. The mean respiration rate recorded on days 1, 3, 5, and 8 of acclimation are presented in Fig. 1a. By the third day of acclimation, the respiratory rate decreased by 66% as compared to session on day 1 (p < 0.05). By day 3, the heart rate fell within the normal range (70–115 breaths/min) for awake adult rats in a non-life threatening situation (Sharp and La Regina, 1998). The decrease in respiration rate noted on day 3 continued to progress with further decrements seen on days 5 and 8 of the acclimation period.
Fig. 1.
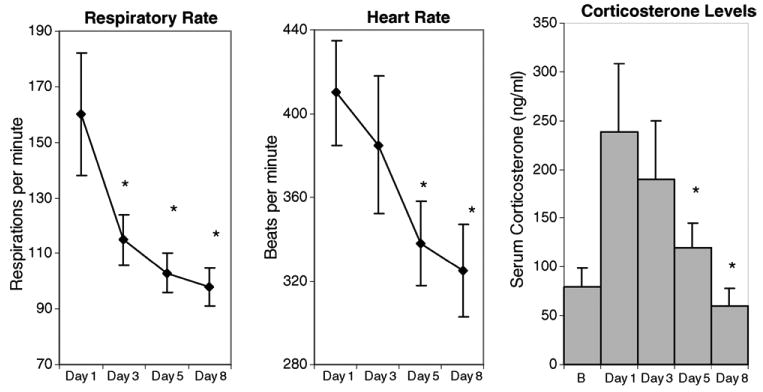
(a) The respiratory rate as measured on days 1, 3, 5, and 8 of acclimation to imaging protocol. Presented in Fig. 2a are the mean and S.E.M. Normal range for respiratory rate ranges from 66 to 114 beats/min. There was a significant decrease in respiratory rate for the third day of acclimation (p < 0.05) as compared to day 1. (b) The heart rate as measured on days 1, 3, 5, and 8 of acclimation to imaging protocol stressors. Presented in Fig. 2b are the mean and S.E.M. The normal range for heart rate ranges from 330 to 480 beats/min. There was a significant decrease in heart rate by day 5 of acclimation (p < 0.01) as compared to day 1. (c) Plasma corticosterone levels (μg/dl) measured on days 1, 3, 5, and 8 of acclimation to imaging protocol stressors, presented are the mean and S.E.M. There was a significant decrease in plasma levels of corticosterone for days 5 and 8 of acclimation as compared to day 1 (p < 0.05).
Fig. 1b depicts changes in the mean heart rate on days 1, 3, 5 and 8 of acclimation. The trend towards a general decrease in heart rate is observed by day 3. The decrease in heart rate was significant by day 5 of acclimation (p < 0.01) with further decrements by day 8 (p < 0.001) compared to that observed from the acclimation session on day 1. The heart rates reported were within the normal range (300–450 beats/min) for adult rats experiencing a non-life threatening or “normal” condition (Sharp and La Regina, 1998).
Finally, changes in plasma levels of corticosterone monitored at baseline and at the end of acclimation sessions on days 1, 3, 5, and 8, are presented in Fig. 1c. The plasma levels of corticosterone increased significantly from baseline during the first 3 days of acclimation (p < 0.05). This increase was followed by a dramatic decrease in plasma levels of corticosterone on acclimation days 5 and 8 (p ≤ 0.05) as compared to day 1.
3.2. Enhancement of the quality of fMRI results with acclimation
Representative anatomical images obtained from an awake rat in a restrainer are shown in Fig. 2. There were no ostensible movement artifacts in the anatomical images. Superimposed on these anatomical images are ROIs of four major brain regions used in our quantitative CBF analysis, namely the cortex, caudate putamen, hippocampus, and hypothalamus.
Fig. 2.
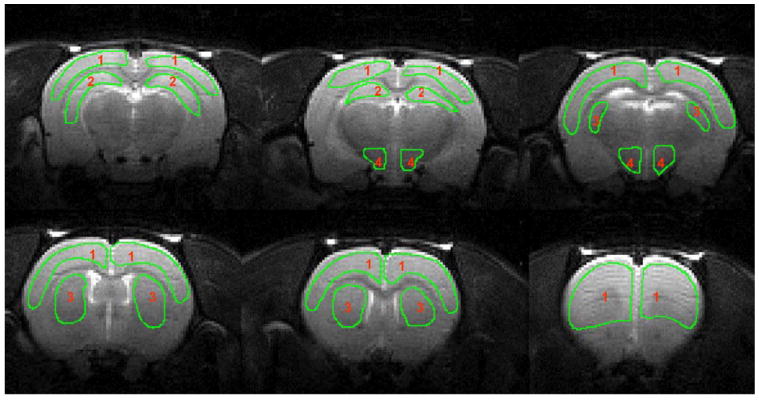
Regions of interest (ROI) used in determination of cerebral blood flow values. Key: 1, cortex; 2, hippocampus; 3, caudate putamen; 4, hypothalamus.
Fig. 3 summarizes cerebral blood flow before and after acclimation. Fig. 3a depicts global and regional CBF values on days 1 and 5 of acclimation. Global CBF values were not significantly different on day 5 relative to day 1. As expected, there were significant regional differences in CBF across brain areas including the cortex, caudate putamen, hippocampus, and hypothalamus. However, there were no significant differences in CBF in the aforementioned regions between days 1 and 5 of the acclimation period. Fig. 3b depicts changes in contrast-to-noise ratios measured on days 1 and 5 of acclimation. There were significant differences in the contrast-to-noise in both sub-cortical regions, and whole brain regions between acclimation days 1 and 5 (p ≤ 0.05).
Fig. 3.
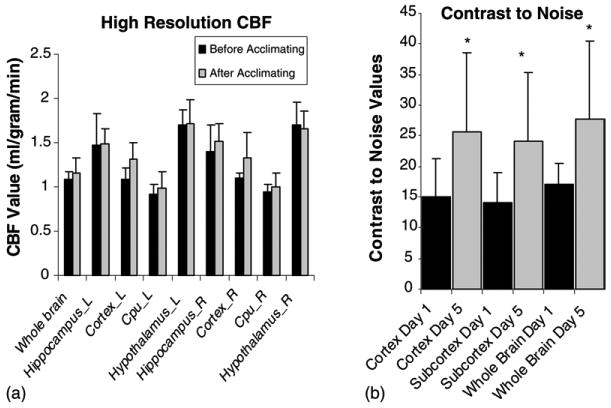
(a) Cerebral blood flow (CBF) values (ml/g/min) for whole brain, hippocampus (left = L and right = R); cortex (L and R); caudate putamen (Cpu; L and R), and hypothalamus (L and R) on both day 1 (before acclimating) and day 5 (after acclimating). (b) Contrast-to-noise values on days 1 and 5 of acclimation in sub-cortical, cortical, and whole brain. The contrast-to-noise ratio was unaltered in the cortex but significantly increased in the sub-cortical, and whole brain regions examined on day 5 (p ≤ 0.05) as compared to day 1 of acclimation.
Fig. 4a depicts the pattern of head motion for a representative animal during the CO2 challenge scans on days 1 and 5. The data shows the displacement in millimeters of the instantaneous mass-center at each scan repetition from the average mass-center in the horizontal and vertical axes. The extent of head motion decreased from days 1 to 5 of acclimation. Fig. 4b is a graphic representation of the composite data obtained from the standard deviations taken from the 14 time-courses. The figure shows a significant decrease in head motion in both the x- and y-axes from days 1 to 5 (p ≤ 0.01 and ≤0.001), respectively.
Fig. 4.
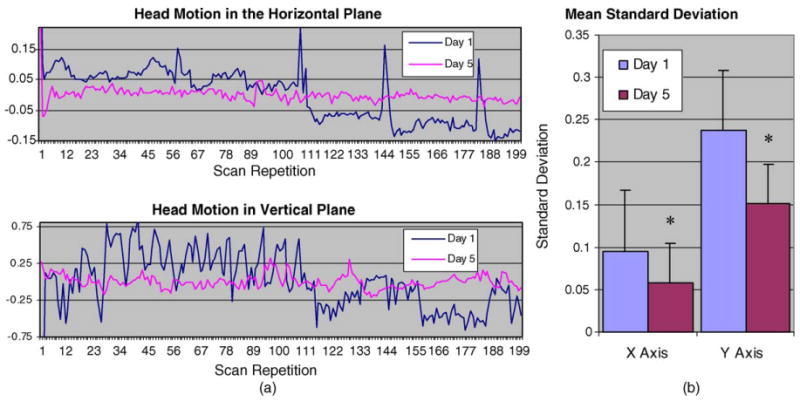
(a) A representative time-course depicting the displacement in millimeters of the mass-center at each scan repetition from the average mass-center in the horizontal and vertical planes. This figure illustrates a decrease in head motion along the x- and y-axes between days 1 and 5 of acclimation. (b) The standard deviation for the horizontal (x)- and vertical (y)-axes across 14 time-course scans collected on days 1 and 5 of acclimation. There is a significant decrease in motion in both the x- and y-axes from day 1 to day 5 (p ≤ 0.01) indicating less variability in the data due to motion.
4. Discussion
This study suggests that the stress of conditions faced by animal subjects during fMRI sessions (e.g., enclosed space, restraint, long imaging time, and loud noise) can be minimized, providing a platform for more refined and accurate studies, particularly in behavior and cognition. Most of the obstacles associated with effectively restraining animals have been overcome with the recent development of technology and methods for imaging conscious rats with minimal motion artifacts (Lahti et al., 1998, 1999). However, other major concerns regarding performance of fMRI studies in conscious animals are the issue of stress levels and the subsequent interpretation of the data. Conceivably, no imaging protocol utilizing fully conscious rats can be totally “stress-free”, however, we have demonstrated a significant reduction in stress indicators subsequent to acclimation. Physiological measures of stress (i.e., heart and respiratory rates) showed significant decrements throughout acclimation. The current experimental design incorporated an extended acclimation period (8 days) to assess possible benefits to long-term acclimation. Although stress indices continue to improve we conclude that stress of the imaging protocol can be significantly reduced as early as day 3 of acclimation, as reflected by changes in respiration rate, heart rate, and corticosterone levels compared to the initial exposure to the “mock scanner”.
The major objective of this study was to determine the potential use of awake animals for studies involving cognitive components, emotional indices, and in some instances, responses to pharmacological challenge. It is apparent from the CBF data that independent of the long-term cellular events that accompany acclimation (Chen and Herbert, 1995), acute global changes in blood flow to the brain are not significantly altered by stress. Since baseline CBF is unaltered, it may not be necessary to acclimate rats for certain studies. For example, interpreting imaging data following gross perturbations in CBF associated with epileptic seizures (Tenney et al., 2004), and cardiovascular sensitive drugs (Febo et al., 2004) may not benefit from animal acclimation. In contrast, the more subtle changes in BOLD signal intensity associated with cognitive and emotional stimuli and the interpretation of these data in the context of behavioral neuroscience would necessitate the use of acclimation. Indeed, acclimation improves data quality by increasing contrast-to-noise ratio. The precise mechanism for the enhanced contrast-to-noise ratio is unknown, though other studies confirm that low-frequency variation in the BOLD signal is linked to physiological noise caused by factors like head motion, cardiac output, and respiratory alterations (Biswal et al., 1996). Since the current study showed improvement in all of these parameters then the improvement in the quality of the fMRI results obtained from conscious alert rats is not unexpected.
In summary, current approaches for imaging awake animals utilized by other researchers (Hagino et al., 1998) which include implantation of cranioplastic caps to fit into restraint systems may prove too invasive and stressful for certain paradigms. Taken together, these studies suggest that the stress of imaging protocols in awake animals can be minimized by acclimation in a relatively short period of time and be particularly valuable for protocols assessing emotion and cognition that may be negatively affected by undue stress.
Acknowledgments
We would like to acknowledge grant support for J. King (NIMH-MH 067096).
References
- Bandettini PA, Wong EC. A hypercapnia-based normalization method for improved spatial localization of human brain activation with fMRI. NMR Biomed. 1997;10:197–203. doi: 10.1002/(sici)1099-1492(199706/08)10:4/5<197::aid-nbm466>3.0.co;2-s. [DOI] [PubMed] [Google Scholar]
- Biswal B, DeYoe AE, Hyde JS. Reduction of physiological fluctuations in fMRI using digital filters. Magn Reson Med. 1996;35:107–13. doi: 10.1002/mrm.1910350114. [DOI] [PubMed] [Google Scholar]
- Brammer A, West CD, Allen SL. A comparison of propofol with other injectable anesthetics in a rat model of measuring cardiovascular parameters. Lab Anim. 1993;27(3):250–7. doi: 10.1258/002367793780745354. [DOI] [PubMed] [Google Scholar]
- Chen X, Herbert J. Regional changes in c-fos expression in the basal forebrain and brainstem during adaptation to repeated stress: correlations with cardiovascular, hypothermic and endocrine responses. Neuroscience. 1995;64(3):675–85. doi: 10.1016/0306-4522(94)00532-a. [DOI] [PubMed] [Google Scholar]
- Detre JA, Leigh JS, Williams DS, Koretsky AP. Perfusion imaging. Magn Reson Med. 1992;23:37–45. doi: 10.1002/mrm.1910230106. [DOI] [PubMed] [Google Scholar]
- Dubowitz DJ, Chen DY, Atkinson DJ, Scedeng M, Martinez A, Andersen MB, et al. Direct comparison of visual cortex activation in human and non-human primates using functional magnetic resonance imaging. J Neurosci Meth. 2001;107:71–80. doi: 10.1016/s0165-0270(01)00353-3. [DOI] [PubMed] [Google Scholar]
- Duong TQ, Silva AC, Lee SP, Kim SG. Functional MRI of calcium-dependent synaptic activity: cross correlation with CBF and BOLD measurements. Magn Reson Med. 2000;43:338–92. doi: 10.1002/(sici)1522-2594(200003)43:3<383::aid-mrm10>3.0.co;2-q. [DOI] [PubMed] [Google Scholar]
- Febo M, Segarra A, Tenney J, Sullivan R, Brevard M, Duong TQ, et al. Imaging cocaine-induced changes in the rewarding system of conscious rats. J Neurosci Meth. 2004;139:167–76. doi: 10.1016/j.jneumeth.2004.04.028. [DOI] [PMC free article] [PubMed] [Google Scholar]
- Fox PT, Raichle ME. Focal physiology uncoupling of cerebral blood flow and oxidative metabolism during somatosensory stimulation in human subjects. Proc Natl Acad Sci. 1986;83:1140–4. doi: 10.1073/pnas.83.4.1140. [DOI] [PMC free article] [PubMed] [Google Scholar]
- Grey S, Price G, Mathews A. A reduction of anxiety during MR imaging: a controlled trial. Magn Reson Imaging. 2002;18(3):351–5. doi: 10.1016/s0730-725x(00)00112-0. [DOI] [PubMed] [Google Scholar]
- Hagino H, Tabuchi E, Kurachi M, Saitoh O, Sun Y, Kondoh T, et al. Effects of d-2-dopamine receptor agonist and antagonist on brain activity in the rat assessed by functional magnetic resonance imaging. Brain Res. 1998;813:367–73. doi: 10.1016/s0006-8993(98)01039-7. [DOI] [PubMed] [Google Scholar]
- Hollenhorst J, Munte S, Friedrich L, Heine J, Leuwer M, Becker H, et al. Using intranasal midazolam spray to prevent claustrophobia induced by MR imaging. Am J Roentgenol. 2001;176(4):865–8. doi: 10.2214/ajr.176.4.1760865. [DOI] [PubMed] [Google Scholar]
- Lahti K, Ferris CF, Li F, Sotak CH, King JA. Imaging brain activity in conscious animals using functional MRI. J Neurosci Meth. 1998;82:75–83. doi: 10.1016/s0165-0270(98)00037-5. [DOI] [PubMed] [Google Scholar]
- Lahti K, Ferris CF, Li F, Sotak CH, King JA. Comparison of evoked cortical activity in conscious and propofol-anesthetized rats using functional MRI. Magn Reson Med. 1999;41:412–6. doi: 10.1002/(sici)1522-2594(199902)41:2<412::aid-mrm28>3.0.co;2-3. [DOI] [PubMed] [Google Scholar]
- Lukins R, Davan IG, Drummond PD. A cognitive behavioral approach to preventing anxiety during magnetic resonance imaging. J Behav Ther Exp Psychiatry. 1997;2:97–104. doi: 10.1016/s0005-7916(97)00006-2. [DOI] [PubMed] [Google Scholar]
- Ogawa S, Tank DW, Menon R, Ellermann JM, Kinm SG, Merkle H, et al. Intrinsic signal changes accompanying sensory stimulation: functional brain mapping with magnetic resonance imaging. Proc Natl Acad Sci USA. 1992;89:5951–5. doi: 10.1073/pnas.89.13.5951. [DOI] [PMC free article] [PubMed] [Google Scholar]
- Sharp P, La Regina M. Animal pocket reference series. Washington, DC: CRC Press; 1998. [Google Scholar]
- Sicard K, Shen Q, Brevard ME, Sullivan R, Ferris CF, King JA, et al. Regional cerebral blood flow in conscious and anesthetized rats under basal and hypercapnic conditions: implications for fMRI studies. J Cereb Blood Flow Metab. 2003;23:472–81. doi: 10.1097/01.WCB.0000054755.93668.20. [DOI] [PMC free article] [PubMed] [Google Scholar]
- Silva A, Lee SP, Yang C, Iadecola C, Kim SG. Simultaneous BOLD and perfusion functional MRI during forepaw stimulation in rats. J Cereb Blood Flow Metab. 1999;19:871–9. doi: 10.1097/00004647-199908000-00006. [DOI] [PubMed] [Google Scholar]
- Silva AC, Zhang W, Williams D, Koretsky AP. Estimation of water extraction fractions in rat brain using magnetic resonance measurement of perfusion with arterial spin-labeling. Magn Reson Med. 1997;37:58–68. doi: 10.1002/mrm.1910370110. [DOI] [PubMed] [Google Scholar]
- Strupp JP. Stimulate: a GUI based fMRI analysis software package. Neuroimage. 1996;3:607. [Google Scholar]
- Tenney J, Duong TQ, King J, Ferris C. fMRI of brain activation in a genetic rat model of absence seizures. Epilepsia. 2004;45:576–82. doi: 10.1111/j.0013-9580.2004.39303.x. [DOI] [PMC free article] [PubMed] [Google Scholar]
- Zhang Z, Andersen AH, Avison MJ, Gerhardt GA, Gash DM. Functional MRI of apomorphine activation of the basal ganglia in awake rhesus monkeys. Brain Res. 2000;852:290–6. doi: 10.1016/s0006-8993(99)02243-x. [DOI] [PubMed] [Google Scholar]