

Abstract
Pilot forward genetic screens in Xenopus tropicalis have isolated over 60 recessive mutations (Grammer et al., 2005; Noramly et al., 2005; Goda et al., 2006). Here we present a simple method for mapping mutations to chromosomes using gynogenesis and centromeric markers. When coupled with available genomic resources, gross mapping facilitates evaluation of candidate genes as well as higher resolution linkage studies. Using gynogenesis, we have mapped the genetic locations of the 10 X. tropicalis centromeres, and performed Fluorescence In Situ Hybridization to validate these locations cytologically. We demonstrate the use of this very small set of centromeric markers to map mutations efficiently to specific chromosomes.
Introduction
Despite its many advantages for cell and developmental biology, Xenopus laevis is not amenable to systematic genetic analysis, largely due to its tetraploid genome and long generation time. The related diploid species Xenopus tropicalis has emerged as a more tractable system for genetic and genomic studies, while retaining X. laevis’ embryological and cell biological toolkit (Amaya et al., 1998; Hirsch et al., 2002; Showell and Conlon, 2007). In addition to a shorter generation time than its larger relative, X. tropicalis has one of the smallest tetrapod genomes, (1.5×10⁹ bp) distributedover 10 chromosomes, from which a meiotic map and high quality draft genome sequence have been assembled (Klein et al., 2002). The relatively simple canonical vertebrate genetic organization contrasts with those of teleost fishes, whose evolutionary history includes an additional whole-genome duplication and subsequent reorganization/diversification (Cresko et al., 2003; Naruse et al., 2004; Postlethwait, 2007). Genetic screens in X. tropicalis should reveal vertebrate gene functions masked by partitioning among multiple paralogs in teleosts (Force et al., 1999; Postlethwait et al., 2000). The accessible, manipulable embryos also encourage genetic dissection of tetrapod-specific processes that may be more challenging to study in models with intrauterine development (Kile et al., 2003; Caspary and Anderson, 2006).
To understand functional information obtained from X. tropicalis forward genetic screens, positional cloning tools are necessary. Two important resources, a meiotic linkage map of Simple Sequence Length Polymorphisms (SSLPs) (Sater and Wells, 2008) and a high-quality draft genome (Klein et al., 2002), have recently become available. Conventional mapping requires identifying male and female mutant carrier animals and scanning the genome for linked polymorphisms, both of which can be time-consuming. Use of gynogenetic diploid embryos, in which the entire genotype is maternally derived, can streamline screening for mutations (Krotoski et al., 1985; Noramly et al., 2005; Goda et al., 2006) as well as the first stages of mapping (Thiebaud et al., 1984; Reinschmidt et al., 1985; Streisinger et al., 1986; Johnson et al., 1995; Johnson et al., 1996).
Gynogenetic diploids, or gynogenotes, are simple to produce in Xenopus, and wild-type gynogenotes can be raised to fertile adults (Tompkins and Reinschmidt, 1991). To generate gynogenetic Xenopus embryos, eggs are fertilized in vitro with UV-irradiated sperm, and the resulting haploid embryos are briefly immersed in ice-cold medium to prevent polar body extrusion (Fig. 1) (Grainger; Fankhauser and Griffiths, 1939). Prevention of polar body extrusion allows the sister products of meiosis II to be retained, rescuing haploid embryos to viable diploids. The genome of a gynogenote is completely maternally-derived, but not completely homozygous (see Fig. 1), analogous to half of a tetrad (Streisinger et al., 1986). Gynogenetic progeny from individual carrier females can reveal recessive phenotypes identical to those produced by conventional crosses, saving considerable space and time compared to standard F3 screens.
Figure 1. Gynogenesis and Centromere Mapping.

A. X. tropicalis N and IC strains differ at many sequence polymorphisms, schematized in red and blue. Hybrids contain both N and IC parental chromosomes, which recombine during Meiosis I. Shortly after fertilization, one set of sister chromatids is extruded as a polar body, resulting in a haploid embryo if eggs are fertilized with UV-irradiated sperm. Cold shock suppresses polar body formation, resulting in a gynogenote containing the sister chromatids of meiosis II. Loci very close to centromeres are homozygous in gynogenotes, but meiotic recombination can produce heterozygous non-centromeric loci. B. Centromeres were mapped by assaying frequency of homozygosity at polymorphic loci in gynogenotes. Three markers on Chr 1/LG1 were tested on the same set of gynogenotes. Proximity to centromere is reflected by relative frequency of heterozygosity, with marker 013H11 (2/19) closer than 013D04 (9/19) and 003D01 (17/20).
In this study we sought to determine if gynogenesis would be an efficient method to map mutations to specific chromosomes. Tetrad analysis is powerful for mapping mutations in those fungi and plants where the four products of meiosis are present as an ordered set (Perkins, 1955). In vertebrates such as the zebrafish, gynogenesis has been shown to be effective for mapping, providing similar information to that obtained from ordered tetrads (Streisinger et al., 1986; Johnson et al., 1995; Johnson et al., 1996).
Gynogenesis streamlines mapping X. tropicalis mutations in several ways. A single female of the appropriate genetic background provides abundant meioses to score. Only maternal alleles need be considered, avoiding more complex three- and four-allele systems. The mutation-centromere distance can be estimated from phenotype ratios observed in gynogenetic embryos (Thiebaud et al., 1984; Reinschmidt et al., 1985; Streisinger et al., 1986; Johnson et al., 1995; Johnson et al., 1996). Finally, polymorphisms near centromeres of chromosomes are homozygous in gynogenetic embryos (Johnson et al., 1995). Here we show that these centromeric loci can be used to efficiently map X. tropicalis mutations to specific linkage groups.
The genetic locations of centromeres in X. tropicalis have not been previously described. In this study, we identified centromere-linked loci by finding polymorphic markers from each of the 10 linkage groups that were homozygous in gynogenotes at a high frequency (Johnson et al., 1995). We have validated these locations cytologically by Fluorescence In Situ Hybridization (FISH), and confirmed their association with specific chromosomes. To demonstrate the efficacy of gynogenetic analysis, we have mapped a number of mutants to specific linkage groups using this method. We conclude that linkage analysis using gynogenesis and centromeric markers is a rapid and efficient method for low-resolution mapping. We have also analyzed two other factors that affect gynogenetic screening and mapping strategies: chiasma interference (the effect one crossover has on the probability of further recombination), which could limit the proportion of the genome accessible to gynogenetic screens; and the relative rates of recombination in the male and female germline.
Materials and Methods
Strains
In all cases, mutations were induced on the N (Nigerian) strain background (from Rob Grainger). Mapping strains include the IC (Ivory Coast), ICB (inbred from TGA stock), and PopA strains. TGA stock was obtained from Nicolas Pollet, and originated as an outbred stock from animals kept in Rennes, Basel, and Gif-sur-Yvette thought to have derived from the collection of Michael Fischberg in Geneva. The stock originated predominantly from Adiopoumé in Ivory Coast, and maintains the axanthic gray color that we assume provides the strain designation (Tymowska and Fischberg, 1982) but we cannot rule out contributions from Cameroon and Sierra Leone (Du Pasquier and Blomberg, 1982). Provenance of the PopA strain (from David Wright) is uncertain. Karyotypes of all stocks have been verified to be 2N=20, and all hybrids are fertile.
Cold-shock gynogenesis
Females carrying abundant polymorphisms were derived from crosses of N strain animals to either IC, ICB, or PopA strains. Females heterozygous for specific mutations were identified by gynogenesis or by crossing to known heterozygotes. Cold-shock gynogenesis was performed with minor modifications (Grainger): Females were induced to ovulate (Khokha et al., 2002) and eggs expressed manually into a dish containing 1×MMR to inhibit premature activation. Testes were crushed in 1 ml of L15 + 10% calf serum using an eppendorf pestle. The dispersed sperm suspension was then placed in a glass petri dish, irradiated with 50–70,000 microjoules of UV in a Stratalinker (Stratagene) and applied to eggs after removal of the 1×MMR buffer. Five minutes after application of sperm, eggs were flooded with 1/20×MMR, and five minutes later, cold-shocked by placing the dish in an ice bath where the medium was replaced with ice-cold 1/20×MMR. After 10 minutes dishes were removed from ice and medium was exchanged back to room temperature (~22°C) 1/20×MMR for further development. After 2–4 hours, cleaving embryos were sorted from unfertilized eggs. If necessary, mutant embryos were then distinguished from wild type to form a genotyping panel. At ~stage 45, DNA was prepared from embryos after lysis in 100 μl 50mM Tris-HCL pH 7.5, 50mM NaCl, 5mM EDTA, 0.5%SDS containing 250 μg/ml Proteinase K and in some cases Chelex resin to 5%. After 1 hour (or overnight) incubation at 55°C, samples were heat inactivated at 95°C. In most cases samples were diluted (2–4 fold) to 20 ng/μl and one microliter was used per PCR reaction.
Mapping of centromeres and mutations
To map centromeres, sets of >35 gynogenotes were assayed for heterozygosity at polymorphic markers. To estimate the distance from the centromere to a proximal locus (ignoring multiple crossovers), we used the formula N/2 where N is the frequency of heterozygous gynogenotes (Streisinger et al., 1986). In cases where no heterozygous gynogenotes were identified for a marker, we calculated the distance as if the next gynogenote would be heterozygous. For mapping mutations to chromosomes, sets of >20 embryos were analyzed individually or in bulk segregant pools with polymorphic markers from each of the 10 centromeres. Linkage observed in the initial pools or groups was then confirmed in larger sets of individual embryos, and reconfirmed by subsequent analysis of markers along the chromosome arms. Since single SSLP alleles sometimes appear as doublets which are difficult to distinguish from heterozygotes (see Fig. 3), when necessary, we confirmed the presence of a polymorphism by assaying ~6 individual gynogenetic or haploid embryos. Primer sequences are provided in Table 4. PCR conditions were briefly: 1× buffer, 1.5 mM MgCl2, 0.2mM dNTPs, 0.05u Taq/μl, 0.5 μM each primer, ~1 ng/μl DNA; 4′ initial 94°C denaturation followed by 30 cycles × (1′ 94°C denaturation, 1′ 58°C annealing, 1′ 72°C elongation); followed by 5′ 72°C final elongation. Primer sequences and PCR protocols are also online at http://tropmap.biology.uh.edu. Amplification products were analyzed by PAGE and visualized with Ethidium Bromide or silver staining (Bassam et al., 1991).
Figure 3. Mapping Mutations With Centromere Markers and Gynogenesis.

Bulk segregant analysis of pools of 20 mrs lot mutant (mlo) and sibling wild type (WT) gynogenotes scored with centromeric markers (LG1 013H11, LG2 025H10, LG3 025G03, LG4 010E04, LG5 049C11, LG6 016H09, LG7 047F06, LG8 051H02, LG9 026H07, LG10 028C03) from the 10 X. tropicalis linkage groups. mrs lot shows clear linkage to LG3.
Table 4.
| 019D06 | F-GCACAGGTGAGCACATTTAG R-CTGCACCAGGGTCATTATAC |
| 016H09 | F-AGAAGTCAAAACAAAGGCATTC R-CAGTCACATTTCAACAACAGC |
| 017G07 | F-CAATGATCCCAATGTTAGCC R-ATTTCCGATCTGCTATGCTG |
| 047F06 | F-AAAAGAATGAGACCCGTGTG R-ACATTTGTCCTCCCTGTGTG |
| 026H07 | F-GATAAAAGAAAACGACACCCC R-TTTCAGGCTATCAGCAAATC |
| 025H10 | F-GGCATGGCTGAGAAGTTTAC R-GATTGGTGATTGGATTCTGG |
| 010E04 | F-TAAAAGCATACGCCCAAAAG R-TGTGCAAACAGACAATCACC |
| 049C11 | F-AATGGCTTTCTCTTTCTCTCTC R-GCCCAATACATAAAGGACACC |
| 023G03 | F-TCAGAAGGTTGTTTTCCTGC R-GACCCAAGAGAGAGGGAGAG |
| N3-34 | F-AGGAGATGCAATTTGGTTGG RAGAGGCACACACAGGAAAGC |
| 013H11 | F-TAACTTTCTCCAGGCACAGC R-TGACACAGATCACATCCACAG |
| 013D04 | F-CTTTTGGGTGTCTGTGAAGG R-AATCAGCTATGGTATCAGGGG |
| 003D01 | F-GCCAAACAATCAATAGCGTC R-TGTGGAAGTTACCCTGGAAG |
| 016H09 | F-AGAAGTCAAAACAAAGGCATTC R-CAGTCACATTTCAACAACAGC |
| 043H07 | F-ATGCTCGGGACTATTTGAAG R-TATCAGCAGCACGAACAAAC |
| 020E05 | F-GGAGGACAACATGGCTTATG R-CAGGAGCTTCAGAGAGATGC |
| 025E03 | F-GGCAAGAAGCACATTTGAAG R-CAAGAACTCTGTCCCTGCTG |
| 025G03 | F-TTTGTACTCAGGGACATCAGC R-TAGCCTTGTAGTGCTCCCAC |
| 051H02 | F-CAAAAGAGTTCTGCACCTGG R-TCAGAGAGAGAGTGAAAACCAAG |
| 028C03 | F-ACATTCCCATCTTTTCCCTC R-AGACAGACAGGACGGTTGAC |
Chromosome cytology
To prepare probes for Fluorescent In Situ Hybridization (FISH), RNA for RT PCR was isolated from the liver of an adult frog with the RNeasy mini kit (Qiagen, Germany). Centromeric SSLP markers were assigned to particular scaffolds using the preliminary X. tropicalis linkage map (http://tropmap.biology.uh.edu/map.html). A cDNA of a gene with predicted expression in the liver was selected from each scaffold via the Ensembl database (http://www.ensembl.org/index.html), and a cognate 0.9 – 2 kb probe was amplified by RT PCR. 1 μg of RT PCR product was labeled by Dig-11-dUTP (Roche, Germany) using the random priming technique (Decalabel DNA Labeling kit, Fermentas, Lithuania). Probes were then purified via the Gel extraction kit (Qiagen, Germany) with an elution volume of 50 μl.
Metaphase spreads were prepared from a euploid testicular primary cell culture. Testicular cells from juvenile frogs were cultivated in a mixture of 1:1 RPMI and L15 media + 10% fetal bovine serum, diluted to 2/3 with sterile water. After the 10th to 14th passage, cells were harvested by trypsinization and treated with colchicine (0.2 μg/ml) for 4 h. at 28°C, centrifuged and resuspended in hypotonic 40 mM KCl. The cell suspension was fixed and dropped onto microscope slides (Courtet et al., 2001). Specimens were then treated for 5 min with pepsin (50 μg/ml in 0.01 N HCl) at 37°C followed by 30 min. incubation in 2% paraformaldehyde at RT. FISH coupled with tyramide amplification (FISH-TSA) was performed as described previously with minor changes (Krylov et al., 2007). Endogenous peroxidases were quenched by incubation with 1% H2O2 for 30 min. Slides were dried after dehydration in a series of methanol washes (70, 90, 100%). Chromosomes were denatured and hybridized with probe (50 μl hybridization mixture incl. 2 μl labeled probe, 50% formamide, 2 × SSC - 300mM NaCl, 30 mM sodium citrate, pH 7.0) under a cover glass at 70°C for 5 min. Following hybridization, slides were left overnight in a wet chamber at 37°C. Posthybridization washing and visualization of FISH-TSA signal were performed as described previously (Krylov et al., 2007; Krylov et al., 2008). Chromosomes were identified using the p/q arm ratio and relative length.
Lampbrush chromosomes were examined according to established protocols (Gall, 1997).
Note on Chromosome Nomenclature
Previous karyotype studies of X. tropicalis established an unconventional cytological nomenclature based on relative sizes of p and q arms (Tymowska, 1973). Here we propose a more conventional nomenclature, where the largest chromosome is labeled 1, and the smallest is 10. Ordering of the similar-sized chr. 7 and 8 is based on the p/q arms ratio, where chr. 7 is more metacentric than chr. 8. Table 1 outlines the previous nomenclature and the new one proposed in this manuscript. Genetic linkage groups will also be renumbered to reflect chromosomal nomenclature after completion of ongoing linkage analyses.
Table 1.
| Chromosome | Tymowska | LG | Relative chromosomal length | p/q arms ratio | Centromere Marker | Marker Location | Distance from centromere | Het/Tota |
|---|---|---|---|---|---|---|---|---|
| 1 | 1 | 1 | 1 | 0.73 | 019D06 | 66.14 | <1 cM | 0/60 |
| 2 | 2 | 6 | 0.85 | 0.63 | 016H09 | 0 | 1.3 cM | 2/78 |
| 3 | 9 | 8 | 0.80 | 0.31 | 017G07 | 53.51 | 1.3cM | 2/77 |
| 4 | 3 | 7 | 0.77 | 0.58 | 047F06 | 58.54 | <1 cM | 0/50 |
| 5 | 4 | 9 | 0.73 | 0.60 | 026H07 | 19.83 | <0.9cM | 0/55 |
| 6 | 8 | 2 | 0.71 | 0.89 | 025H10 | 49.10 | 1.2cM | 1/43 |
| 7 | 5 | 4 | 0.67 | 0.72 | 010E04 | 52 | 1cM | 1/52 |
| 8 | 10 | 5 | 0.67 | 0.22 | 049C11 | 49.78 | 1.4 cM | 1/35 |
| 9 | 6 | 3 | 0.53 | 0.68 | 023G03 | 50.58 | 1.3 cM | 3/115 |
| 10 | 7 | 10 | 0.31 | 0.70 | N3-34 | 2.34 | <1cM | 0/79 |
Results
Centromeric Loci
We tested a number of SSLP markers for each linkage group on a panel of gynogenotes, and calculated the genetic distance between a given polymorphic locus and its centromere from the frequency of heterozygosity. Based on the available genetic map and our calculated genetic distance to the centromere, we tested additional markers for proximity to the centromere. In this manner, we identified polymorphisms which were less than 3% heterozygous in sets of 35 or more gynogenotes, or less than 1.5 cM from the centromere for each of the 10 chromosomes (Table 1). The ratio of mutant to wild type gynogenotes similarly reflects crossover frequency, and has been used to calculate mutation-centromere distances in frogs (Thiebaud et al., 1984; Reinschmidt et al., 1985) and zebrafish (Streisinger et al., 1986; Johnson et al., 1995; Johnson et al., 1996).
To validate these gynogenetically-obtained centromere locations, we generated cDNA probes from sequence scaffolds containing the linked markers and performed Fluorescent in situ Hybridization (FISH) analysis on chromosome spreads. These studies confirm that the scaffolds identified by our gynogenetic analysis are close to the centromeres of the 10 distinct X. tropicalis chromosomes (Fig. 2).
Figure 2. Cytological Localization of Centromeric Markers.
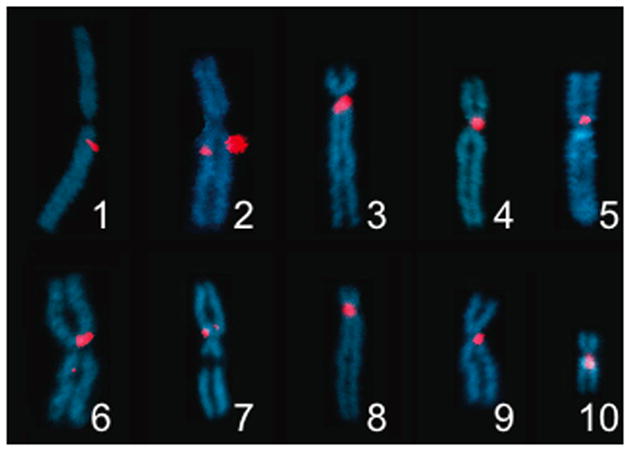
FISH probes were generated from cDNAs of genes on centromere-linked scaffolds identified by gynogenesis. Probe name, location: Chr1/LG1: mast3, q0.13; Chr2/LG6: epb41, q0.22; Chr3/LG8: gemin5, p0.00; Chr4/LG7: znf423, p0.00; Chr5/LG9: olig3, p0.00; Chr6/LG2: fbxl7, q0.13; Chr7/LG4: mat1a, p0.12; Chr8/LG5: naif1, p0.00; Chr9/LG3: stat4, q0.09; Chr10/LG10: ezh1, q0.03
Gross Mapping of Mutants using Gynogenesis and Centromere Markers
Having identified and validated centromeric locations for all ten chromosomes, we used these to evaluate a set of mutations for linkage. All mutants were previously described (Grammer et al., 2005; Goda et al., 2006) except jawbreaker (jbr), a newly-identified mutation affecting craniofacial development. We generated half-tetrad panels for 9 different mutations, all of which were mapped in a relatively small number of PCR reactions (Table 2). Bulk segregant analysis of pooled DNAs from ~20 mutant and wild type gynogenetic siblings frequently revealed linkage to one of the 10 centromeric markers (Fig. 3). For more distal mutant loci, where multiple crossover events can complicate linkage (see below), it was useful to initially analyze sets of >10 individual gynogenotes. With either method, linkage was then confirmed by testing additional individual gynogenotes with the linked centromeric marker.
Table 2.
| Chr | LG | Mutant |
|---|---|---|
| 1 | 1 | seasick (sskmh6A) |
| 2 | 6 | dicky ticker (ditmh71) |
| 3 | 8 | boxer’s eye (bxemh132C) |
| 4 | 7 | curly (curUC2), legolas (legmh132A) |
| 5 | 9 | jawbreaker (jbrUC6) |
| 8 | 5 | kaleidoscope (kalmh181) |
| 9 | 3 | mrs lot (mlomh19) |
| 10 | 10 | grinch (griUC1) |
Interference in X. tropicalis
Meiotic interference refers to the inhibitory effect one chiasma exerts on the likelihood of others occurring nearby. Interference is phylogenetically widespread (Perkins, 1962; Cherfas, 1977; Thorgaard et al., 1983; Kauffman et al., 1995), and can potentially affect both gynogenetic screening and mapping. If interference is strong and multiple crossovers are suppressed, single crossovers will accumulate in a high proportion of gynogenetic embryos, and distal loci will be predominantly heterozygous, as has been observed for some distal zebrafish loci, e.g. golden (Johnson et al., 1995). Distal recessive mutations will be observed infrequently, and will thus be less accessible to gynogenetic screens, but will nevertheless appear linked to the centromere. Conversely, if interference is relatively weak, distal recessive mutations may be efficiently uncovered by gynogenesis, but intervening multiple crossovers can affect mapping (see below).
To investigate interference, we generated a panel of 48 gynogenetic embryos, and analyzed individual gynogenotes with a series of markers on one arm of Chr2/LG6 (Fig. 4A) and Chr1/LG1 (data not shown). Multiple crossover events along the length of the chromosome are evident when progressively more distal markers are first heterozygous, then homozygous (lanes 3, 8, 11, 15, 16, 19, and 27). Multiple crossovers were detected in 7/48 gynogenotes for the chr2/LG6 marker set (Fig. 4A). For the most distal marker assayed on chr1/LG1, 19/48 double crossovers were detected (not shown), suggesting that at least in these large chromosome arms, interference is not absolute. Furthermore, the frequency of heterozygosity does not continue to rise with marker-centromere distance, as would be expected if single crossovers predominated with complete interference, but approaches 2/3 for distal loci (e.g. marker 025E03 in Fig. 4A), consistent with a lower level of interference and multiple intervening crossovers.
Figure 4. Interference in X. tropicalis.

A. Individual gynogenotes (48 lanes total) scored with 4 markers from the q arm of Chr2/LG6 with centromere-proximal marker (top) to distal (bottom) (016H09, LG6 map position 0.00 cM, 043H07/2.72 cM, 020E05/27.46 cM, and 025E03/44.7cM). Crossovers can be detected by changes between homo- and heterozygosity within a lane; embryos 3, 8, 11, 15, 16, 19, and 27 show more than one crossover between the centromere and the most distal marker. Heterozygosity in the most proximal marker in lanes 8 and 19 reflects a crossover between the centromere and that marker. Lanes 5 and 23 do not display crossovers. B. Some species of double crossover uncouple linkage of distal loci to centromere markers. In ‘2-strand double crossover’ (left), a distal recessive mutant locus (asterisks) remains linked to the white parental centromere allele after two intervening crossovers (parental ditype, PD). In ‘4-strand double crossover’ (right), mutant gynogenote shows dark non-parental ditype (NPD) centromeric alleles. C. Multiple chiasmata (white arrowheads) in a DAPI-stained lampbrush preparation of Chromosome 1.
Multiple crossovers involving different combinations of non-sister homologs have differing effects on linkage. Both two-strand and four-strand double crossovers can be detected (Fig. 4A). The gynogenotes in lanes 5 and 23 are homozygous at all 4 markers, consistent with no recombination in this interval. Assuming no crossovers, the high MW allele at the most centromeric locus 016H09 is ‘in coupling’ with the high MW allele at the distalmost locus 025E03 on the same maternal chromatid prior to Meiosis I (see schematic 4B), and the low MW allele with the lower on the other chromatid. These are termed parental ditype (PD). Lanes 3, 15, 16, and 27 are also scored as PD at these two loci, but are heterozygous at 020E05, consistent with a two-strand double crossover (Fig. 4B, left) where the first crossover must occur between the centromere and 020E05 and the second crossover between 020E05 and 025E03. Conversely, lane 11 shows a gynogenote with the high MW allele near the centromere (016H09) and a low MW allele at the distal loci 025E03, or those originally ‘in repulsion’ (in Fig. 4a compare 11 with 3 or 5), indicating the non-parental ditype (NPD) produced by a 4-strand double crossover (Fig. 4B, right).
The NPDs produced by 4-strand double crossovers are relevant for gynogenetic mapping, since as these accumulate, linkage of a locus to the centromeric allele becomes disrupted. However, as the PD class includes both unrecombined intervals and 2-strand double crossovers, it should always exceed the NPD class produced by 4-strand double crossovers. For example, even in the complete absence of interference, a mutation at a distance of 100cM would yield a PD:NPD ratio of 2.2:1 (Perkins, 1953). Currently, only one of the 20 chromosome arms on the X. tropicalis meiotic map exceeds 100cM. This suggests that for distal mutations, linkage to a particular centromere could still be obtained by analyzing larger sets of individual embryos, although bulk segregant analysis may become blurred due to accumulating NPDs. A second effect of a lower level of interference is that multiple crossovers may distort the phenotype ratio, and will not provide an accurate estimate of gene-centromere distance for the more distal mutations.
Multiple chiasmata can also be observed directly in lampbrush chromosomes. We analyzed crossover events in fifteen approximately complete sets of X. tropicalis lampbrush preparations. Fig. 4C shows a DAPI-stained Chr1/LG1 with at least five distinct chiasmata indicated by arrows. The number of chiasmata (disregarding terminal fusions) per individual chromosome was obtained from 15 approximately complete sets of chromosomes (Table 3). Four of the larger chromosomes average more than 3 chiasmata, with a mean of 26.1 chiasmata distributed over the ten chromosomes. Therefore, by cytological criteria, interference is not complete for the largest chromosomes in X. tropicalis, where multiple crossovers are common. We conclude that gynogenetic screens will not be limited to uncovering centromere-linked loci, but may be effective in uncovering mutations in a large proportion of the X. tropicalis genome, and also amenable to the rapid mapping strategy described here.
Table 3.
| Chromosome | 1 | 2 | 3 | 4 | 5 | 6 | 7 | 8 | 9 | 10 | Total |
| Chiasmata | 3.7 | 2.6 | 3.3 | 3.1 | 2.5 | 3.1 | 2.6 | 1.9 | 2.2 | 1.1 | 26.1 |
Sex specific recombination rate
Recombination rates differ between males and females in many species including fish (Singer et al., 2002), fly (Morgan, 1914), and human (Dib et al., 1996). Gynogenetic mapping, limited to female meioses, will be affected by these differences. We therefore compared recombination rates in males and females at several loci, by identifying individual male and female animals that carried scorable mutations (Goda et al., 2006) and also had, approximately 10cM away, a ‘3 allele’ polymorphism (one shared allele in coupling with the mutation, with the alleles in repulsion differing in the male and female parents; Fig. 5). After mating these animals, we collected phenotypically mutant embryos (homozygous at the mutant locus), and scored these for the nearby 3 allele polymorphisms. Heterozygosity at this locus revealed a crossover event, and the 3 allele system allowed us to ascribe the crossover to the male or female germline. From 217 embryos mutant at the cyd locus, we scored 47 crossovers of which 39 were maternal and 8 paternal (5:1 female:male). A second 3-allele system linked to the muzak locus on LG1 gave 18/220 maternal recombinants and 0/220 paternal. The significantly higher recombination rate in females suggests that most of the crossover events required for mapping will be available in gynogenetic embryos. However, gene-centromere distances obtained by the phenotypic ratio of gynogenetic embryos will tend to appear larger than distances on conventional meiotic maps, where male and female contribution to recombination are assumed to be equal.
Figure 5. Sex-specific Recombination Rates.

Crossover frequencies in male and female germlines were compared using a set of homozygous mutant cyd embryos and a ‘3-allele’ polymorphism (SSLP 011A08) ~10cM away, schematized in A. Parental female and male chromosomes (left) bearing the mutant cyd allele share one 011A08 allele (thin black bar) but have distinct 011A08 alleles in repulsion to cyd (maternal allele, solid grey box; paternal allele, hollow grey box). cyd mutant embryos homozygous for the coupled 011A08 allele indicate no recombination (top right, 170/217 cyd embryos assayed); 47 embryos were heterozygous at 011A08, indicating an intervening crossover. Recombination in maternal germline denoted by the intermediate MW solid grey maternal 011A08 allele (middle right) was detected in 39/47 (83%) recombinants, and in the paternal germline (high MW allele) in 8/47 (17%) (bottom right). No embryos showed recombination in both parents. B, representative genotyping results at marker 011A08: left lanes, female and male parents showing distinct intermediate and high MW alleles; progeny lanes: homozygous low MW band = no recombination; black asterisks, intermediate MW allele = maternal recombination; white asterisk, high MW allele = paternal recombination.
Discussion
In this manuscript, we describe the genetic locations of the centromeres of the 10 chromosomes of X. tropicalis, and confirm these locations cytologically. We have shown that these 10 centromeric loci can be used to map mutations to specific chromosomes in a small number of PCR reactions using bulk segregant pools of mutant and wild type gynogenote DNAs. In addition to linkage group information, the ratio of phenotypes in gynogenetic embryos can be used to estimate the mutation-centromere distance. The simplicity of this approach is compatible with simultaneous mapping during gynogenesis-based phenotypic screens. Gynogenetic screens are likely to continue to be useful in X. tropicalis, saving time and space relative to conventional 3-generation schemes. However, such screens do not offer conventional Mendelian phenotypic ratios to help distinguish heritable alleles from developmental ‘noise’. Linkage of bulk segregant mutant and wild type pools to a small set of centromeric loci is a simple method to confirm that a phenotype is truly genetic, as well as providing a chromosomal location. Candidate genes can be identified or eliminated by mapping a mutation to a linkage group with an estimate of gene-centromere distance. Panels of gynogenote DNAs can also be effectively used for intermediate-resolution mapping with additional markers, first to identify the linked chromosome arm, then to define a distal limit of linkage. Defining a centromere-proximal limit can be difficult, since many mutant gynogenotes may not have crossovers between the mutant locus and centromere. However, one set of mutant gynogenotes that contain centromere-proximal crossovers may be recognized by the NPD centromeric allele (see Fig. 4b). These double crossovers can be used to define the proximal border of the interval containing the mutation.
Evidence from mapping and lampbrush chromosome structure suggests that chiasma interference is not absolute in X. tropicalis, and that gynogenetic screens may efficiently uncover recessive phenotypes in many regions of the genome. It was initially inferred that interference was very strong in zebrafish (Streisinger et al., 1986), but more recent evidence suggests that this may not be the case for all chromosomes (Johnson et al., 1995), consistent with what we observe for X. tropicalis. We have also shown that for at least two chromosomes, recombination frequency is significantly higher in the female germline than in the male. Mapping panels generated by gynogenesis are thus likely to contain similar numbers of useful crossovers as those generated by conventional crosses. The gynogenetic mapping strategy described here is rapid and inexpensive, and a single carrier female can provide valuable medium-resolution genetic information. These gynogenetically-obtained intervals, combined with genomic resources, will help to identify novel and informative X. tropicalis mutations for further conventional mapping and functional analysis.
Acknowledgments
Special thanks to Rob Grainger for developing and sharing the X. tropicalis cold shock gynogenesis protocol, and to Rob Grainger, David Wright and Nicolas Pollet for providing strains of X. tropicalis. MKK is supported by the NIH/NICHD (1R01DE018824). RMH is supported by NIH (GM42341) and the undergraduate research apprentice program of UC Berkeley. LBZ is supported by the Medical Research Council UK and NIH (7RO1HD042276). VK and JM were supported by the Ministry of Education, Youth and Sports of the Czech Republic (Grant No: MSM0021620858).
MKK, LBZ, RMH designed the experiments, interpreted the results, and wrote the paper. VK, JM, TT, and LT performed the FISH experiments. JG examined lampbrush chromosomes. AKS and DW identified markers and provided the genetic map. MJR, DB, JC, SK, DL, CN, NP, PS, AAD, TG, EV, HI identified centromeric markers, genotyped embryos, and mapped mutations.
References
- Amaya E, Offield MF, Grainger RM. Frog genetics: Xenopus tropicalis jumps into the future. Trends Genet. 1998;14:253–255. doi: 10.1016/s0168-9525(98)01506-6. [DOI] [PubMed] [Google Scholar]
- Bassam BJ, Caetano-Anolles G, Gresshoff PM. Fast and sensitive silver staining of DNA in polyacrylamide gels. Anal Biochem. 1991;196:80–83. doi: 10.1016/0003-2697(91)90120-i. [DOI] [PubMed] [Google Scholar]
- Caspary T, Anderson KV. Uncovering the uncharacterized and unexpected: unbiased phenotype-driven screens in the mouse. Dev Dyn. 2006;235:2412–2423. doi: 10.1002/dvdy.20853. [DOI] [PubMed] [Google Scholar]
- Cherfas NB. Diploid radiation-induced gynogenesis in carp. II. Segregation according to morphological traits in gynogenetic progenies. Genetika. 1977;13:811–820. [PubMed] [Google Scholar]
- Courtet M, Flajnik M, Du Pasquier L. Major histocompatibility complex and immunoglobulin loci visualized by in situ hybridization on Xenopus chromosomes. Dev Comp Immunol. 2001;25:149–157. doi: 10.1016/s0145-305x(00)00045-8. [DOI] [PubMed] [Google Scholar]
- Cresko WA, Yan YL, Baltrus DA, Amores A, Singer A, Rodriguez-Mari A, Postlethwait JH. Genome duplication, subfunction partitioning, and lineage divergence: Sox9 in stickleback and zebrafish. Dev Dyn. 2003;228:480–489. doi: 10.1002/dvdy.10424. [DOI] [PubMed] [Google Scholar]
- Dib C, Faure S, Fizames C, Samson D, Drouot N, Vignal A, Millasseau P, Marc S, Hazan J, Seboun E, Lathrop M, Gyapay G, Morissette J, Weissenbach J. A comprehensive genetic map of the human genome based on 5,264 microsatellites. Nature. 1996;380:152–154. doi: 10.1038/380152a0. [DOI] [PubMed] [Google Scholar]
- Du Pasquier L, Blomberg B. The expression of antibody diversity in natural and laboratory-made polyploid individuals of the clawed toad Xenopus. Immunogenetics. 1982;15:251–260. doi: 10.1007/BF00364333. [DOI] [PubMed] [Google Scholar]
- Fankhauser G, Griffiths RB. Induction of Triploidy and Haploidy in the Newt, Triturus Viridescens, by Cold Treatment of Unsegmented Eggs. Proc Natl Acad Sci U S A. 1939;25:233–238. doi: 10.1073/pnas.25.5.233. [DOI] [PMC free article] [PubMed] [Google Scholar]
- Force A, Lynch M, Pickett FB, Amores A, Yan YL, Postlethwait J. Preservation of duplicate genes by complementary, degenerative mutations. Genetics. 1999;151:1531–1545. doi: 10.1093/genetics/151.4.1531. [DOI] [PMC free article] [PubMed] [Google Scholar]
- Gall JG. Spread preparation of Xenopus germinal vesicle contents. Cold Spring Harbor: Cold Spring Harbor Laboratory Press; 1997. pp. 52.51–52.54. [Google Scholar]
- Goda T, Abu-Daya A, Carruthers S, Clark MD, Stemple DL, Zimmerman LB. Genetic screens for mutations affecting development of Xenopus tropicalis. PLoS Genet. 2006;2:e91. doi: 10.1371/journal.pgen.0020091. [DOI] [PMC free article] [PubMed] [Google Scholar]
- Grainger RM. http://faculty.virginia.edu/xtropicalis/mutations/cold_shock_gyno.html.
- Grammer TC, Khokha MK, Lane MA, Lam K, Harland RM. Identification of mutants in inbred Xenopus tropicalis. Mech Dev. 2005;122:263–272. doi: 10.1016/j.mod.2004.11.003. [DOI] [PubMed] [Google Scholar]
- Hirsch N, Zimmerman LB, Grainger RM. Xenopus, the next generation: X. tropicalis genetics and genomics. Dev Dyn. 2002;225:422–433. doi: 10.1002/dvdy.10178. [DOI] [PubMed] [Google Scholar]
- Johnson SL, Africa D, Horne S, Postlethwait JH. Half-tetrad analysis in zebrafish: mapping the ros mutation and the centromere of linkage group I. Genetics. 1995;139:1727–1735. doi: 10.1093/genetics/139.4.1727. [DOI] [PMC free article] [PubMed] [Google Scholar]
- Johnson SL, Gates MA, Johnson M, Talbot WS, Horne S, Baik K, Rude S, Wong JR, Postlethwait JH. Centromere-linkage analysis and consolidation of the zebrafish genetic map. Genetics. 1996;142:1277–1288. doi: 10.1093/genetics/142.4.1277. [DOI] [PMC free article] [PubMed] [Google Scholar]
- Kauffman EJ, Gestl EE, Kim DJ, Walker C, Hite JM, Yan G, Rogan PK, Johnson SL, Cheng KC. Microsatellite-centromere mapping in the zebrafish (Danio rerio) Genomics. 1995;30:337–341. doi: 10.1006/geno.1995.9869. [DOI] [PubMed] [Google Scholar]
- Khokha MK, Chung C, Bustamante EL, Gaw LW, Trott KA, Yeh J, Lim N, Lin JC, Taverner N, Amaya E, Papalopulu N, Smith JC, Zorn AM, Harland RM, Grammer TC. Techniques and probes for the study of Xenopus tropicalis development. Dev Dyn. 2002;225:499–510. doi: 10.1002/dvdy.10184. [DOI] [PubMed] [Google Scholar]
- Kile BT, Hentges KE, Clark AT, Nakamura H, Salinger AP, Liu B, Box N, Stockton DW, Johnson RL, Behringer RR, Bradley A, Justice MJ. Functional genetic analysis of mouse chromosome 11. Nature. 2003;425:81–86. doi: 10.1038/nature01865. [DOI] [PubMed] [Google Scholar]
- Klein SL, Strausberg RL, Wagner L, Pontius J, Clifton SW, Richardson P. Genetic and genomic tools for Xenopus research: The NIH Xenopus initiative. Dev Dyn. 2002;225:384–391. doi: 10.1002/dvdy.10174. [DOI] [PubMed] [Google Scholar]
- Krotoski DM, Reinschmidt DC, Tompkins R. Developmental mutants isolated from wild-caught Xenopus laevis by gynogenesis and inbreeding. J Exp Zool. 1985;233:443–449. doi: 10.1002/jez.1402330313. [DOI] [PubMed] [Google Scholar]
- Krylov V, Tlapakova T, Macha J. Localization of the single copy gene Mdh2 on Xenopus tropicalis chromosomes by FISH-TSA. Cytogenet Genome Res. 2007;116:110–112. doi: 10.1159/000097427. [DOI] [PubMed] [Google Scholar]
- Krylov V, Tlapakova T, Macha J, Curlej J, Ryban L, Chrenek P. Localization of human coagulation factor VIII (hFVIII) in transgenic rabbit by FISH-TSA: identification of transgene copy number and transmission to the next generation. Folia Biol (Praha) 2008;54:121–124. doi: 10.14712/fb2008054040121. [DOI] [PubMed] [Google Scholar]
- Morgan TH. No Crossing over in the Male of Drosophila of Genes in the Second and Third Pairs of Chromosomes. Biological Bulletin. 1914;26:195–204. [Google Scholar]
- Naruse K, Tanaka M, Mita K, Shima A, Postlethwait J, Mitani H. A medaka gene map: the trace of ancestral vertebrate proto-chromosomes revealed by comparative gene mapping. Genome Res. 2004;14:820–828. doi: 10.1101/gr.2004004. [DOI] [PMC free article] [PubMed] [Google Scholar]
- Noramly S, Zimmerman L, Cox A, Aloise R, Fisher M, Grainger RM. A gynogenetic screen to isolate naturally occurring recessive mutations in Xenopus tropicalis. Mech Dev. 2005;122:273–287. doi: 10.1016/j.mod.2004.11.001. [DOI] [PubMed] [Google Scholar]
- Perkins DD. The Detection of Linkage in Tetrad Analysis. Genetics. 1953;38:187–197. doi: 10.1093/genetics/38.2.187. [DOI] [PMC free article] [PubMed] [Google Scholar]
- Perkins DD. Tetrads and crossing over. J Cell Physiol Suppl. 1955;45:119–149. doi: 10.1002/jcp.1030450508. [DOI] [PubMed] [Google Scholar]
- Perkins DD. Crossing-over and interference in a multiply marked chromosome arm of Neurospora. Genetics. 1962;47:1253–1274. doi: 10.1093/genetics/47.9.1253. [DOI] [PMC free article] [PubMed] [Google Scholar]
- Postlethwait JH. The zebrafish genome in context: ohnologs gone missing. J Exp Zoolog B Mol Dev Evol. 2007;308:563–577. doi: 10.1002/jez.b.21137. [DOI] [PubMed] [Google Scholar]
- Postlethwait JH, Woods IG, Ngo-Hazelett P, Yan YL, Kelly PD, Chu F, Huang H, Hill-Force A, Talbot WS. Zebrafish comparative genomics and the origins of vertebrate chromosomes. Genome Res. 2000;10:1890–1902. doi: 10.1101/gr.164800. [DOI] [PubMed] [Google Scholar]
- Reinschmidt D, Friedman J, Hauth J, Ratner E, Cohen M, Miller M, Krotoski D, Tompkins R. Gene-centromere mapping in Xenopus laevis. J Hered. 1985;76:345–347. [PubMed] [Google Scholar]
- Sater A, Wells D. 2008 http://tropmap.biology.uh.edu.
- Showell C, Conlon FL. Decoding development in Xenopus tropicalis. Genesis. 2007;45:418–426. doi: 10.1002/dvg.20286. [DOI] [PMC free article] [PubMed] [Google Scholar]
- Singer A, Perlman H, Yan Y, Walker C, Corley-Smith G, Brandhorst B, Postlethwait J. Sex-specific recombination rates in zebrafish (Danio rerio) Genetics. 2002;160:649–657. doi: 10.1093/genetics/160.2.649. [DOI] [PMC free article] [PubMed] [Google Scholar]
- Streisinger G, Singer F, Walker C, Knauber D, Dower N. Segregation analyses and gene-centromere distances in zebrafish. Genetics. 1986;112:311–319. doi: 10.1093/genetics/112.2.311. [DOI] [PMC free article] [PubMed] [Google Scholar]
- Thiebaud CH, Colombelli B, Muller WP. Diploid gynogenesis in Xenopus laevis and the localization with respect to the centromere of the gene for periodic albinism ap. J Embryol Exp Morphol. 1984;83:33–42. [PubMed] [Google Scholar]
- Thorgaard GH, Allendorf FW, Knudsen KL. Gene-Centromere Mapping in Rainbow Trout: High Interference over Long Map Distances. Genetics. 1983;103:771–783. doi: 10.1093/genetics/103.4.771. [DOI] [PMC free article] [PubMed] [Google Scholar]
- Tompkins R, Reinschmidt D. Experimentally induced homozygosity in Xenopus laevis. Methods Cell Biol. 1991;36:35–44. doi: 10.1016/s0091-679x(08)60271-x. [DOI] [PubMed] [Google Scholar]
- Tymowska J. Karyotype analysis of Xenopus tropicalis Gray, Pipidae. Cytogenet Cell Genet. 1973;12:297–304. doi: 10.1159/000130468. [DOI] [PubMed] [Google Scholar]
- Tymowska J, Fischberg M. A comparison of the karyotype, constitutive heterochromatin, and nucleolar organizer regions of the new tetraploid species Xenopus epitropicalis Fischberg and Picard with those of Xenopus tropicalis Gray (Anura, Pipidae) Cytogenet Cell Genet. 1982;34:149–157. doi: 10.1159/000131803. [DOI] [PubMed] [Google Scholar]