

Abstract
Subdural electrodes are frequently used to aid in the neurophysiological assessment of patients with intractable seizures. We review the indications for these, their uses for localizing epileptogenic regions and for localizing cortical regions supporting movement, sensation, and language.
Keywords: Subdural electrodes, implanted electrodes, intracranial EEG recordings, functional localization
INTRODUCTION
If epilepsy were a straightforward disorder, easily diagnosable with site of seizure onset easily localized, patients would not need to undergo complex diagnostic evaluations. For example, removal of mesial temporal structures of patients with mesial temporal lobe epilepsy would always result in seizure control. Many people do very well, and become seizure-free, but many others continue to have seizures despite what we think to have been optimal evaluations and unambiguous localizations of their seizures. Why does this occur? Why don't all of our patients become seizure-free? In many cases, this is because the epileptogenic region could not be completely localized with non-invasive methods. For example, a patient may seem to have temporal lobe seizures, but on scalp electroencephalography (EEG) have involvement that is bilateral at seizure onset, or movement or have muscle artifact that makes it difficult to know on which side seizures actually start. In another patient, non-invasive EEG suggests that seizures come from one lobe, but also suggests that they come from another. In a third patient, the region of seizure onset appears to vary from one event to the next (Spencer et al., 1990; Spencer et al., 1992). In a fourth, scalp EEG or MEG defines areas with epileptiform activity but misses other important areas, perhaps because the areas are located deep below the cortical surface and therefore, in effect, in a place inaccessible to non-invasive recordings.
Modeling of the EEG can help with this (Ebersole and Hawes-Ebersole, 2007; Plummer et al., 2007). Structural techniques such as MRI can help us to look for areas of abnormal cortical morphology (Battaglia et al., 2006; Jansen et al., 2006; Meroni et al., 2009). Often removal of the lesion can have excellent surgical results even after what once would have been thought very limited resections (Wieser and Yasargil, 1982; Hori et al., 1993; Schramm, 2008) but not always (Sisodiya, 2000; Jansen et al., 2006). Why? Perhaps surgery didn t remove enough of the target (Siegel et al., 1990). Another possible explanation is that the abnormal area on imaging may not be the not the same as the area, or all of the area, where the seizures originate. Morphological methods can point to an area that may need to be removed but can't, so far, tell us how much tissue around that area to remove, tell us in which abnormality seizures originate when there is more than one abnormality, or tell us what morphologically normal tissue might also need to be removed. Positron emission tomographic (PET) scans can show areas of abnormal, or at least unusual, metabolic activity but doesn t necessarily tell us which part of that unusual activity arises from where the seizures actually start(Hong et al., 2002). Techniques based on blood flow such as functional magnetic resonance imaging (fMRI) can suggest areas of greater cortical activity, if only by inference, but the time frame of fMRI acquisition is in seconds, and we know that seizure activity can spread widely within seconds. Furthermore, it is often not practical to record ictal events with fMRI due to unpredictability of seizure occurrence and because patients often move during seizures. Markers for neurotransmitters (Fedi et al., 2001; Novotny, Jr. et al., 2003; Savic et al., 2004), and techniques that correlate findings from multiple modalities (O'Brien et al., 1998; Shih et al., 2004; Salamon et al., 2008; Moeller et al., 2009; Jacobs et al., 2009b) may improve our chances of non-invasively defining the epileptogenic region, but these combinations don t always work.
Implanted electrodes are useful when non-invasive methods don t sufficiently define what to resect in a patient, using them because they can record directly from the brain and therefore can help determine the site, sites, or regions of seizure onset with greater precision (Diehl and Lüders, 2000; Koubeissi, 2009). This is a review of subdural electrodes, but sometimes depth electrodes are a better choice. Penetrating depth electrodes can be placed through relatively small openings when compared to the openings for subdural grids or even strips. They have been particularly useful in the case of seizures that appear to arise from archicortex and in which neocortical recording is less important (Spencer, 1989).
However, subdural electrodes might accurately reflect the side of seizure onset when placed in or near mesial temporal structures (Wyler et al., 1984; Spencer et al., 1990; Wyler, 1991) even though the time of onset at subdural electrodes might be later than the time of onset with simultaneous depth recordings, for example from hippocampus (Spencer et al., 1990). Also, subdural electrodes, when implanted in arrays, can be useful in determining the extent of an epileptogenic region. Subdural electrodes can be placed in a variety of locations, including temporally, subtemporally, frontally, subfrontally, within the interhemispheric fissures, and posteriorly. On the other hand they are not ideal when recording from highly vascularized areas, for example, within the sylvian fissure, from subsurface regions such as the insula, or even from the depth of cortical sulci. Although their predecessors existed years earlier in Montreal and St. Louis (Penfield and Jasper, 1954; Goldring, 1978), the current use of subdural electrodes dates back three or four decades (Lesser et al., 1981; Levy et al., 1982; Wyler et al., 1984; Lesser et al., 1987; Wyler, 1991).
THE ELECTRODES
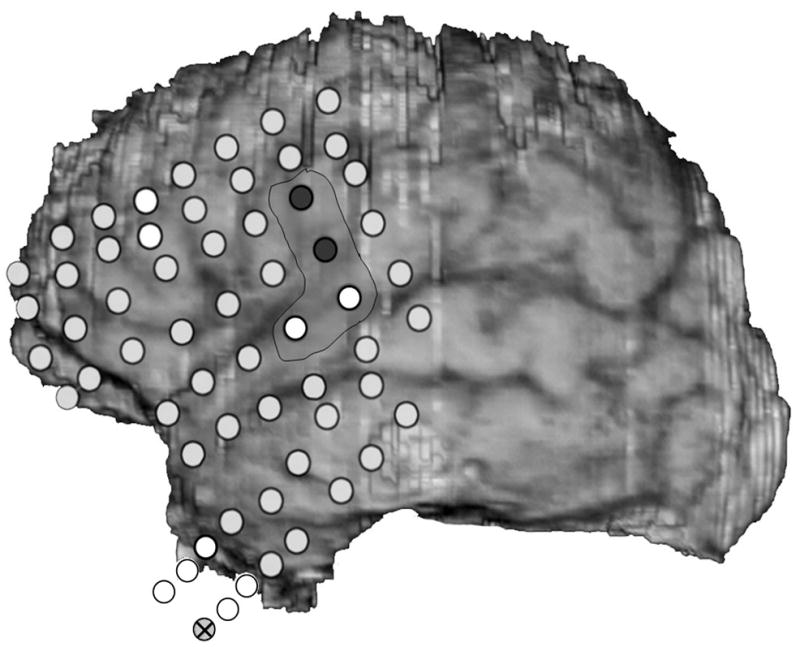
Subdural electrode arrays come in shapes and sizes that can be customized to the needs of individual patients (Fig. 1). Strips of electrodes consist of a single line of electrodes; anywhere from 2–10 electrodes have been used. There is no reason why a longer strip of electrodes couldn't be placed if the longer strip would fit in the head, and would meet a patient s clinical need. Subdural electrode arrays consist of multiple rows of electrodes. Two to eight rows of electrodes are typical, and again depend on clinical circumstances. Electrodes most commonly are configured in straight rows but curvilinear rows can be useful when placing electrodes in regions such as the interhemispheric fissure, for example to record from the cingulate gyrus. Electrodes typically have 2–5 mm diameter exposed to the cortical surface, with centers separated by 1 cm from one another.
Fig. 1.

Subdural electrode placements can vary with the individual. In this patient a large array is present in the center of the figure. On the left of the figure are two “pigtail” wires that come from two subdural strips anterior to the grid. At the bottom are two pigtails from subdural arrays placed below to temporal lobe. Left is anterior, right posterior, cortex. The vertex is superior and basal hemisphere regions inferior. Electrode centers are separated by 1 cm.
A large number of electrodes can be placed, 100 or more in some situations, but even though subdural electrodes do not penetrate the brain, they can exert a mass effect on the brain. With larger arrays, there can be a shift of several millimeters across the midline. Also, because cables run externally from the subdural electrodes, there always is a possibility of infection (Lesser et al., 1991; Arroyo et al., 1993; Salazar and Bingaman, 2008). To reduce the likelihood of this, it is important to carefully close the dural openings around the exiting electrode cables as tightly as possible. In addition, the surgeon should tunnel each cable subcutaneously for a distance from the dura to the scalp opening. Great care should be taken, using meticulous sterile technique, when adjusting or changing the dressings around the patient's head. Cerebrospinal fluid leakage is also a concern; the team should be sure that the patient's head is elevated, to help reduce this likelihood.
Both stainless steel and platinum (usually platinum-iridium) can be used for subdural electrodes. Platinum-iridium electrodes are not ferromagnetic and this can be an advantage with magnetoencephalography (MEG) or magnetic resonance imaging (MRI). Also, there are data suggesting that platinum-iridium might be less prone to electrolysis when electrodes are used for cortical stimulation: stainless steel electrodes continuously stimulated for a period of weeks lose considerable weight, but there is little weight change with platinum-iridium electrodes (White and Gross, 1974). Patients in epilepsy monitoring units are not stimulated continuously, and not for those lengths of time, but the finding of weight changes with lengthy stimulation suggests that smaller losses of stainless steel might occur during the much more limited periods of stimulation that occur clinically.
A limitation of implanted electrodes is that they are fixed in position, separated from one another, and that there is a distance between electrodes. In principle, epileptiform activity occurring midway between two electrodes might be missed by both if the activity has a restricted field. To address this problem, some have used arrays that have both conventionally spaced electrodes and additional electrodes that are smaller in size and more closely spaced. In each patient, the advantage of having more electrodes has to be weighed against the risk of having more wires exiting from the subdural space, but one study found complication rates to be similar to those for conventional electrode arrays (Van Gompel et al., 2008). As this study said, we don t yet know whether the additional electrodes will result in improved surgical results.
Although there are variations among patients and epilepsy centers, fundamentally, one places subdural electrodes to answer one or both of two questions: What should be taken out? What should be left in?
WHAT SHOULD BE TAKEN OUT?
From the practical standpoint, we take "spikes"- epileptiform activity - as representatives of the site at seizure onset, but they often provide an imperfect representation. Implanted electrodes record only from the limited area adjacent to themselves. We don t know what kind of activity might be occurring at the same time or earlier, at other locations that could be nearby or far away. Seizure discharges are more valuable than interictal epileptiform activity in pointing to the site of seizure onset (Asano et al., 2009), but seizures can originate from more than one location, and one or more region of seizure onset might be missed due to the location of implanted electrodes. (Fig. 2) Moreover, not all possibly epileptiform discharges indicate actually epileptogenic regions - there are both “red spikes” and “green spikes”, but we don t always know which is which (Engel, Jr., 1999).
Fig. 2.


Two seizure onsets from two different cortical sites. Fig. 2a shows a seizure originating from the left rolandic region, electrodes LFT23, 31 (filled circles, Fig. 2c) with reflection at and spread to adjacent electrodes. Fig. 2b shows a seizure originating from the left anterior temporal lobe, LBT57, again with spread to adjacent electrodes. Recording was at 200 samples/second and used a 0.5 Hz high pass and 70 Hz low pass filter; the filters were single pole RC filters with 6db/octave rolloff. Fig. 2c shows electrode locations. A 64 electrode grid was in place, with the top 6 rows over the lateral, primarily suprasylvian, cortex and the bottom two rows over the temporal lobe, directed towards, and with the anterior three electrodes in each row wrapped around, the temporal tip. The grid was cut between row 6 and 7 to facilitate placement. Numbering goes from 1 at the upper left, to 8 at the upper right, to 48 at the lower right of the superior six rows (LFT in Fig. 2a and 2b). Numbering for the inferior 2 rows (LBT) goes from 57 for the anterior electrode in the top row to 64 for the posterior electrode in the bottom row. Electrodes LFT 23 and 31 are filled, and electrode LBT57 has an X through it. The “boot” around electrodes LFT 23 and 31 plus two other electrodes indicates where stimulation mapping found motor cortex. Recording display is to a system reference. The patient was 15 years old, with a history of meningoencephalitis 5 years earlier. Seizures began with arousal from sleep and head deviation to the right.
Because they are closer to signal sources, implanted electrodes record brain activity at higher amplitude than is possible with scalp electrodes. Subdural recordings can show focal high or low frequency or electrodecremental activity that can point to the region of seizure onset, just as with scalp recordings, but with greater precision (Alarcon et al., 1995; Ikeda et al., 1996b; Ikeda et al., 1999; Koubeissi, 2009). Electrocorticography with subdural electrodes is much like scalp recordings in other ways: one looks for epileptiform activity and electrographic seizures (Spencer et al., 1992). Normal variants can occur, just as they can with scalp recordings (Arroyo et al., 1992). Moreover, spikes, or at least spike-like discharges, can occur in the hippocampus of normal, awake, non-epileptic rats (Suzuki and Smith, 1987; Suzuki and Smith, 1988). Do they occur similarly in people? This kind of discharge may be a normal feature of brain recordings, at least in some parts of the brain, regardless of whether that brain has produced epileptic seizures. Once again, we may need to differentiate red spikes from green spikes. Interference from noise is usually less, in part because of the higher amplitude of the signal, but contamination from muscle and other artifact sources can occur.
With conventional EEG amplifiers, whether with scalp or implanted electrodes, activity can t usually be recorded above 70–100 Hz. Because of the increased use of implanted electrodes, newer EEG systems allow us to look for and, perhaps not surprisingly, demonstrate high (Fisher et al., 1992; Worrell et al., 2004), or very high (Bragin et al., 1999; Jacobs et al., 2008; Jacobs et al., 2009a), frequency activity in epileptogenic cortex when using sufficiently high sampling rates, generally 500–2000 Hz (although higher frequencies might also be useful). Carefully defined high frequency oscillations (HFOs) localize to the epileptogenic region and appear to be a useful marker of what needs to be removed to control seizures (Jirsch et al., 2006; Khosravani et al., 2008; Crépon et al., 2009; Jacobs et al., 2009c). The HFOs were a better index of epileptogenic cortex than were interictal spikes or the region of seizure onset as defined by conventional electrocorticographic analysis (Fig. 3.). These HFOs could at times occur simultaneously at sites separated by centimeters (Crépon et al., 2009; Jacobs et al., 2009c), which might help explain why some patients are not seizure-free after seizure surgery: we may be removing part, but not all, of the epileptogenic network.
Fig. 3.


Figure 3a shows onset of a seizure from the left anterior frontal lobe. In recordings from this region there were almost constant interictal bursts from LFP1-5 and LOF3-8. The first two dots between the EEG channels from LFP7 and LFP8 occur at the same time as the last interictal discharges before a spontaneous seizure starts. Seizure onset is just before the time of the third dot, particularly at electrodes LFP1-5 and LOF 3-8, and manifested by much faster activity than occurred during the interictal discharges. Voltage appears to decrease at LFP7-8, between the times of dots 3 and 4. We use the four dots to help in orienting between figures; they indicate the same points in time in each of the figures in which they appear. Recording was at 1000 samples/second and used a 0.5 Hz high pass and 300 Hz low pass filter. The filters were second order Butterworth with 12 db/Oct rolloff. Figure 3b shows a time expansion of a portion of the recording in Fig. 3a. In addition to the fast activity just described, there is still faster activity at LFP7-8, where there appeared to be voltage decrement before. This is best seen when voltage is increased. (Compare channels 6 and 8 - showing the EEG at the same amplification as in the other channels - versus channels 7 and 9 - showing the EEG at higher amplification.) Figure 3c shows electrode placement. The numbering for electrodes in each strip is 1–8. Electrode 1 is the most inferior electrode for RLF-RFP-LFP, the most mesial electrode for LOF, and the most anterior electrode for LAT. For LFG, 1 is the most anterior and 8 the most posterior electrode on the top row; the most anterior and posterior electrode for the fifth row are 33 and 40 respectively. The 64 electrode grid was cut between rows 5 and 6, and the most anterior electrode for row 6 is 41, the most anterior electrode for row 8 is 57, and the most posterior electrode for row 8 is 64. In this patient, electrode LOF1 was used as the ground; LFP4 was not functioning properly. Recording display is to a system reference. Seizures persisted after resection of the region showing conventional epileptiform activity in Fig. 3A. The patient became seizure free after a second resection 18 months later, that was posterior to the first, and included LFP7-8 and LOF8.
Figures 3d and 3e are visualizations of the contributions of higher frequencies to the EEG in this instance. Fig. 3d shows 70–200 Hz and Fig. 3e 214-300 Hz activity. There is a gap between 200 and 214 Hz to avoid frequency overlap. Activity in the 70–200 Hz frequency range begins about 200 msec before the third dot in a number of channels, particularly LFP1-3, LOF7-8. Some activity in the 214-300 Hz range appears at LFP2 at the same time, but this becomes widespread at about the time of the third dot and in particular is at LFP7-8 and LOF8, lasting about 3 seconds. These figures use an enhanced display method to preserves the amplitude of the high frequency information at conventional time resolutions. First we use a high pass digital filter to suppress low frequency signals. This then sets the bandwidth of our high frequency observation. Next for each successive group of ten samples we note the maximum and minimum values. The display process then draws a vertical between each maximum and minimum pair for each group of ten original data points. Thus the range of amplitudes is preserved even as the data rate for the data stream is reduced. Other methods of display at standard time resolutions can in effect filter out this information. For example, typical computer screens can only manage 100 pixels per second of data when displaying EEG traces conventional resolutions analogous to 30 mm/second for paper EEG. This is due to the pixel size of the display monitor. When sampling the original EEG at 1000 sample/second, the display can only show one data point in ten. In effect this down samples the EEG by a factor of ten because of the screen display rate. Any data above the Nyquist frequency (i.e. half sample rate) of the screen display rate is lost or distorted. Typically there are two other display methods used to reduce high sample rate data for display. Decimation uses only one sample in 10 and results in aliasing of frequency components above Nyquist frequency. Averaging of successive groups of 10 samples produces a data stream of one tenth the sample rate and effectively filters out any high frequency components. Neither method is ideal for showing the amplitude of any high frequency information present in the EEG.
Fig. 3f shows activity at LFP8. EEG activity is at the top. The bottom uses a color display to show that activity in different frequency ranges appears and disappears at different times during the recording. The Y axis indicates frequency using a logarithmic scale. The X axis indicates elapsed time in seconds. The colors indicate amplitude in log microvolt units, as shown at the bottom.
Fig. 3g and Fig. 3h show progressively more channels of the recording, with fig. 3h showing all the recorded channels.
The patient was 39 years old, with seizures since age 20; there was no known cause. Seizures began with anxiety, tingling in the shoulders and loss of ability to interact appropriately. An MRI had shown possible increased T2 signal in, and decreased size of, left mesial temporal structures. PET scan had shown bilateral hypometabolism sparing an area in the left temporal lobe at a time with frequent seizures, and mildly reduced fluorodeoxyglucose uptake in the left mesial temporal region in a second study 19 months later, but before the first grid placement and frontal resection. Seizure onset did not include the mesial temporal lobe, temporal lobe was not removed, and the patient became seizure free after the second frontal resection.
One study did not record HFO from the neocortex (Crépon et al., 2009), but another did (Jacobs et al., 2009c). Are these differences due to the nature of the lesions underlying the seizures in different patients? Did electrode placements differ from the practical perspective? Were the working definitions of HFOs different? Do HFO only occur in epileptogenic cortex, or can they occur elsewhere? Perhaps high frequency oscillations of a particular type are a marker of morphological changes of a particular type in a brain of a particular type. It will be important to have strict definitions for HFOs that distinguish red from green oscillations. A computer algorithm based strategy might provide a strict definition of high frequency oscillations and thus allow us to correlate strictly defined waveforms with particular structural morphologies, with other markers of epileptogenesis, and with outcome.
Direct current (DC) recordings of epileptogenic cortex can document surface negative DC shifts at ictal onset, occurring in the locations where electrodecremental changes occur (Ikeda et al., 1999). These observations occurred before the studies of HFO, but suggest that HFO and slow DC shifts might occur together within the epileptogenic region.
There is an older, but inconsistent, literature regarding the value of stimulation for identifying epileptogenic cortex (Jacobs et al., 2010). Recent studies report that single pulse stimulation can produce single responses after a 100 –1000 milliseconds delay and can produce repetitive responses, when stimulating epileptogenic brain; these might help identify epileptogenic cortex in some patients (Valentin et al., 2005a; Valentin et al., 2005b). Another study used 3–4 second trains of 60 hz stimulation and found that sites at which electrical stimulation provoked seizures often were sites at which HFO also occurred (Jacobs et al., 2010). These methods of stimulation therefore may improve our ability to identify epileptogenic cortex. When these methods are better understood they could be especially useful when seizures are not occurring during monitoring, or when seizure localization isn t clear.
WHAT SHOULD BE LEFT IN?
Epileptologists accept the use of surgery to treat medically intractable epilepsy, but know that surgery can have adverse effects due to removal of functionally important tissue. Functional mapping through subdural electrodes is a tool to make adverse effects less likely. Its role is to help the epileptologist decide when, where, if, and how to operate, or not operate, keeping in mind that certain types of adverse effects, for instance the nonspecific memory difficulties that patients often report after epilepsy surgery, are not necessarily predicted by cortical mapping techniques (although some methods of doing this may help). This means that both advantages and limitations of mapping techniques have to be kept clearly in mind.
There are two ways of using physiologic techniques to assess the safety of resection. The first way is to alter the brain and then assess if and how behaviors change. The second is to alter the behaviors and assess if and how brain changes.
Alter the brain - General considerations
Standard mapping with subdural electrodes uses electrical stimulation to determine where functional (e.g. motor, sensory, cognitive, or language) changes occur, or don't occur, in response to stimulation. The stimulation typically consists of alternating polarity square wave pulse trains. Many centers use 0.3-ms duration pulses, repeated at 50 pulses/sec and with train durations of about 2–5 seconds (Lesser et al., 1994), but pulse duration, pulse repetition rate, and train duration vary among epilepsy centers and according to specific clinical circumstances (Lesser et al., 1984b; Ojemann et al., 1993; Jayakar and Lesser, 1997; Zangaladze et al., 2007; Motamedi et al., 2007; Lucas et al., 2008).
Finite element modeling has shown that stimulation via subdural electrodes largely affects the area under the stimulated electrodes (Nathan et al., 1993a). (Fig. 4) This is helpful in the sense that functional changes with stimulation likely relate to changes at the stimulated sites. On the other hand, finite element modeling also shows that stimulation doesn t necessarily assess what is occurring midway between two stimulated electrodes, unless they are very close to one another. For subdural electrodes used in many laboratories, that have 2–3 mm exposed to the cortical surface, and that have center-to-center distances of 10 cm, current density is much less half way between the electrodes, compared to that at the edge of the electrodes. This drop in current density is enough that stimulation might not alter functions modulated by sites midway between the two electrodes. Arrays such as those mentioned above, with smaller and more closely spaced electrodes, are one way of addressing this problem.
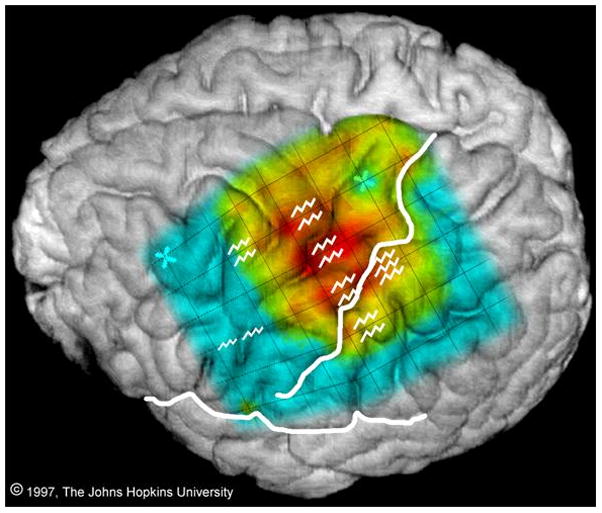
Fig. 4.
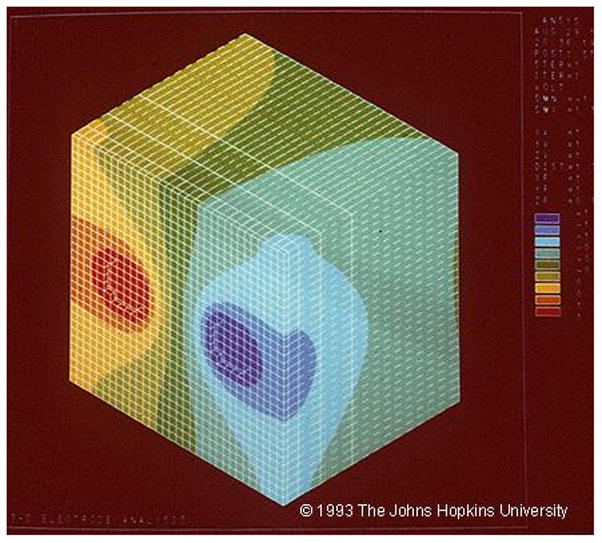
Finite element modeling, showing the normalized change in potential in response to current applied between a pair of adjacent electrodes, separated by 1 cm. The colors indicate normalized change in voltage, with red +1, blue -1. From Nathan et al., unpublished data, Fig. 4 is © 1993 The Johns Hopkins University. For more details on this, see Nathan et al. (1993a); Nathan et al. (1993b).
Cortical stimulation can produce afterdischarges (EEG activity which occurs in response to stimulation and which resembles spontaneous clinical electroencephalographic seizure discharges) (Lesser et al., 1984b). From the practical point of view, afterdischarges interfere with testing. If afterdischarges occur at the same time as a functional change, one often cannot be sure whether the change is due to alteration of a function modulated by the stimulated site or if it is occurring because of the afterdischarges, especially if the afterdischarges have spread to other areas of the brain. On the other hand, the effects of stimulation most likely spread whether or not there are afterdischarges. Although the results of stimulation have been found to be quite accurate (Sanes and Donoghue, 2000), this localization ambiguity is inherent in stimulation testing, may be increased when afterdischarges occur, and should always be considered when making clinical decisions.
The intensities for afterdischarges or functional alterations differ among stimulated electrode sites and among stimulation trials, in one study varying from 2–15 milliamperes, 15 mA being the limit of the stimulation equipment (Lesser et al., 1984b). In that study, extraoperative afterdischarge thresholds could vary between adjacent electrodes by as much as 9.5 milliamperes in the frontal, 8 milliamperes in the parietal and 12 milliamperes in the temporal lobes, and functional alteration thresholds could vary between adjacent electrodes by as much as 10.5 milliamperes in the frontal, and 5.5 milliamperes in the parietal lobe and temporal lobes. That study found similar variations when testing two patients intraoperatively (Figs. 5a and 5b) Another group found similar variations in intraoperative settings, with afterdischarge thresholds varied between adjacent electrodes by as much as 11.5 milliamperes, and functional alteration thresholds by as much as 12.3 milliamperes (Pouratian et al., 2004).
Fig. 5.
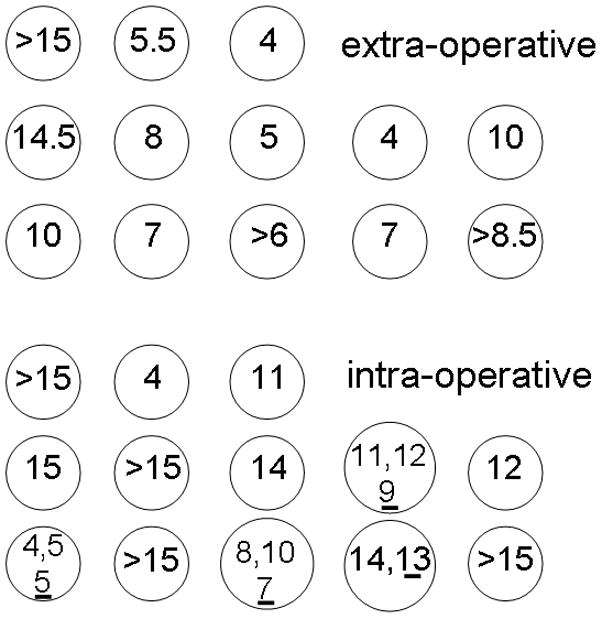
a) Comparison of extraoperative and intraoperative afterdischarge thresholds in a patient. During surgery, stimulation was as close as possible to the sites stimulated by the grid electrodes, doing this by placing ball electrodes directly over the subdural grid electrodes, then removing the grid, and placing the ball electrodes on the brain. In that patient extra-operative afterdischarge thresholds could vary by as much as 9.5 milliamperes and intraoperative thresholds by as much as 11 milliamperes between adjacent electrodes. The underlined numbers indicate thresholds 5 minutes after discontinuation of nitrous oxide. b) Intraoperative thresholds during functional testing in another patient. There was a 4.5 milliampere difference in functional thresholds between electrode pairs that were diagonally adjacent to one another. From Lesser et al., Epilepsia 25:615–621, 1984. With permission, Wiley-Blackwell (Lesser et al., 1984b).
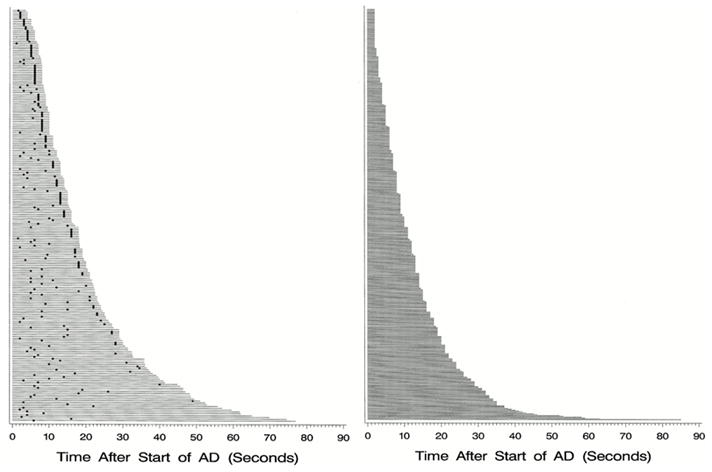
For these reasons it is best to begin stimulating at each new site at low intensity, and gradually increase. We usually increase the stimulation intensity by 0.5–1 milliampere at each step. If afterdischarges occur, we may lower the intensity by 0.5–1 milliampere and stimulate again. This often helps to avoid additional afterdischarges. Reducing the frequency of the stimulation train, for example to 5–10 hz, also can reduce afterdischarge occurrence (Zangaladze et al., 2007). Afterdischarge thresholds can vary within seconds, occurring during one trial, but not during the next, and the distribution of electrodes showing afterdischarges can vary among trials, even consecutive trials (Fig. 6) (Lesser et al., 2008), so monitoring for afterdischarges needs to continue throughout the stimulation session. If afterdischarges occur, brief pulses of stimulation, lasting less than a second and delivered through the same electrodes that caused the afterdischarges, can stop the afterdischarges about half the time (Fig. 7) (Lesser et al., 1999).
Fig. 6.

Afterdischarge responses at three stimulated electrode pairs. Within each of the three subfigures, each rectangle, with enclosed dots, blue circles and red diamonds, plots the location of afterdischarges after a single stimulation trial. Each subfigure shows all trials with afterdischarges due to stimulation of that electrode pair. There are numbers between each pair of plots. These numbers indicate how many trials without afterdischarges occurred between that pair of trials. The numbers under each plot indicate minutes (m) or seconds (s) between that trial and its predecessor. Red diamonds=stimulated pair. Blue circles=sites with afterdischarges. Responses vary in (A) and (B), whereas stimulation intensity remained stable. It was 15mA for all plots in (A), 14mA for all plots in (B). Responses vary little in (C), even though stimulation intensities did: 11, 14 and 13mA for plots 1, 2 and 3, respectively. Therefore, afterdischarge distribution is not explained by stimulation intensity alone. At times, plots can resemble one another, for example, the second and third plots in (A), and the last two plots in (B), but we saw no systematic overall pattern of recurrence, for example explainable by stimulation order or intensity. From: Lesser RP, Lee HW, Webber WR, Prince B, Crone NE, Miglioretti DL. Short-term variations in response distribution to cortical stimulation. Brain 2008 131:1528–1539, by permission of Oxford University Press.
Fig. 7.

a) Afterdischarges (AD) occurred in this patient in response to stimulation. The two dots at the bottom indicate when each of two brief pulses of stimulation (BPS) were applied. The first was unsuccessful, but the second successful in stopping the afterdischarges. This method can terminate ADs, but works only about half the time, as shown in Fig. 7b.
b) Duration and treatment latency of each individual trial during which a brief burst of pulse stimulation (BPS) was applied. Each horizontal line indicates a separate trial. The x-axis indicates the time after BPS application. The responses are arranged from top to bottom by total afterdischarge (AD) duration. Left: Duration of each individual trial during which BPS was applied. The dot represents the time that BPS was applied. The horizontal line extends 2 seconds past the dot in all cases because of blocking of the amplifier channels, lasting about two seconds after stimulation ended, during which time we could not know whether ADs were or were not continuing. Right: Duration of each individual trial during which BPS was not applied. BPS could stop ADs regardless of the treatment latency, might not stop ADs regardless of the treatment latency, and might stop spontaneously. However, ADs were significantly more likely to stop after BPS.
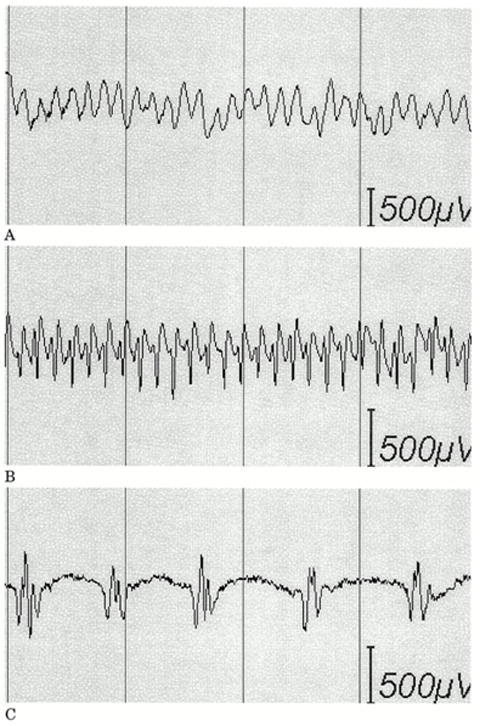
c) Examples of types of afterdischarges that can occur in response to stimulation. (A) Continuous rhythmic epileptiform activity (epileptiform activity with an overall sinusoidal or semisinusoidal appearance); (B) rapidly repeated spikes without an overall appearance of a simple sinusoidal waveform; and (C) discrete individual spikes or polyspikes (discharges separated by at least several hundred milliseconds).
Figures 7b and 7c are from Lesser RP, Kim SH, Beyderman L, Miglioretti DL, Webber WRS, Bare M, Cysyk B, Krauss G, and Gordon B. Brief bursts of pulse stimulation terminate afterdischarges caused by cortical stimulation. Neurology 1999. 53:2073–2081, with permission, Lippincott Williams & Wilkins.
Cortical stimulation, used in this manner to assess the safety of resection, itself seems safe. In one study, all stimulation occurred between electrodes over sites where functional information was needed and another electrode, in the anterior temporal lobe, which was known at the time of testing to be within the boundaries of the planned cortical resection, although the final extent of the resection was not yet known (Gordon et al., 1990). This site, stimulated a greater number of times than would occur under usual circumstances, showed no chronic changes suggesting neuronal injury. There were accumulations of inflammatory cells in the pia arachnoid, as expected due the presence of the subdural electrode grid, a foreign body.
Could stimulation through subdural electrodes cause kindling - activation of chronic epileptiform activity due acute or subacute stimulation through the electrodes? Afterdischarge thresholds can either increase or decrease both during a single testing session and over the days of testing (Lesser et al., 1987). Afterdischarges can occur at single electrode sites with none at neighboring sites (Lesser et al., 2008). Stimulation of an electrode pair in seizure monitoring units recurs over seconds or minutes. In contrast, with the kindling model, the threshold for afterdischarges gradually decreases, and stimulation usually is more intermittent, for example occurring once a day (Racine, 1978). Primates often are more difficult to kindle than other animals (Wada et al., 1978). All of these, taken together, suggest that the stimulation methods used for functional testing of patients in epilepsy monitoring units are unlikely to result in permanent changes in the brain excitatory threshold.
Alter the Brain - Methods of Functional Testing
There are two basic paradigms that can be used when stimulating the brain to test for function. One is to ask the patient to begin a task and then stimulate, seeing whether stimulation interferes with that patient's ability to perform the task. The second is to begin stimulating and see whether the patient can perform a task, or can perform several tasks sequentially, during stimulation.
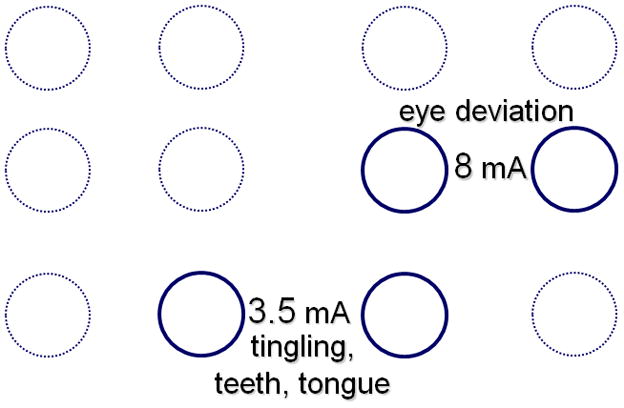
Motor and sensory testing can use either method. The classic task asks patient to do nothing. Then stimulation occurs and both the patient and the examining team see whether any motor or sensory changes occur, such as twitching, increased tone, or tingling of a body part. Also, one can test for motor inhibition. In this case the examiner asks the patient to begin a task, such as wiggling of the fingers, or repetitive horizontal movements of the eyes (Lüders et al., 1988). The examiner then sees whether these activities continue during stimulation. In either case, if any symptom or sign begins or any activity stops with stimulation, the inference is that the area stimulated was important in controlling or modulating that activity. Testing of this type has been performed since the 19th century (Polkey, 2009), but was intensively developed at the Montreal Neurological Institute in the 20th (Penfield et al., 1954).
The functional map derived from this testing is the well-known homunculus, often cartooned as a body representation with head, mouth, and tongue closest to the sylvian fissure and arms, body, and leg occurring as one progresses superiorly and away from the sylvian fissure. The assumption often is that this is a steady progression from one location to the next, similar to what we can see when we look in the mirror, but upside down. Fig. 8 shows test results on an individual patient: the progression of body parts is not quite as neat as might have been expected from the homunculus. For example there is a head representation superiorly, adjacent to the representation for trunk and arm. Inferiorly hand, finger, and tongue representations are near each other and foot representation is near representation for the eye. Table 1 shows findings in the Penfield and Jasper classic, "Epilepsy and the Functional Anatomy of the Human Brain" (Penfield et al., 1954). The first column of table 1 shows a summary from that book of the cortical locations where stimulation produced sensory responses referable to various body parts. Teeth, gum and jaw representation is superior to that for the tongue and mouth. The second shows sensory representation in an individual patient; tongue representation is superior to that of teeth gums and jaw. The third shows representation in another patient; mouth representation is superior to that for the lower lip, and also inferior to it, but all three are superior to representation of the tongue. Similar variations occur when checking among a larger number of patients (Uematsu et al., 1992). In other words there is not a stable and standard representation of body parts, and an individual patient s functional representation will not necessarily match the classic homunculus.
Fig. 8.
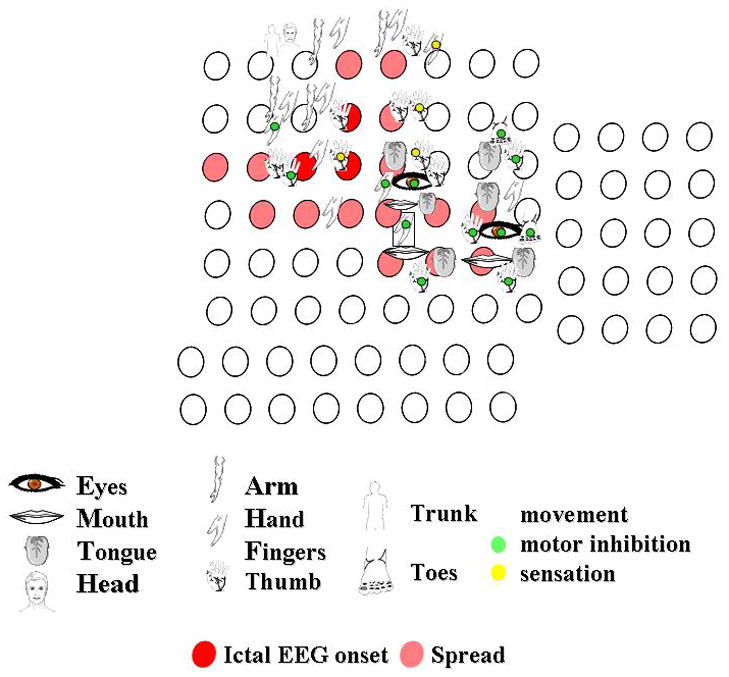
Responses to stimulation of the right peri-rolandic cortex. The figures indicate the body part stimulated. The green circle indicates that motor inhibition occurred, the yellow circle indicates where stimulation produced a sensory change. Other responses to stimulation were clonic or tonic movements. Each circle indicates an electrode. Circles filled red indicate where seizures began, those filled pink indicate seizure spread, in this patient with seizures originating in the motor cortex.
Table 1.
The table compares the overall distribution of the sensory map posited in Epilepsy and the Functional Anatomy of the Human Brain (Penfield et al., 1954) with maps of two individual patients, reported in the same book. The relationship between specific functional areas on page 71 is similar to that found in the two patients, but the sequences are not identical.
| Sensory Map | Case L.G. | Case E.C. |
|---|---|---|
| Page 71 | page 135 | page 139 |
| upper lip | mouth | |
| lips | lips | lower lip |
| lower lip | lower lip | mouth |
| teeth gums jaw | tongue | tongue |
| tongue | teeth gums jaw | |
| mouth | ||
This could be because body representations in the brains of persons with epilepsy differ from those in other people. However basic neuroscience supports the idea that representations of the body in peri-rolandic cortex are not quite as set as we may have learned in school, and that the homunculus map is an oversimplification (Schott, 2006). The maps are not static, and representations of body parts do not separate from one another in a simple way.
This doesn t seem to be an artifact of the testing method. As one review said, “Reservations about the artificial nature of electrical stimulation are clearly warranted when defining the organizing features of the motor map. However, evidence from neural recordings, pharmacological inactivation, and connectional studies all reveal that the distributed nature of MI subregion organization is consistent with that identified by intracortical electrical stimulation mapping….The intrinsic horizontal neuronal connections in MI are a strong candidate substrate for map reorganization: They interconnect large regions of MI, they show activity-dependent plasticity, and they modify in association with skill learning. These findings suggest that MI cortex is not simply a static motor control structure…when assembled into a comprehensive map, sites for any particular body part appear widely distributed, multiple, and overlapping” (Sanes et al., 2000). Another review said: “It has been clear for almost two decades that cortical representations in adult animals are not fixed entities, but, rather, are dynamic and are continuously modified by experience” (Buonomano and Merzenich, 1998). In keeping with this, a recent paper (Lee et al., 2009) reported a patient in whom body representations for motor function, tested with stimulation, varied between two admissions, two years apart.
Language testing uses a variety of tasks (Fig. 9), including reading, writing, naming, comprehension, spontaneous speech, and repetition. In some cases, such as naming, stimulation begins and then the examiner shows objects, or illustrations of objects (Penfield et al., 1954; Ojemann, 1979; Lesser et al., 1984a; Lesser et al., 1994), or describes the object verbally (Lesser et al., 1994; Hamberger et al., 2005), and the patient then tries to name the object. In other cases, such as with spontaneous speech, the patient begins speaking and the examiner sees whether speech arrest occurs with stimulation (Lesser et al., 1984a; Lesser et al., 1994). One group stimulated and asked the patient to read a word. They then stimulated again, asking the patient to read a sentence. They then stimulated a third time and checked whether the patient could recall the word (Ojemann and Dodrill, 1985). With this method they assessed both naming and short term verbal memory and found that they could interfere with these functions at sites beyond the traditional language areas. They also have argued that when surgical resections come close (within 2 cm) to sites identified this way, a patient is more likely to have postoperative memory difficulties (Ojemann, 1979; Ojemann et al., 1985). Another group, however, used visual naming to define language sites and concluded that postoperative visual naming deficits correlated with hippocampal but not neocortical removal (Hamberger et al., 2010a), particularly in patients without preoperative hippocampal sclerosis. In a second study, they confirmed this, compared visual and auditory naming, and concluded that no change in the latter was likely after anteromesial temporal lobe resections (Sherman and Wiebe, 2010; Hamberger et al., 2010b), if stimulation-identified auditory naming sites were not removed (Hamberger et al., 2005). Overall, these results indicate that stimulation can predict some kinds of post-resection memory changes, but that the relationship between stimulation results and post-operative language function are complex and probably modality specific.
Fig. 9.

Results from mapping the left lateral neocortex. This is the same patient as shown in figure 3, and shows electrode placement during the second surgical admission. The brown area anteriorly indicates the first resection and the cross-hatched brown area the second cortical resection eventually performed. C, comprehension; L, lip; M, mouth; N, naming; R, reading; S, spontaneous speech; T, tongue; y, respiratory inhibition; #, psychic change but not typical seizure. Psychic changes were manifested by hearing voices during the first admission (electrode labelled CNRS#), by a feeling of separation. Upper case means a positive change, such as muscle twitching, or tingling sensation with stimulation. Lower case means negative change, such as inhibition of movement. With the exception of y, all motor and sensory findings were on the other side of the body. Reproduced from J Neurol Neurosurg Psychiat, Lee et al. 80:285–290, © 2009, with permission from BMJ Publishing Group Ltd.
Primary language areas are usually near the traditional locations such as Broca's area and Wernicke's area, but regions with language function can be found in other cortical sites. Language sites may reorganize in patients with cortical lesions (Lucas et al., 2008), but no reorganization occurred in one patient who underwent two surgical resections, two years apart, to treat intractable seizures (Lee et al., 2009).
There is a third language area, sometimes called the basal temporal language area, described by Penfield and Roberts (Penfield and Roberts, 1959) as well as more recently (Lüders et al., 1986b). This area includes the inferior temporal, fusiform, and parahippocampal gyri, and can be anterior to lateral temporal speech areas (Burnstine et al., 1990). Penfield and Roberts (Penfield et al., 1959) described a patient who had temporary aphasia when her resection occurred in the mid to posterior basal temporal region. In another study, a patient had one year of post-operative dyslexia after resection of portions of the basal temporal language area during temporal lobectomy (Burnstine et al., 1990). It is possible that some of the memory or language deficits that occur after standard temporal lobectomies could be related to resection of this area.
Alter the behavior
Cortical stimulation briefly alters brain activity and assesses behavioral changes caused by this. Testing with event-related potentials and event related frequency analysis record a particular behavior when it occurs, and then assess the activity of the brain during that behavior. Event-related potentials assess these brain changes by averaging recorded potentials or fields in the time domain; spectral analysis methods assess brain changes in both the time and frequency domains, but the time resolution is typically less than with event-related potentials.
With standard evoked potential methods, the signal to the computer is simultaneous with electrical stimulation of a nerve such as the median nerve, to flash or pattern stimulation of vision, or to sound or click stimulation of hearing (Lüders et al., 1986a). In the case of event-related potentials, the signal to begin averaging is tied to a timed instruction to the patient, but may precede it. The patient may be instructed to move a particular muscle or muscle group, or to read, name, or remember. Averaging is used to determine whether there is a common brain response before, during, and/or after the signal to the patient.
For example, perirolandic pre-movement potentials can occur with voluntary finger movements, and (probably) post-rolandic pre- and post-movement responses, with both active and passive movement (Lee et al., 1986). These locations are consistent with the idea that the former relates to motor preparation before, and the latter to sensory feedback after, a movement. Movements of body parts including tongue, fingers, hand, and foot can produce contingent negative variations and Bereitschaftspotentials. Just as the motor map is more widespread than might have been anticipated from the standard homunculus, these responses can occur in multiple discrete cortical regions, which most likely cooperate in generating the motor response, and may reflect different aspects of decision making, motor preparation and execution, and sensory feedback (Ikeda et al., 1996a; Hamano et al., 1997; Satow et al., 2003).
The easiest way to evaluate responses with this kind of paradigm is first to see whether or not a response occurs and then see where and when the response is largest. The assumption is that where the response is largest correlates with where the experimental paradigm causes maximal brain activation. This, however, assumes that largest = most important. It is equally possible that earliest = most important, even if lower in voltage. Both possibilities need to be kept in mind. Second, the testing paradigm might result in either enhancement or suppression of a particular neurophysiologic activity; see below. Third, the locations of sites where responses are evoked can be widespread and overlapping, just as is the case with cortical stimulation (Farrell et al., 2007). Fourth, as might be expected from widespread activation, and from the results of stimulation, a given site can respond to more than one type of stimulus. In one study of somatosensory, auditory, and visual evoked potentials, single electrodes could respond to up to 5 different modalities (Matsuhashi et al., 2004). These possible ambiguities need to be considered when interpreting results.
The brain also can be studied using spectral analysis(Pfurtscheller and Andrew, 1999; Pfurtscheller and Lopes da Silva, 1999; Pfurtscheller, 2001). This involves first converting electrophysiological signals into the frequency domain. One then can average results across experimental trials. Conversion into the frequency domain can be accomplished with many different algorithms (Fourier transform, wavelets, complex demodulation, matching pursuit, etc), each having unique strengths and weaknesses. As with event-related potentials, this was first used with scalp EEG and MEG, but has since been used to study intracranial EEG signals. This approach usually looks for event-related increases or decreases in time- and frequency-specific signal energy, or power (signal amplitude squared), averaged over a series of trials. Because such power changes were originally observed in relatively narrow frequency bands and were thought to depend on synchronization of neural activity in narrow-band oscillations, power increases and decreases were commonly termed event-related synchronization (ERS) and desynchronization (ERD), respectively. Either can occur, so that the neurophysiologic signature for a particular behavior might be “less” activity within a particular frequency band.
Using this method, event-related changes during visually paced isometric muscle contractions performed by different body parts often overlapped with sites where responses in the same body parts occurred with cortical stimulation (Crone et al., 1998a; Crone et al., 1998b). However the two were not the same (Fig. 10). Responses of a particular body part to cortical stimulation of a site could occur despite little or no change in the event related EEG, and event-related spectral responses to movement of a body part could occur at sites where stimulation did not affect function of that same body part. Consistent with this, another study found significant coherence between electrocorticographic and electromyographic recordings at specific frequencies, but electrodes showing coherence were not necessarily those where stimulation had affected the same body part (Marsden et al., 2000) With some methods, spectral responses at high frequencies (e.g. 70–100 Hz) may be more specific for the place and timing of expected brain activation than responses at lower frequencies (e.g. 8–13 Hz) (Crone et al., 1998a; Crone et al., 1998b; Sinai et al., 2005). It is possible that synchronization at specific frequencies at specific sites might reflect linking of those sites as they prepare for or execute specific tasks (Marsden et al., 2000).
Fig. 10.
Comparison of sites where stimulation produced movement of the right arm or hand (jagged lines) with event-related spectral responses in the alpha band (power suppression, i.e. ERD, at 8–13 Hz) generated by finger wiggling. There is considerable overlap, but the sites are not identical. From: Crone NE, Miglioretti DL, Gordon B, Sieracki JM, Wilson MT, Uematsu S, and Lesser RP. Functional mapping of human sensorimotor cortex with electrocorticographic spectral analysis I. Alpha and beta event-related desynchronization. Brain 1998121:2271–2299, by permission of Oxford University Press.
Although most recent studies have focused on power increases in high frequency intracranial signals (Crone et al., 2006), power changes in lower frequencies may also provide useful information. For example, during simple language-related tasks such as picture naming or auditory word repetition, cortical activation reflected by alpha ERD may be observed to rapidly move from one brain region to another over the course of 1–2 seconds. With picture naming (Fig. 11), superior temporal cortex is involved, perhaps because the patient uses this to think about the required word; later frontal operculum is involved perhaps because the patient is speaking the word; then superior temporal cortex is involved again, when the patient hears the word spoken. This is expected, given the tasks performed.
Fig. 11.
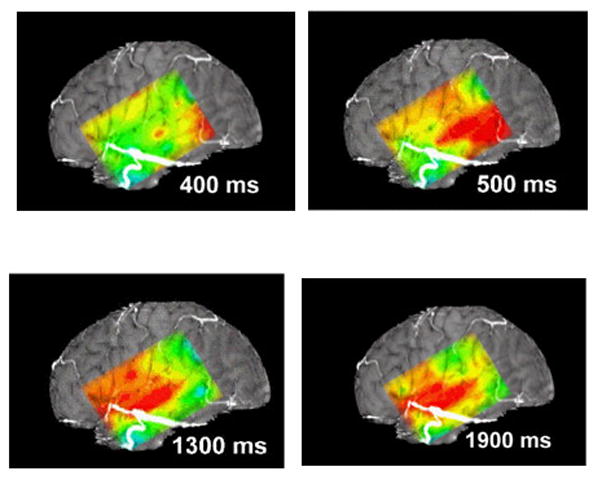
This figure diagrams the distribution of alpha suppression (ERD) during naming, as mapped using a subdural grid. The continuous color map is interpolated: actual data was from the 6x8 electrode array. The figure uses a standard “rainbow” color scale, where red indicates the greatest and blue the least suppression. At 400 and 500 msec suppression is present at the posterior inferior portion of the grid, perhaps during retrieval of the name of the object in the picture presented to the patient. At 1300 msec suppression is marked over the anterior-superior portion of the grid, perhaps corresponding to cortical control of articulation, and there is suppression over the more central portion of the grid, overlying the temporal auditory cortex, perhaps because the auditory system hears the word being articulated (self-speech). At 1900 msec alpha suppression is less marked anteriorly, but continues to be present in the central portion of the grid. See the Supplementary Videos S1 and S2 for animations of cortical responses during naming and auditory word repetition.
There needs to be continued refinements of these kinds of methods, but they are developing into useful clinical tools (Sinai et al., 2005; Brunner et al., 2009). For example, using machine learning classification methods, analysis of frequencies above 50 hz were accurate about 88% of the time in discriminating between movements of different fingers during single trials (Scherer et al., 2009). The method could discriminate not only contralateral but also ipsilateral hand movements, suggesting that the method might be useful for developing brain-computer interfaces for persons who have lost motor control due to damage to a hemisphere. It is possible that a combination of spectral responses in different frequencies will be needed to achieve the most accurate maps of functional brain activation.
COMMENTS
Subdural electrodes have disadvantages. Subdural arrays can exert a mass effect on the brain. There can be cerebrospinal fluid leakage through the openings in the dura where the electrode cables exit, and these openings can be sources of infection. The electrodes don t necessarily tell us enough to insure complete seizure control, in part because implanted electrode placement is based on what we learned about the patient beforehand, and this information may also be imperfect.
Despite these limitations, their use allows recordings directly from the brain and often allows detailed mapping of epileptogenic regions, of regions important for motor, sensory, or language function, and of the relationship between them. In some patients, this allows larger than usual resections to occur, in others smaller than usual resections. The goals of these are more precise surgical resections, with improved post-operative seizure control and reduced risk of post-operative deficits.
Experience with implanted electrodes has highlighted questions that need to be answered in the future. Neither epileptogenic nor functional regions are static entities (Spencer et al., 1990; Spencer et al., 1992; Lesser et al., 2008; Lee et al., 2009). From the practical point of view we need to better understand whether areas of concern are those where activity initially occurs in recordings, where there is a certain amount or type of neurophysiologic activity or inactivity, or where some other combination occurs. We need to better understand how regions coordinate both in producing seizures and in controlling normal function, how and why the location of these regions may change over time, and why seizure continue after seemingly optimal resections.
Nonetheless, in the proper setting, and with carefully obtained and properly analyzed data, testing with subdural electrodes can help the epileptologist to determine the safe boundaries for a cortical resection, and can help the investigator in understanding the functional anatomy and neurophysiology of the brain.
Supplementary Material
Animation of the cortical distribution of alpha suppression during naming. This is a full animation of the cortical responses, from which figure 9 was derived. The animation uses a standard “rainbow” color scale, where red indicates the greatest and blue the least suppression. Measurement of alpha suppression occurs in 100 msec intervals. Suppression occurs posteriorly during early portions of the animation, perhaps due to word retrieval, and later occurs anteriorly, during articulation.
Animation of the cortical distribution of alpha suppression during word repetition, as recorded from a 6x8 electrode array. The animation uses a standard “rainbow” color scale, where red indicates the greatest and blue the least suppression. Suppression occurs posteriorly when the patient first hears the word, then anteriorly when the patient repeats the word, then spreads posteriorly when the patient hears the word which just has been articulated.
Acknowledgments
The quotations from Buonomano and Merzenich (1998) are reprinted, with permission, from the Annual Review of Neuroscience Volume 21, © 1998 by Annual Reviews; www.annualreviews.org. The quotation from Sanes and Donoghue (2000) is reprinted, with permission, from the Annual Review of Neuroscience Volume 23, © 2000 by Annual Reviews; www.annualreviews.org.
Footnotes
Publisher's Disclaimer: This is a PDF file of an unedited manuscript that has been accepted for publication. As a service to our customers we are providing this early version of the manuscript. The manuscript will undergo copyediting, typesetting, and review of the resulting proof before it is published in its final citable form. Please note that during the production process errors may be discovered which could affect the content, and all legal disclaimers that apply to the journal pertain.
References
- Alarcon G, Binnie CD, Elwes RD, Polkey CE. Power spectrum and intracranial EEG patterns at seizure onset in partial epilepsy. Electroencephalogr Clin Neurophysiol. 1995;94:326–337. doi: 10.1016/0013-4694(94)00286-t. [DOI] [PubMed] [Google Scholar]
- Arroyo S, Lesser RP, Awad CA, Goldring S, Sutherling WW, Resnick TJ. Subdural and epidural grids and strips. In: Engel J Jr, editor. Surgical Treatment of the Epilepsies. Raven Press; New York: 1993. pp. 377–386. [Google Scholar]
- Arroyo S, Lesser RP, Gordon B, Jackson D. Mu rhythm in the human cortex: An electrophysiologic study with subdural electrodes. Neurology. 1992;42(Suppl 3):265. doi: 10.1016/0013-4694(93)90114-b. [DOI] [PubMed] [Google Scholar]
- Asano E, Juhasz C, Shah A, Sood S, Chugani HT. Role of subdural electrocorticography in prediction of long-term seizure outcome in epilepsy surgery. Brain. 2009 doi: 10.1093/brain/awp025. [DOI] [PMC free article] [PubMed] [Google Scholar]
- Battaglia G, Chiapparini L, Franceschetti S, Freri E, Tassi L, Bassanini S, Villani F, Spreafico R, D'Incerti L, Granata T. Periventricular nodular heterotopia: classification, epileptic history, and genesis of epileptic discharges. Epilepsia. 2006;47:86–97. doi: 10.1111/j.1528-1167.2006.00374.x. [DOI] [PubMed] [Google Scholar]
- Bragin A, Engel J, Jr, Wilson CL, Fried I, Buzsaki G. High-frequency oscillations in human brain. Hippocampus. 1999;9:137–142. doi: 10.1002/(SICI)1098-1063(1999)9:2<137::AID-HIPO5>3.0.CO;2-0. [DOI] [PubMed] [Google Scholar]
- Brunner P, Ritaccio AL, Lynch TM, Emrich JF, Wilson JA, Williams JC, Aarnoutse EJ, Ramsey NF, Leuthardt EC, Bischof H, Schalk G. A practical procedure for real-time functional mapping of eloquent cortex using electrocorticographic signals in humans. Epilepsy Behav. 2009;15:278–286. doi: 10.1016/j.yebeh.2009.04.001. [DOI] [PMC free article] [PubMed] [Google Scholar]
- Buonomano DV, Merzenich MM. Cortical plasticity: from synapses to maps. Annu Rev Neurosci. 1998;21:149–86. 149–186. doi: 10.1146/annurev.neuro.21.1.149. [DOI] [PubMed] [Google Scholar]
- Burnstine TH, Lesser RP, Hart J, Uematsu S, Zinreich SJ, Krauss GL, Fisher RS, Vining EPG, Gordon B. Characterization of the basal temporal language area in patients with left temporal lobe epilepsy. Neurology. 1990;40:966–970. doi: 10.1212/wnl.40.6.966. [DOI] [PubMed] [Google Scholar]
- Crépon B, Navarro V, Hasboun D, Clemenceau S, Martinerie J, Baulac M, Adam C, Le Van Quyen M. Mapping interictal oscillations greater than 200 Hz recorded with intracranial macroelectrodes in human epilepsy. Brain. 2009 doi: 10.1093/brain/awp277. [DOI] [PubMed] [Google Scholar]
- Crone NE, Miglioretti DL, Gordon B, Lesser RP. Functional mapping of human sensorimotor cortex with electrocorticographic spectral analysis. II. Event-related synchronization in the gamma band. Brain. 1998a;121:2301–2315. doi: 10.1093/brain/121.12.2301. [DOI] [PubMed] [Google Scholar]
- Crone NE, Miglioretti DL, Gordon B, Sieracki JM, Wilson MT, Uematsu S, Lesser RP. Functional mapping of human sensorimotor cortex with electrocorticographic spectral analysis. I. Alpha and beta event-related desynchronization. Brain. 1998b;121:2271–2299. doi: 10.1093/brain/121.12.2271. [DOI] [PubMed] [Google Scholar]
- Crone NE, Sinai A, Korzeniewska A. High-frequency gamma oscillations and human brain mapping with electrocorticography. 2006 doi: 10.1016/S0079-6123(06)59019-3. [DOI] [PubMed] [Google Scholar]
- Diehl B, Lüders HO. Temporal lobe epilepsy: when are invasive recordings needed? Epilepsia. 2000;41(Suppl 3):S61–S74. doi: 10.1111/j.1528-1157.2000.tb01536.x. [DOI] [PubMed] [Google Scholar]
- Ebersole JS, Hawes-Ebersole S. Clinical application of dipole models in the localization of epileptiform activity. J Clin Neurophysiol. 2007;24:120–129. doi: 10.1097/WNP.0b013e31803ece13. [DOI] [PubMed] [Google Scholar]
- Engel J., Jr When is imaging enough? Epileptic Disord. 1999;1:249–253. [PubMed] [Google Scholar]
- Farrell DF, Burbank N, Lettich E, Ojemann GA. Individual Variation in Human Motor-Sensory (Rolandic) Cortex. J Clin Neurophysiol. 2007;24:286–293. doi: 10.1097/WNP.0b013e31803bb59a. [DOI] [PubMed] [Google Scholar]
- Fedi M, Reutens D, Okazawa H, Andermann F, Boling W, Dubeau F, White C, Nakai A, Gross DW, Andermann E, Diksic M. Localizing value of alpha-methyl-L-tryptophan PET in intractable epilepsy of neocortical origin. Neurology. 2001;57:1629–1636. doi: 10.1212/wnl.57.9.1629. [DOI] [PubMed] [Google Scholar]
- Fisher RS, Webber WR, Lesser RP, Arroyo S, Uematsu S. High-frequency EEG activity at the start of seizures. J Clin Neurophysiol. 1992;9:441–448. doi: 10.1097/00004691-199207010-00012. [DOI] [PubMed] [Google Scholar]
- Goldring S. A method for surgical management of focal epilepsy, especially as it relates to children. J Neurosurg. 1978;49:344–356. doi: 10.3171/jns.1978.49.3.0344. [DOI] [PubMed] [Google Scholar]
- Gordon B, Lesser RP, Rance NE, Hart J, Webber RS, Uematsu S, Fisher RS. Parameters for direct cortical electrical stimulation in the human: Histopathologic confirmation. Electroencephalogr Clin Neurophysiol. 1990;75:371–377. doi: 10.1016/0013-4694(90)90082-u. [DOI] [PubMed] [Google Scholar]
- Hamano T, Luders HO, Ikeda A, Collura TF, Comair YG, Shibasaki H. The cortical generators of the contingent negative variation in humans: a study with subdural electrodes. Electroencephalogr Clin Neurophysiol. 1997;104:257–268. doi: 10.1016/s0168-5597(97)96107-4. [DOI] [PubMed] [Google Scholar]
- Hamberger MJ, Seidel WT, McKhann GM, Perrine K, Goodman RR. Brain stimulation reveals critical auditory naming cortex. Brain. 2005;128:2742–2749. doi: 10.1093/brain/awh621. [DOI] [PubMed] [Google Scholar]
- Hamberger MJ, Seidel WT, Goodman RR, McKhann GM. Does cortical mapping protect naming if surgery includes hippocampal resection? Ann. Neurol. 2010a;67:345–352. doi: 10.1002/ana.21903. [DOI] [PMC free article] [PubMed] [Google Scholar]
- Hamberger MJ, Seidel WT, McKhann GM, Goodman RR. Hippocampal removal affects visual but not auditory naming. Neurology. 2010b;74:1488–1493. doi: 10.1212/WNL.0b013e3181dd40f0. [DOI] [PMC free article] [PubMed] [Google Scholar]
- Hong SB, Han HJ, Roh SY, Seo DW, Kim SE, Kim MH. Hypometabolism and interictal spikes during positron emission tomography scanning in temporal lobe epilepsy. Eur Neurol. 2002;48:65–70. doi: 10.1159/000062985. [DOI] [PubMed] [Google Scholar]
- Hori T, Tobuchi S, Kurosaki M, Kondo S, Takenobu A, Watanabe T. Subtemporal amygdalohippocampectomy for treating medically intractable temporal lobe epilepsy. Neurosurgery. 1993;33:50–57. [PubMed] [Google Scholar]
- Ikeda A, Luders HO, Collura TF, Burgess RC, Morris HH, Hamano T, Shibasaki H. Subdural potentials at orbitofrontal and mesial prefrontal areas accompanying anticipation and decision making in humans: a comparison with Bereitschaftspotential. Electroencephalogr Clin Neurophysiol. 1996a;98:206–212. doi: 10.1016/0013-4694(95)00239-1. [DOI] [PubMed] [Google Scholar]
- Ikeda A, Taki W, Kunieda T, Terada K, Mikuni N, Nagamine T, Yazawa S, Ohara S, Hori T, Kaji R, Kimura J, Shibasaki H. Focal ictal direct current shifts in human epilepsy as studied by subdural and scalp recording. Brain. 1999;122:827–838. doi: 10.1093/brain/122.5.827. [DOI] [PubMed] [Google Scholar]
- Ikeda A, Terada K, Mikuni N, Burgess RC, Comair Y, Taki W, Hamano T, Kimura J, Lüders HO, Shibasaki H. Subdural recording of ictal DC shifts in neocortical seizures in humans. Epilepsia. 1996b;37:662–674. doi: 10.1111/j.1528-1157.1996.tb00631.x. [DOI] [PubMed] [Google Scholar]
- Jacobs J, Levan P, Chander R, Hall J, Dubeau F, Gotman J. Interictal high-frequency oscillations (80–500 Hz) are an indicator of seizure onset areas independent of spikes in the human epileptic brain. Epilepsia. 2008 doi: 10.1111/j.1528-1167.2008.01656.x. [DOI] [PMC free article] [PubMed] [Google Scholar]
- Jacobs J, Levan P, Chatillon CE, Olivier A, Dubeau F, Gotman J. High frequency oscillations in intracranial EEGs mark epileptogenicity rather than lesion type. Brain. 2009a doi: 10.1093/brain/awn351. [DOI] [PMC free article] [PubMed] [Google Scholar]
- Jacobs J, Levan P, Moeller F, Boor R, Stephani U, Gotman J, Siniatchkin M. Hemodynamic changes preceding the interictal EEG spike in patients with focal epilepsy investigated using simultaneous EEG-fMRI. Neuroimage. 2009b;45:1220–1231. doi: 10.1016/j.neuroimage.2009.01.014. [DOI] [PubMed] [Google Scholar]
- Jacobs J, Zijlmans M, Zelmann R, Chatillon CE, Hall J, Olivier A, Dubeau F, Gotman J. High-frequency electroencephalographic oscillations correlate with outcome of epilepsy surgery. Ann Neurol. 2009c;67:209–220. doi: 10.1002/ana.21847. [DOI] [PMC free article] [PubMed] [Google Scholar]
- Jacobs J, Zijlmans M, Zelmann R, Olivier A, Hall J, Gotman J, Dubeau F. Value of electrical stimulation and high frequency oscillations (80–500 Hz) in identifying epileptogenic areas during intracranial EEG recordings. Epilepsia. 2010 doi: 10.1111/j.1528-1167.2009.02389.x. [DOI] [PMC free article] [PubMed] [Google Scholar]
- Jansen FE, Huiskamp G, Van Huffelen AC, Bourez-Swart M, Boere E, Gebbink T, Vincken KL, van NO. Identification of the epileptogenic tuber in patients with tuberous sclerosis: a comparison of high-resolution EEG and MEG. Epilepsia. 2006;47:108–114. doi: 10.1111/j.1528-1167.2006.00373.x. [DOI] [PubMed] [Google Scholar]
- Jayakar P, Lesser RP. Extraoperative Methods. In: Engel J Jr, Pedley TA, editors. Epilepsy A Comprehensive Textbook. Lipppincott-Raven; Philadelphia-New York: 1997. pp. 1785–1793. [Google Scholar]
- Jirsch JD, Urrestarazu E, Levan P, Olivier A, Dubeau F, Gotman J. High-frequency oscillations during human focal seizures. Brain. 2006 doi: 10.1093/brain/awl085. [DOI] [PubMed] [Google Scholar]
- Khosravani H, Mehrotra N, Rigby M, Hader WJ, Pinnegar CR, Pillay N, Wiebe S, Federico P. Spatial localization and time-dependant changes of electrographic high frequency oscillations in human temporal lobe epilepsy. Epilepsia. 2008 doi: 10.1111/j.1528-1167.2008.01761.x. [DOI] [PubMed] [Google Scholar]
- Koubeissi MZ. Subdural electrodes. In: Lüders HO, editor. Textbook of Epilepsy Surgery Informa Healthcare. Boca Raton; Florida: 2009. pp. 641–648. [Google Scholar]
- Lee BI, Luders H, Lesser RP, Dinner DS, Morris HH., III Cortical potentials related to voluntary and passive finger movements recorded from subdural electrodes in humans. Ann Neurol. 1986;20:32–37. doi: 10.1002/ana.410200107. [DOI] [PubMed] [Google Scholar]
- Lee HW, Shin JS, Webber WR, Crone NE, Gingis L, Lesser RP. Reorganisation of cortical motor and language distribution in human brain. J Neurol Neurosurg Psychiatry. 2009;80:285–290. doi: 10.1136/jnnp.2008.156067. [DOI] [PubMed] [Google Scholar]
- Lesser R, Gordon B, Uematsu S. Electrical stimulation and language. J Clin Neurophysiol. 1994;11:191–204. doi: 10.1097/00004691-199403000-00004. [DOI] [PubMed] [Google Scholar]
- Lesser RP, Gordon B, Fisher R, Hart J, Uematsu S. Subdural grid electrodes in surgery of epilepsy. In: Luders H, editor. Epilepsy surgery. Raven Press; New York: 1991. pp. 399–408. [Google Scholar]
- Lesser RP, Hahn JF, Lüders H, Rothner AD, Erenberg G. The use of chronic subdural electrodes for cortical mapping of speech. Epilepsia. 1981;22:240. [Google Scholar]
- Lesser RP, Kim SH, Beyderman L, Miglioretti DL, Webber WRS, Bare M, Cysyk B, Krauss G, Gordon B. Brief bursts of pulse stimulation terminate afterdischarges caused by cortical stimulation. Neurology. 1999;53:2073–2081. doi: 10.1212/wnl.53.9.2073. [DOI] [PubMed] [Google Scholar]
- Lesser RP, Lee HW, Webber WR, Prince B, Crone NE, Miglioretti DL. Short-term variations in response distribution to cortical stimulation. Brain. 2008;131:1528–1539. doi: 10.1093/brain/awn044. [DOI] [PMC free article] [PubMed] [Google Scholar]
- Lesser RP, Lüders H, Dinner DS, Hahn JF, Cohen L. The location of speech and writing functions in the frontal language area. Results of extraoperative cortical stimulation. Brain. 1984a;107:275–291. doi: 10.1093/brain/107.1.275. [DOI] [PubMed] [Google Scholar]
- Lesser RP, Lüders H, Klem G, Dinner DS, Morris HH, Hahn J. Cortical afterdischarge and functional response thresholds: results of extraoperative testing. Epilepsia. 1984b;25:615–621. doi: 10.1111/j.1528-1157.1984.tb03471.x. [DOI] [PubMed] [Google Scholar]
- Lesser RP, Lüders H, Klem G, Dinner DS, Morris HH, Hahn JF, Wyllie E. Extraoperative cortical functional localization in patients with epilepsy. J Clin Neurophysiol. 1987;4:27–53. doi: 10.1097/00004691-198701000-00003. [DOI] [PubMed] [Google Scholar]
- Levy WJ, Hahn JH, Lueders H, Lesser R. Chronic cortical electrode array for seizure investigation. Childs Brain. 1982;9:48–52. doi: 10.1159/000120034. [DOI] [PubMed] [Google Scholar]
- Lucas TH, Drane DL, Dodrill CB, Ojemann GA. Language reorganization in aphasics: an electrical stimulation mapping investigation. Neurosurgery. 2008;63:487–497. doi: 10.1227/01.NEU.0000324725.84854.04. [DOI] [PMC free article] [PubMed] [Google Scholar]
- Lüders H, Dinner DS, Lesser RP, Morris HH. Evoked potentials in cortical localization. J Clin Neurophysiol. 1986a;3:75–84. doi: 10.1097/00004691-198601000-00006. [DOI] [PubMed] [Google Scholar]
- Lüders H, Lesser RP, Dinner DS, Morris HH, Wyllie E, Godoy J. Localization of cortical function: new information from extraoperative monitoring of patients with epilepsy. Epilepsia. 1988;29(Suppl 2):S56–S65. doi: 10.1111/j.1528-1157.1988.tb05799.x. [DOI] [PubMed] [Google Scholar]
- Lüders H, Lesser RP, Hahn J, Dinner DS, Morris H, Resor S, Harrison M. Basal temporal language area demonstrated by electrical stimulation. Neurology. 1986b;36:505–510. doi: 10.1212/wnl.36.4.505. [DOI] [PubMed] [Google Scholar]
- Marsden JF, Werhahn KJ, Ashby P, Rothwell J, Noachtar S, Brown P. Organization of cortical activities related to movement in humans. J Neurosci. 2000;20:2307–2314. doi: 10.1523/JNEUROSCI.20-06-02307.2000. [DOI] [PMC free article] [PubMed] [Google Scholar]
- Matsuhashi M, Ikeda A, Ohara S, Matsumoto R, Yamamoto J, Takayama M, Satow T, Begum T, Usui K, Nagamine T, Mikuni N, Takahashi J, Miyamoto S, Fukuyama H, Shibasaki H. Multisensory convergence at human temporo-parietal junction - epicortical recording of evoked responses. Clin Neurophysiol. 2004;115:1145–1160. doi: 10.1016/j.clinph.2003.12.009. [DOI] [PubMed] [Google Scholar]
- Meroni A, Galli C, Bramerio M, Tassi L, Colombo N, Cossu M, Lo RG, Garbelli R, Spreafico R. Nodular heterotopia: a neuropathological study of 24 patients undergoing surgery for drug-resistant epilepsy. Epilepsia. 2009;50:116–124. doi: 10.1111/j.1528-1167.2008.01717.x. [DOI] [PubMed] [Google Scholar]
- Moeller F, Tyvaert L, Nguyen DK, Levan P, Bouthillier A, Kobayashi E, Tampieri D, Dubeau F, Gotman J. EEG-fMRI: Adding to standard evaluations of patients with nonlesional frontal lobe epilepsy. Neurology. 2009;73:2023–2030. doi: 10.1212/WNL.0b013e3181c55d17. [DOI] [PMC free article] [PubMed] [Google Scholar]
- Motamedi GK, Okunola O, Kalhorn CG, Mostofi N, Mizuno-Matsumoto Y, Cho YW, Meador KJ. Afterdischarges during cortical stimulation at different frequencies and intensities. Epilepsy Res. 2007;77:65–69. doi: 10.1016/j.eplepsyres.2007.08.001. [DOI] [PubMed] [Google Scholar]
- Nathan SS, Lesser RP, Gordon B, Thakor NV. Electrical stimulation of the human cerebral cortex. Theoretical approach. [Review] Adv Neurol. 1993a;63:61–85. [PubMed] [Google Scholar]
- Nathan SS, Sinha SR, Gordon B, Lesser RP, Thakor NV. Determination of current density distributions generated by electrical stimulation of the human cerebral cortex. Electroencephalogr Clin Neurophysiol. 1993b;86:183–192. doi: 10.1016/0013-4694(93)90006-h. [DOI] [PubMed] [Google Scholar]
- Novotny EJ, Jr, Fulbright RK, Pearl PL, Gibson KM, Rothman DL. Magnetic resonance spectroscopy of neurotransmitters in human brain. Ann Neurol. 2003;54(Suppl 6):S25–S31. doi: 10.1002/ana.10697. [DOI] [PubMed] [Google Scholar]
- O'Brien TJ, So EL, Mullan BP, Hauser MF, Brinkmann BH, Bohnen NI, Hanson D, Cascino GD, Jack CR, Jr, Sharbrough FW. Subtraction ictal SPECT co-registered to MRI improves clinical usefulness of SPECT in localizing the surgical seizure focus. Neurology. 1998;50:445–454. doi: 10.1212/wnl.50.2.445. [DOI] [PubMed] [Google Scholar]
- Ojemann GA. Individual variability in cortical localization of language. J Neurosurgery. 1979;50:164–169. doi: 10.3171/jns.1979.50.2.0164. [DOI] [PubMed] [Google Scholar]
- Ojemann GA, Dodrill CB. Verbal deficits after left temporal lobectomy for epilepsy. J Neurosurgery. 1985;62:101–107. doi: 10.3171/jns.1985.62.1.0101. [DOI] [PubMed] [Google Scholar]
- Ojemann GA, Sutherling WW, Lesser RP, Dinner DS, Jayakar P, Saint-Hilaire J-M. Cortical Stimulation. In: Engel J Jr, editor. Surgical Treatment of the Epilepsies. Raven Press; New York: 1993. pp. 399–414. [Google Scholar]
- Penfield W, Jasper H. Epilepsy and the functional anatomy of the human brain. Little Brown and Co; Boston: 1954. [Google Scholar]
- Penfield W, Roberts L. Speech and Brain Mechanisms. Princeton University Press; Princeton, N.J: 1959. [Google Scholar]
- Pfurtscheller G. Functional brain imaging based on ERD/ERS. Vision Res. 2001;41:1257–1260. doi: 10.1016/s0042-6989(00)00235-2. [DOI] [PubMed] [Google Scholar]
- Pfurtscheller G, Andrew C. Event-Related changes of band power and coherence: methodology and interpretation. J Clin Neurophysiol. 1999;16:512–519. doi: 10.1097/00004691-199911000-00003. [DOI] [PubMed] [Google Scholar]
- Pfurtscheller G, Lopes da Silva FH. Event-related EEG/MEG synchronization and desynchronization: basic principles. Clin Neurophysiol. 1999;110:1842–1857. doi: 10.1016/s1388-2457(99)00141-8. [DOI] [PubMed] [Google Scholar]
- Plummer C, Litewka L, Farish S, Harvey AS, Cook MJ. Clinical utility of current-generation dipole modelling of scalp EEG. Clin Neurophysiol. 2007;118:2344–2361. doi: 10.1016/j.clinph.2007.08.016. [DOI] [PubMed] [Google Scholar]
- Polkey CE. The history of epilepsy surgery in the United Kingdom. In: Lüders HO, editor. Textbook of Epilepsy Surgery. Informa Healthcare; London: 2009. pp. 24–31. [Google Scholar]
- Pouratian N, Cannestra AF, Bookheimer SY, Martin NA, Toga AW. Variability of intraoperative electrocortical stimulation mapping parameters across and within individuals. J Neurosurg. 2004;101:458–466. doi: 10.3171/jns.2004.101.3.0458. [DOI] [PubMed] [Google Scholar]
- Racine RJ. Kindling: The first decade. Neurosurgery. 1978;3:234–252. doi: 10.1227/00006123-197809000-00018. [DOI] [PubMed] [Google Scholar]
- Salamon N, Kung J, Shaw SJ, Koo J, Koh S, Wu JY, Lerner JT, Sankar R, Shields WD, Engel J, Jr, Fried I, Miyata H, Yong WH, Vinters HV, Mathern GW. FDG-PET/MRI coregistration improves detection of cortical dysplasia in patients with epilepsy. Neurology. 2008;71:1594–1601. doi: 10.1212/01.wnl.0000334752.41807.2f. [DOI] [PMC free article] [PubMed] [Google Scholar]
- Salazar F, Bingaman WE. Placement of subdural grids. In: Lüders HO, editor. Textbook of Epilepsy Surgery. Informa Healthcare; London: 2008. pp. 931–937. [Google Scholar]
- Sanes JN, Donoghue JP. Plasticity and primary motor cortex. Annu Rev Neurosci. 2000;23:393–415. doi: 10.1146/annurev.neuro.23.1.393. [DOI] [PubMed] [Google Scholar]
- Satow T, Matsuhashi M, Ikeda A, Yamamoto J, Takayama M, Begum T, Mima T, Nagamine T, Mikuni N, Miyamoto S, Hashimoto N, Shibasaki H. Distinct cortical areas for motor preparation and execution in human identified by Bereitschaftspotential recording and ECoG-EMG coherence analysis. Clin Neurophysiol. 2003;114:1259–1264. doi: 10.1016/s1388-2457(03)00091-9. [DOI] [PubMed] [Google Scholar]
- Savic I, Lindstrom P, Gulyas B, Halldin C, Andree B, Farde L. Limbic reductions of 5-HT1A receptor binding in human temporal lobe epilepsy. Neurology. 2004;62:1343–1351. doi: 10.1212/01.wnl.0000123696.98166.af. [DOI] [PubMed] [Google Scholar]
- Scherer R, Zanos SP, Miller KJ, Rao RP, Ojemann JG. Classification of contralateral and ipsilateral finger movements for electrocorticographic brain-computer interfaces. Neurosurg Focus. 2009;27:E12. doi: 10.3171/2009.4.FOCUS0981. [DOI] [PubMed] [Google Scholar]
- Schott GD. Penfield's homunculus: a note on cerebral cartography. J Neurol Neurosurg Psychiatry. 2006;56(4):329–333. doi: 10.1136/jnnp.56.4.329. [DOI] [PMC free article] [PubMed] [Google Scholar]
- Schramm J. Temporal lobe epilepsy surgery and the quest for optimal extent of resection: a review. Epilepsia. 2008;49:1296–1307. doi: 10.1111/j.1528-1167.2008.01604.x. [DOI] [PubMed] [Google Scholar]
- Sherman EM, Wiebe S. Game-changing, or business as usual?: New findings on naming skills after temporal lobe surgery. Neurology. 2010;74:1484–1485. doi: 10.1212/WNL.0b013e3181dd4e42. [DOI] [PubMed] [Google Scholar]
- Shih JJ, Weisend MP, Lewine J, Sanders J, Dermon J, Lee R. Areas of interictal spiking are associated with metabolic dysfunction in MRI-negative temporal lobe epilepsy. Epilepsia. 2004;45:223–229. doi: 10.1111/j.0013-9580.2004.13503.x. [DOI] [PubMed] [Google Scholar]
- Siegel AM, Wieser HG, Wichmann W, Yasargil GM. Relationships between MR-imaged total amount of tissue removed, resection scores of specific mediobasal limbic subcompartments and clinical outcome following selective amygdalohippocampectomy. Epilepsy Res. 1990;6:56–65. doi: 10.1016/0920-1211(90)90009-k. [DOI] [PubMed] [Google Scholar]
- Sinai A, Bowers CW, Crainiceanu CM, Boatman D, Gordon B, Lesser RP, Lenz FA, Crone NE. Electrocorticographic high gamma activity versus electrical cortical stimulation mapping of naming. Brain. 2005;128:1556–1570. doi: 10.1093/brain/awh491. [DOI] [PubMed] [Google Scholar]
- Sisodiya SM. Surgery for malformations of cortical development causing epilepsy. Brain. 2000;123(Pt 6):1075–1091. doi: 10.1093/brain/123.6.1075. [DOI] [PubMed] [Google Scholar]
- Spencer SS. Depth versus subdural electrode studies for unlocalized epilepsy. J Epilepsy. 1989;2:123–127. [Google Scholar]
- Spencer SS, Guimaraes P, Katz A, Kim J, Spencer DD. Morphological patterns of seizures recorded intracranially. Epilepsia. 1992;33:537–545. doi: 10.1111/j.1528-1157.1992.tb01706.x. [DOI] [PubMed] [Google Scholar]
- Spencer SS, Spencer DD, Williamson PD, Mattson R. Combined depth and subdural electrode investigation in uncontrolled epilepsy. Neurology. 1990;40:74–79. doi: 10.1212/wnl.40.1.74. [DOI] [PubMed] [Google Scholar]
- Suzuki SS, Smith GK. Spontaneous EEG spikes in the normal hippocampus: I. Behavioral correlates, laminar profiles and bilateral synchrony. Electroencephalogr Clin Neurophysiol. 1987;67:348–359. doi: 10.1016/0013-4694(87)90123-4. [DOI] [PubMed] [Google Scholar]
- Suzuki SS, Smith GK. Spontaneous EEG spikes in the normal hippocampus. II. Relations to synchronous bursts discharges. Electroencephalogr Clin Neurophysiol. 1988;69:532–540. doi: 10.1016/0013-4694(88)90165-4. [DOI] [PubMed] [Google Scholar]
- Uematsu S, Lesser R, Fisher RS, Gordon B, Hara K, Krauss GL, Vining EP, Webber RW. Motor and sensory cortex in humans: topography studied with chronic subdural stimulation [see comments] Neurosurgery. 1992;31:59–71. doi: 10.1227/00006123-199207000-00009. discussion 71–2. [DOI] [PubMed] [Google Scholar]
- Valentin A, Alarcon G, Garcia-Seoane JJ, Lacruz ME, Nayak SD, Honavar M, Selway RP, Binnie CD, Polkey CE. Single-pulse electrical stimulation identifies epileptogenic frontal cortex in the human brain. Neurology. 2005a;65:426–435. doi: 10.1212/01.wnl.0000171340.73078.c1. [DOI] [PubMed] [Google Scholar]
- Valentin A, Alarcón G, Honavar M, Garcia Seoane JJ, Selway RP, Polkey CE, Binnie CD. Single pulse electrical stimulation for identification of structural abnormalities and prediction of seizure outcome after epilepsy surgery: a prospective study. Lancet Neurol. 2005b;4:718–726. doi: 10.1016/S1474-4422(05)70200-3. [DOI] [PubMed] [Google Scholar]
- Van Gompel JJ, Stead SM, Giannini C, Meyer FB, Marsh WR, Fountain T, So E, Cohen-Gadol A, Lee KH, Worrell GA. Phase I trial: safety and feasibility of intracranial electroencephalography using hybrid subdural electrodes containing macro- and microelectrode arrays. Neurosurg Focus. 2008;25:E23. doi: 10.3171/FOC/2008/25/9/E23. [DOI] [PMC free article] [PubMed] [Google Scholar]
- Wada JA, Mizuguchi T, Osawa T. Secondarily generalized convulsive seizures by daily amygdaloid stimulation in the rhesus monkeys. Neurology. 1978;28:1026–1036. doi: 10.1212/wnl.28.10.1026. [DOI] [PubMed] [Google Scholar]
- White RL, Gross TJ. An evaluation of the resistance to electrolysis of metals for use in biostimulation microprobes. EEE Trans Biomed Eng. 1974:487–490. [Google Scholar]
- Wieser HG, Yasargil MG. Selective amygdalohippocampectomy as a surgical treatment of mesiobasal limbic epilepsy. Surg Neurol. 1982;17:445–457. doi: 10.1016/s0090-3019(82)80016-5. [DOI] [PubMed] [Google Scholar]
- Worrell GA, Parish L, Cranstoun SD, Jonas R, Baltuch G, Litt B. High-frequency oscillations and seizure generation in neocortical epilepsy. Brain. 2004;127:1496–1506. doi: 10.1093/brain/awh149. [DOI] [PubMed] [Google Scholar]
- Wyler AR. Subdural strip electrodes in surgery of epilepsy. In: Lüders H, editor. Epilepsy Surgery. Raven Press; New York: 1991. pp. 395–398. [Google Scholar]
- Wyler AR, Ojemann GA, Lettich E, Ward AA. Subdural strip electrodes for localizing epileptogenic foci. J Neurosurgery. 1984;60:1195–1200. doi: 10.3171/jns.1984.60.6.1195. [DOI] [PubMed] [Google Scholar]
- Zangaladze A, Sharan A, Evans J, Wyeth DH, Wyeth EG, Tracy JI, Chervoneva I, Sperling MR. The effectiveness of low-frequency stimulation for mapping cortical function. Epilepsia. 2007;49:481–487. doi: 10.1111/j.1528-1167.2007.01307.x. [DOI] [PubMed] [Google Scholar]
Associated Data
This section collects any data citations, data availability statements, or supplementary materials included in this article.
Supplementary Materials
Animation of the cortical distribution of alpha suppression during naming. This is a full animation of the cortical responses, from which figure 9 was derived. The animation uses a standard “rainbow” color scale, where red indicates the greatest and blue the least suppression. Measurement of alpha suppression occurs in 100 msec intervals. Suppression occurs posteriorly during early portions of the animation, perhaps due to word retrieval, and later occurs anteriorly, during articulation.
Animation of the cortical distribution of alpha suppression during word repetition, as recorded from a 6x8 electrode array. The animation uses a standard “rainbow” color scale, where red indicates the greatest and blue the least suppression. Suppression occurs posteriorly when the patient first hears the word, then anteriorly when the patient repeats the word, then spreads posteriorly when the patient hears the word which just has been articulated.