

Abstract
We present a new ultra high resolution spectral domain polarization sensitive optical coherence tomography (PS-OCT) system based on polarization maintaining (PM) fibers. The method transfers the principles of our previous bulk optic PS-OCT systems to a fiberized setup. The phase shift between the orthogonal polarization states travelling in the two orthogonal modes of the PM fiber is compensated by software in post processing. Thereby, the main advantage of our bulk optics setups, i.e. the use of only a single input polarization state to simultaneously acquire reflectivity, retardation, optic axis orientation, and Stokes vector, is maintained. The use of a broadband light source of 110 nm bandwidth provides improved depth resolution and smaller speckle size. The latter is important for improved resolution of depolarization imaging. We demonstrate our instrument for high-resolution PS-OCT imaging of the healthy human retina.
1. Introduction
During the last 20 years optical coherence tomography (OCT) has developed into a powerful technique for imaging of transparent and translucent structures [1,2]. Originally developed as a time domain technique, its spectral domain counterpart [3–5] has been long overlooked. However, in 2003 it has been shown that spectral domain (SD) OCT has huge advantages in terms of sensitivity and imaging speed [6–8], thus enabling high speed imaging in 2 and 3 dimensions [9,10]. Recent developments of high speed CMOS cameras and high speed swept source lasers have enabled an imaging speed of up to ~300k A-lines per second [11].
Polarization sensitive (PS) OCT is a functional extension of OCT [12–14]. PS-OCT takes advantage of the additional polarization information carried by the reflected light, and can therefore add new image contrast compared to intensity based OCT. PS-OCT can reveal important information about biological tissue, such as quantitative distribution of birefringence, which is unavailable in conventional OCT.
A very interesting application field for PS-OCT is retinal imaging. One can distinguish between polarization preserving (e.g. photoreceptor layer), birefringent (e.g. retinal nerve fiber layer (RNFL), Henle’s fiber layer) and depolarizing layers (e. g. retinal pigment epithelium (RPE)). In addition, PS-OCT can provide quantitative information on birefringent [15–20] and depolarizing tissues [21–24].
In 1992 Hee et al. proposed the first PS-OCT setup [12]. In 1997 the first images of retardation of scattering tissue imaged with a PS-OCT setup have been presented [13]. However, this early work was based on bulk optics, which is not as convenient in terms of easy alignment and handling compared to fiber based systems. Nevertheless, free space PS-OCT setups have the advantage of easy control of the polarization state of light in the reference and the sample arms. Due to the fact that single mode fibers change the polarization state of the transmitted light in an unknown manner, a fiber based PS-OCT setup cannot be as easily implemented as free space setups. To overcome these problems, Saxer et al. proposed a first fiber based PS-OCT setup in 2000 [25] which needed at least two A-scans with different input polarization states per measurement location to retrieve the polarization properties of the measured sample. Recently, a fiber based swept source PS-OCT system has been described where the incident polarization state is modulated during the sweep of the light source [26]. In this system only one A-scan per measurement location is necessary to calculate the retardation, but with the disadvantage that the measurement depth is reduced by a factor of 2 or more. Another approach combined swept source OCT with frequency multiplexing, thus maintaining full imaging depth, however, requiring additional frequency shifters [27].
Polarization maintaining (PM) fibers maintain only linear polarization states. Due to the elliptic core and different refractive index of the two propagation modes, the relative phase between these modes is lost, preventing the undistorted propagation of arbitrary elliptical polarization states. Recently, a time domain system based on PM fibers has been described, where the difference in propagation velocitiy of the two orthogonal modes within the fiber is compensated with the help of two birefringent prisms [28].
The development of ultra broad band light sources has enabled the possibility for ultra high resolution (UHR) OCT with a depth resolution down to 2μm [29]. In recent years also UHR spectral domain systems have been presented [30–33]. However, up to now only a few time domain ultra high resolution PS-OCT systems have been published, and none of them was used for retinal imaging [34–36]. In this paper we present, as we believe for the first time, an ultra high resolution SD-PS-OCT system based on PM fibers. This system transfers the principles of our previously reported bulk optics SD PS-OCT instrument to a fiberized setup, i.e. the sample is illuminated by circularly polarized light and measures an arbitrary elliptical polarization state. Contrary to the recently presented TD-OCT system [28], the direct access to the signal phase after the Fourier transform of the spectral data allows the recovery of the phase information directly by a software algorithm. Thereby, the main advantages of this principle become available for fiber based systems: only a single input state is needed to retrieve reflectivity, retardation and birefringent axis orientation. No polarization or phase modulators are needed.
In addition, the use of a broadband light source with a bandwidth of 110 nm results in a smaller speckle size. This increases the density of independent sampling points, leading to improved resolution of PS measurements, which is especially important for measurements of the thinner part of the retinal nerve fiber layer. In addition, the smaller speckle size allows a smaller evaluation window for depolarization measurements, leading to improved spatial resolution of RPE segmentation.
2. Methods
Figure 1 shows a sketch of the optical setup. We used a light source with a bandwidth of 110 nm (Broadlighter T840, Superlum, Moscow) and a center wavelength at 840 nm. Light emitted from the source enters a fiber based isolator to prevent damage of the source due to backreflection. A polarization control paddle is implemented to match the polarization state of light with the orientation of the fiber based polarizer. The polarizer provides vertically polarized light which enters the fiber based interferometer, where it is split by a 50/50 coupler into a reference and a sample arm. In the reference arm, light exits the polarization maintaining fiber via a collimator and passes a variable neutral density filter (for optimizing reference power), a quarter wave plate (QWP) oriented at 22.5°, a pair of glass prisms for variable dispersion compensation, and is finally reflected by the reference mirror. After double passage of the QWP, the orientation of the polarization plane is at 45° to the horizontal, providing equal reference power in both channels of the polarization sensitive detection unit. In the sample arm, after exiting the fiber trough a collimator, light passes a QWP oriented at 45° which provides circularly polarized light onto the sample. With the help of an x-y galvanometer scanner and a telescope the beam is scanned over the retina. After recombination of light from the reference and the sample arm at the 2×2 fiber coupler, light is directed via a PM fiber to a fiber based polarizing beam splitter. The two orthogonally polarized beams are guided into two separate, identical spectrometers. Each spectrometer consists of a reflection grating (1200 lines/mm), a camera lens with a focal length of 200 mm, and a 2048 element line scan CCD camera (Atmel Aviiva M2 CL 2014). The spectrometer design is discussed in detail in ref [21]. With a power of 750 μW illuminating the sample and an integration time of 50 μs we achieved a sensitivity of 98 dB. The transverse resolution is ~12 μm. The depth range of the system is ~3 mm in air. Our system was operated at an A-scan rate of 20 k A-lines /sec, covering a scan field of 15°×15°.
Fig. 1.

Schematic drawing of the setup. SLD, superluminescent diode; PP, polarization control paddle; PM-fiber, polarization maintaining fiber; QWP, quarter waveplate; VDF, variable density filter; DC, dispersion compensation.
3. Signal processing
Compared to normal single mode fibers, PM fibers have the advantage to maintain linear polarization states oriented parallel to the axes of their elliptic cores. However, due to the different propagation velocity of the two orthogonal modes, the phase between the vertical and the horizontal polarization state is changed, destroying the original arbitrary elliptical polarization state, back reflected from the sample. An exact determination of the elliptical polarization state, however, is required to calculate the sample birefringence parameters [37].
In case of perfect length matched PM fibers in the reference arm and the sample arm, the phase shifts cancel each other and the elliptical polarization state can again be measured in the detection arm. In other words, the shift of the coherence functions of the two states caused by the different light speeds is canceled, and the coherence functions overlap perfectly again, the only remaining phase difference being caused by the sample birefringence, which is exactly what we want to measure. However, if the two fibers are not exactly length matched, the resulting coherence functions of the two orthogonal detection channels are not at the same depth position. This mismatch has to be compensated. Contrary to [28], where this mismatch was compensated with a pair of birefringent wedges, we take advantage of the fact that, after the Fourier transform of the spectral data, we have direct access to the phase of the A-scan signals. Therefore, we can compensate the length mismatch of the PM fibers by data post processing.
For explanation of the method, we consider the structure term (A-scan signal) obtained by inverse Fourier transform of the acquired spectral data I(k) (DC, autocorrelation, and mirror terms are neglected in this analysis):
where z is the depth coordinate, Δz is the optical path length difference between reference arm and sample arm, A and Φ are the amplitude and the phase of the interference signal, respectively, and H and V denote the horizontal and the vertical polarization channel, respectively. Prior to compensation, ΔzH is unequal ΔzV.
To compensate the fiber length mismatch of sample and reference arm, we add a complex number C to the horizontal or vertical component of the complex valued structure term Γ (z-Δz). The value of the complex number C is found empirically from a calibration measurement. It is iteratively adapted until the coherence functions of the vertical and horizontal components are exactly depth matched. To achieve sub pixel depth matching, one can apply zero padding before Fourier transform, or apply sub pixel interpolation. This procedure has to be done only once for a specific PM fiber based PS-OCT setup.
Figure 2 shows a flow chart of the post processing steps. After data acquisition, fixed pattern noise, originating from the camera read out, is removed. This procedure consists of subtracting a mean spectrum (averaged over 1000 A-scans) and removing two sharp frequencies generated by the camera. These two sharp frequencies might originate from the separated odd and even pixel readout of our line scan camera. Afterwards, rescaling from λ to k space is performed. Then a dispersion compensation algorithm is applied [38]. After zero padding from 2048 points to 8192 points, an inverse FFT is performed which retrieves the complex valued structure term I(z). In a next step, the PM fiber length mismatch is compensated, and from the resulting structure term (where now ΔzH = ΔzV) A1, A2, Φ1 and Φ2 are calculated. From these quantities the reflectivity, the retardation, and the optic axis orientation can be calculated as described in [37]. As an additional polarization parameter we calculated the degree of polarization uniformity (DOPU), a parameter closely related to the degree of polarization (DOP) (which cannot be directly measured by a coherent detection technique like OCT). DOPU is calculated from Stokes vector elements averaged within a tiny evaluation window which floats over the whole B-scan. This value can be used to segment depolarizing layers such as the retinal pigment epithelium. A detailed description of this method can be found in [23].
Fig. 2.

Flow chart of post processing steps of the measured PS-OCT data.
4. Results
Figure 3 shows the spectrum of light within the reference arm measured with the spectrometer of our SD-PS-OCT system. The FWHM of the light source is 110 nm. The non Gaussian shape leads to side lobes of the coherence function (cf. Fig. 4).
Fig. 3.
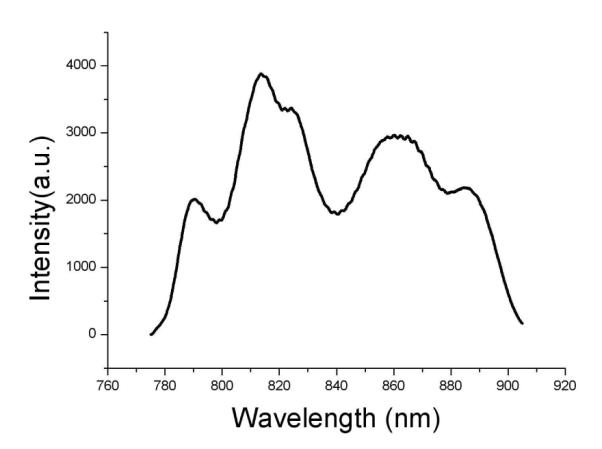
Spectrum of the Superlum Broadlighter T840 measured via the reference arm with the spectrometer of the SD-PS-OCT setup. The FWHM of the light source is 110 nm.
Fig. 4.

Coherence functions obtained with a mirror as sample. Channel 1 (horizontal polarization) and 2 (vertical polarization) are represented in black and red color. (a) coherence function of channel 1 with a depth resolution of 2.9 μm (assuming a refractive index of 1.38 for retinal tissue); (b) coherence function of channel 1 and 2 before compensation of PM fibers; (c) coherence function of channel 1 and 2 after compensation of PM fibers. Intensity in linear scale.
Figure 4 shows the coherence functions (linear scale) obtained from a mirror in the sample arm. To obtain equal intensity from the sample mirror in both polarization channels, the QWP in the sample arm was oriented at 22.5° for these measurements. Fig. 4(a) shows the coherence function of channel 1. The FWHM width of the coherence function is 2.9 μm, which is in agreement with results published previously, where a very similar light source was used [39,40]. Due to the non Gaussian profile of the spectrum side lobes can be seen. Figure 4(b) shows the coherence functions of channels 1 and 2 before numerical compensation of the PM fiber length. Due to fiber length mismatch of the reference and the object arm, the coherence functions appear at different depth positions. Figure 4(c) shows the two coherence functions after the compensation procedure. As can be seen, the coherence functions appear at exactly the same depth position. However, small differences in shape and height of the side lobes can be seen, which might originate from a slight spectral dependence of the fiber splitters. As described in detail in [21], an SD-PS-OCT system based on two separate spectrometers requires two identical spectrometers to record the horizontally and vertically polarized spectral interferograms. This requires careful alignment of the two spectrometers with respect to each other. Figure 4(c) shows that even when using a light source with a bandwidth of 110 nm, this can still be achieved.
5. In vivo imaging
PS-OCT imaging was performed in a healthy volunteer after informed consent was obtained. All measurements were approved by the ethics committee of the Medical University of Vienna and followed the tenets of the Declaration of Helsinki.
Figure 5 shows images of intensity, retardation, and optic axis orientation of the fovea of a healthy volunteer. In the intensity image (Fig. 5(a)), all the layers and features known from non polarization sensitive ultra high resolution OCT systems can be observed [38]. The polarization sensitive images (Fig. 5(b), (c)) show, that most of the retinal layers in this area do not alter the polarization state. However, the RPE (arrow) changes the polarization state of backscattered light in a random way (random variation from speckle to speckle). This polarization scrambling indicates depolarization [22].
Fig. 5.

PS-OCT B-scan (1000 A-scans) image of healthy human fovea in vivo. (a) Intensity (log scale); (b) retardation (color bar: 0°-90°); (c) optic axis orientation (color bar: 0°-180°). To avoid erroneous polarization data, areas below a certain intensity threshold are displayed in gray. Image size: 15° (horizontal) × 0.75 mm (vertical, optical distance).
From the PS-OCT data the DOPU image can be calculated [23]. The DOPU image (Fig. 6(a)) quantitatively shows the extent of the depolarization caused by the RPE, while simultaneously showing the high DOPU values retained by the other layers. For calculation of DOPU, due to the smaller speckle size, we choose a smaller evaluation window as compared to our previously published results (Fig. 6(b)). In our old system we used a window size of ~70(x) μm × 18(y) μm whereas with our new UHR system we used a window size of ~35(x) μm × 9(y) μm. By increasing the numerical aperture (increased sample beam diameter at the cornea) we also improved the transversal resolution by a factor of two, as compared to [23]. With this improved resolution we could also reduce the window size in transversal direction. The better spatial resolution of DOPU images, due to the smaller evaluation window size of the UHR PS SD-OCT system is clearly visible.
Fig. 6.

PS-OCT B-scan (1000 A-scans) image of healthy human fovea in vivo. (a) degree of polarization uniformity DOPU (color bar: 0-1) image measured with UHR fiber based PS-OCT system, evaluation window size for DOPU calculation: 35(x) μm × 9(y); (b) DOPU imaged with old system (c.f. our paper [23]): evaluation window size: 70(x) μm × 18(y). Image size: 15° (horizontal) × 0.75 mm (vertical, optical distance).
Figure 7 shows a detailed high density image (1.8° × 150 μm, 500 A-scans) of the RPE region of a healthy fovea measured with two different light sources. One light source had a bandwidth of 50 nm, the second light source had a bandwidth of 110 nm. Figures 7(a),(c),(e) were acquired with 110 nm bandwidth, Figs. 7(b),(d),(f) with 50 nm bandwidth. 7 a,b show retardation, 7 c,d show axis orientation, and 7e,f show the DOPU value. The smaller speckle size obtained at 110 nm bandwidth is clearly visible. The thickness of the layers (e.g. the RPE) appearing in the DOPU images is a convolution of the real tissue extension with the point spread function of the system and with the size of the evaluation window. Due to the smaller evaluation window size in Fig. 7(e), the depolarizing RPE appears thinner than in Fig. 7(f), where the 50 nm light source was used, and therefore a larger evaluation window size had to be used. For these measurements we did not compensate the corneal birefringence [41]. Therefore the slightly different colors of retardation and optic axis orientation of the UHR and the normal resolution PS-OCT images might be caused by a different influence of corneal birefringence, generated by a slight transversal offset of the beam entrance into the pupil between the two measurements.
Fig. 7.
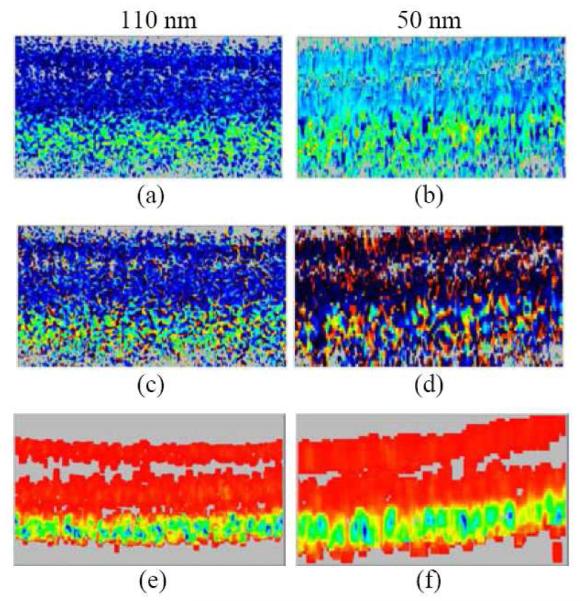
Images of the RPE region of a healthy fovea measured with two different light sources (source 1: 110 nm bandwidth, source 2: 50 nm bandwidth). (a, b) retardation; (c, d) optic axis orientation); (e, f) DOPU; Image size: 1.8° (horizontal) × 150 μm (vertical, optical distance). Color bar see Figs. 5 and 6.
A possible application of PS-OCT is glaucoma diagnosis. In glaucoma, the RNFL is damaged, leading to reduced RNFL thickness and birefringence. This effect can best be observed in the areas of thick RNFL bundles around the optic nerve head. Therefore, circular scans around the optic nerve head are standard protocols of glaucoma diagnostics by OCT.
Figure 8 shows a circular scan around the optic nerve head (healthy subject) with a diameter of ~10 deg (~3 mm diameter). Figure 8(a) shows the intensity image. Because of disturbing ghost images in the area in front of the retina, this region is set to black (see discussion). These ghost images have been eliminated by detecting the front surface of the retina, and setting all intensity pixels in front of the retina to zero, which corresponds to black color in the intensity image and to grey color in the retardation and axis orientation images. The image shows increased thickness of the RNFL, the topmost bright reflecting layer, in the superior and inferior region, and a thin RNFL in the nasal and temporal region. Figures 8(b) and (c) show the retardation and optic axis orientation. To reveal the true birefringent properties of the RNFL we had to compensate for the corneal birefringence. We used the retardation and axis orientation measured locally at the retinal surface around the nerve head to correct for anterior segment birefringence by a software algorithm [41]. One has to be aware that this compensation algorithm works best when compensating low birefringence. In rare cases, if the corneal retardation exceeds 90°, the method would fail. However, in most cases the central corneal retardation is considearbly lower (below ~43° in 80% of eyes [42]). Problems might arise in keratoconus corneas where even in the center of the cornea large birefringence can occur [43].
Fig. 8.

Circumpapillary PS-OCT scan (4000 A-scans) from healthy human retina in vivo. Scan diameter: ~10 deg (corresponds to a circumference of ~9.4 mm, equal to horizontal image width; optical image depth: 1.8 mm). (a) Intensity (log scale); (b) retardation (color bar: 0°-90°); (c) optic axis orientation (color bar: 0°-180°). Orientation of scan from left to right: (S)uperior, (T)emporal, (I)nferior, (N)asal, (S)uperior.
The increase of retardation with depth at the thickest RNFL bundles can be observed in the retardation image 8b. The optic axis orientation image (Fig. 8(c)) shows two full color oscillations from left to right, in good agreement with the radial orientation of the nerve fiber bundles around the optic nerve head (corresponding to 2 × 180° orientation change).
6. Discussion
We have presented a new fiber optic SD PS-OCT scheme based on PM fibers and demonstrated its use for UHR imaging of the human retina in vivo. The method transfers the principles of our previously reported bulk optics PS-OCT systems to fiber optics, thereby combining the main advantages of the bulk optics system with the flexibility and simple alignment of fiber optics based systems, an important step towards the development of commercial PS-OCT systems (the presently available commercial OCT systems are based on fiber optics).
Most of the previously reported fiber based PS-OCT systems used standard (non-PM) single mode fibers. These fibers do not maintain the polarization state of transmitted light: they introduce a phase retardation that varies with fiber bending. To overcome this problem, PS-OCT systems based on these fibers typically probe the sample with at least two polarization states, and the additional information gained in that way is used to compensate for the unknown retardation introduced by the fiber. Some of these systems record two polarization states in parallel while others record them successively. The latter approach has the advantage of a simpler setup requiring just one sensor, however, on the downside, a very stable phase relationship between successive A-scans is required.
Our method is based on PM single mode fibers. It records both polarization channels in parallel and requires only a single input polarization state per measurement location to derive reflectivity, retardation, axis orientation, and Stokes vector. This has some advantages compared to methods that require two or more input states or that record the two polarization channels subsequently: (i) the overall imaging speed can be increased; (ii) lateral oversampling is not required (although it still improves overall image quality by an averaging effect); (iii) the method is insensitive to phase shifts between adjacent A-scans that can occur by vibrations, bulk sample motions, or blood flow. Compared to PS-OCT schemes that modulate the polarization state within an A-scan, our method has the advantage that the full depth resolution is maintained (the sampling density is not split between the two polarization channels), and that neither expensive polarization modulators nor complicated triggering schemes are needed. While our system presently uses two separate spectrometer cameras, it can easily be adapted to single camera systems [44,45] thereby further reducing costs.
The use of PM fibers for PS-OCT and low coherence interferometry has been reported previously with TD setups [28,46]. The main problem that arises with PM fibers is that they just maintain linear polarization states, not arbitrary elliptical states as required with our scheme (elliptical states are decomposed into two linear states with a phase difference dependent on the fiber length). Previous solutions required either splicing of two PM fibers with exactly equal length (which is difficult to achieve), where the slow axis of the first fiber was coupled to the fast axis of the second fiber, and vice versa [46], or the implementation of an additional pair of compensating birefringent wedges that had to be carefully adjusted to compensate the phase shift introduced by the PM fibers [28]. Our method avoids these procedures by exploiting a very useful feature of SD OCT: the direct access to phase information after Fourier transform of the spectral data allows a simple compensation by a single post processing step. The results show that this method allows PS-OCT imaging with the same image quality as previously achieved with our bulk optics setups.
One drawback of our present setup are ghost images that occur at a distance of ~1 mm from the main image. These are probably caused by imperfect optical elements that cause cross coupling of polarization states into the wrong mode of the PM fibers. This problem has also been addressed in ref [28]. In Fig. 8 the ghost images were eliminated by simply cutting them out. For comparison, Fig. 9 shows the intensity data set before this operation. The ghost image is clearly visible. While this simple elimination method usually works well with a normal, healthy retina (they are usually thinner than the separation of the ghost image), problems can arise in various cases of diseases where retinal thickness is increased and the ghost and real images overlap. Solutions could either be to use better optical elements that avoid cross coupling, or to use longer PM fibers that further separate the position of the ghost [28].
Fig. 9.

Circumpapillary B-scan from human retina in vivo. Same data set as in Fig. 8, ghost images not removed.
While we have shown that our PM fiber based approach works well with a stationary setup, applications that require movements of fibers (e.g. endoscopy) might suffer from fiber bending and twisting. To investigate this influence, we made an experiment where we introduced a 360° loop into the fiber of the sample arm in between two measurements. The influence on the measured sample retardation was negligible (< 1°), however, the measured axis orientation changed by ~10 – 15°. This indicates that endoscopy based applications that measure only retardation should work well with our scheme. Applications requiring quantitative axis orientation would need an additional reflector (e.g. a weakly reflecting glass plate) at the distal fiber end that can be used for calibration.
A further improvement of the system reported in this work, as compared to our previous systems, is the use of a broadband light source of 110 nm bandwidth. Only few reports demonstrated such a light source for UHR PS-OCT imaging so far [34–36], and they were limited to time domain systems. While the improved axial resolution in general is an obvious advantage, the reduction of speckle size (further improved by the smaller focal spot size) is of special interest for depolarization imaging. The size of the evaluation window for Stokes vector element averaging, which determines the resolution of DOPU images, is considerably reduced. This will allow RPE segmentation [23] with better resolution, enabling improved detection of small RPE lesions which can be precursors of more advanced stages of, e.g., age related macular degeneration (AMD) [47]. This possibly offers new perspectives for early diagnosis and follow up of AMD and other RPE related diseases.
7. Conclusion
In conclusion, we presented, as we believe for the first time, an ultra high resolution SD-PS-OCT system based on polarization maintaining fibers. The system configuration allows us to use the same algorithms for calculating polarization parameters as used with our previous bulk optics setups. Therefore, the main advantage of needing just a single A-scan per measurement location to obtain reflectivity, retardation, optic axis orientation, and the Stokes vector, is maintained. Apart from reduced measurement time, single input state methods have the advantage of being insensitive to phase changes between A-scans. Fiber length mismatches are compensated by a simple post processing scheme. The use of a broadband light source reduces the speckle size, improving the resolution and image quality especially of DOPU images.
Acknowledgments
Financial support from the Austrian Science Fund (FWF grant P19624-B02) and from the European Union project FUN OCT (FP7 HEALTH, contract no. 201880) is gratefully acknowledged.
Footnotes
OCIS codes: (170.4500) Optical coherence tomography; (230.5440) Polarization sensitive devices; (170.4470) Ophthalmology; (170.4580) Optical diagnostics for medicine
References and Links
- 1.Huang D, Swanson EA, Lin CP, Schuman JS, Stinson WG, Chang W, Hee MR, Flotte T, Gregory K, Puliafito CA, Fujimoto JG. Optical coherence tomography. Science. 1991;254(5035):1178–1181. doi: 10.1126/science.1957169. [DOI] [PMC free article] [PubMed] [Google Scholar]
- 2.Fercher AF, Drexler W, Hitzenberger CK, Lasser T. Optical coherence tomography - principles and applications. Rep. Prog. Phys. 2003;66(2):239–303. [Google Scholar]
- 3.Fercher AF, Hitzenberger CK, Kamp G, Elzaiat SY. Measurement of intraocular distances by backscattering spectral interferometry. Opt. Commun. 1995;117(1-2):43–48. [Google Scholar]
- 4.Häusler G, Lindner MW. Coherence radar” and “spectral radar” - New tools for dermatological diagnosis. J. Biomed. Opt. 1998;3(1):21–31. doi: 10.1117/1.429899. [DOI] [PubMed] [Google Scholar]
- 5.Wojtkowski M, Leitgeb R, Kowalczyk A, Bajraszewski T, Fercher AF. In vivo human retinal imaging by Fourier domain optical coherence tomography. J. Biomed. Opt. 2002;7(3):457–463. doi: 10.1117/1.1482379. [DOI] [PubMed] [Google Scholar]
- 6.Leitgeb R, Hitzenberger CK, Fercher AF. Performance of fourier domain vs. time domain optical coherence tomography. Opt. Express. 2003;11(8):889–894. doi: 10.1364/oe.11.000889. [DOI] [PubMed] [Google Scholar]
- 7.de Boer JF, Cense B, Park BH, Pierce MC, Tearney GJ, Bouma BE. Improved signal-to-noise ratio in spectral-domain compared with time-domain optical coherence tomography. Opt. Lett. 2003;28(21):2067–2069. doi: 10.1364/ol.28.002067. [DOI] [PubMed] [Google Scholar]
- 8.Choma MA, Sarunic MV, Yang CH, Izatt JA. Sensitivity advantage of swept source and Fourier domain optical coherence tomography. Opt. Express. 2003;11(18):2183–2189. doi: 10.1364/oe.11.002183. [DOI] [PubMed] [Google Scholar]
- 9.Chen TC, Cense B, Pierce MC, Nassif N, Park BH, Yun SH, White BR, Bouma BE, Tearney GJ, de Boer JF. Spectral domain optical coherence tomography: ultra-high speed, ultra-high resolution ophthalmic imaging. Arch. Ophthalmol. 2005;123(12):1715–1720. doi: 10.1001/archopht.123.12.1715. [DOI] [PubMed] [Google Scholar]
- 10.Wojtkowski M, Srinivasan V, Fujimoto JG, Ko T, Schuman JS, Kowalczyk A, Duker JS. Three-dimensional retinal imaging with high-speed ultrahigh-resolution optical coherence tomography. Ophthalmology. 2005;112(10):1734–1746. doi: 10.1016/j.ophtha.2005.05.023. [DOI] [PMC free article] [PubMed] [Google Scholar]
- 11.Potsaid B, Gorczynska I, Srinivasan VJ, Chen Y, Jiang J, Cable A, Fujimoto JG. Ultrahigh speed Spectral / Fourier domain OCT ophthalmic imaging at 70,000 to 312,500 axial scans per second. Opt. Express. 2008;16(19):15149–15169. doi: 10.1364/oe.16.015149. [DOI] [PMC free article] [PubMed] [Google Scholar]
- 12.Hee MR, Huang D, Swanson EA, Fujimoto JG. Polarization-sensitive low-coherence reflectometer for birefringence characterization and ranging. J. Opt. Soc. Am. B. 1992;9(6):903–908. [Google Scholar]
- 13.de Boer JF, Milner TE, van Gemert MJC, Nelson JS. Two-dimensional birefringence imaging in biological tissue by polarization-sensitive optical coherence tomography. Opt. Lett. 1997;22(12):934–936. doi: 10.1364/ol.22.000934. [DOI] [PubMed] [Google Scholar]
- 14.de Boer JF, Milner TE, Nelson JS. Determination of the depth-resolved Stokes parameters of light backscattered from turbid media by use of polarization-sensitive optical coherence tomography. Opt. Lett. 1999;24(5):300–302. doi: 10.1364/ol.24.000300. [DOI] [PubMed] [Google Scholar]
- 15.Cense B, Chen TC, Park BH, Pierce MC, de Boer JF. Invivo depth-resolved birefringence measurements of the human retinal nerve fiber layer by polarization-sensitive optical coherence tomography. Opt. Lett. 2002;27(18):1610–1612. doi: 10.1364/ol.27.001610. [DOI] [PubMed] [Google Scholar]
- 16.Cense B, Chen TC, Park BH, Pierce MC, de Boer JF. Thickness and birefringence of healthy retinal nerve fiber layer tissue measured with polarization-sensitive optical coherence tomography. Invest. Ophthalmol. Vis. Sci. 2004;45(8):2606–2612. doi: 10.1167/iovs.03-1160. [DOI] [PubMed] [Google Scholar]
- 17.Mujat M, Park BH, Cense B, Chen TC, de Boer JF. Autocalibration of spectral-domain optical coherence tomography spectrometers for in vivo quantitative retinal nerve fiber layer birefringence determination. J. Biomed. Opt. 2007;12(4):04125. doi: 10.1117/1.2764460. [DOI] [PubMed] [Google Scholar]
- 18.Yamanari M, Miura M, Makita S, Yatagai T, Yasuno Y. Phase retardation measurement of retinal nerve fiber layer by polarization-sensitive spectral-domain optical coherence tomography and scanning laser polarimetry. J. Biomed. Opt. 2008;13(1):014013. doi: 10.1117/1.2841024. [DOI] [PubMed] [Google Scholar]
- 19.Götzinger E, Pircher M, Baumann B, Hirn C, Vass C, Hitzenberger CK. Retinal nerve fiber layer birefringence evaluated with polarization sensitive spectral domain OCT and scanning laser polarimetry: A comparison. J.f Biophoton. 2008;1(2):129–139. doi: 10.1002/jbio.200710009. [DOI] [PubMed] [Google Scholar]
- 20.Pircher M, Götzinger E, Leitgeb R, Sattmann H, Findl O, Hitzenberger CK. Imaging of polarization properties of human retina in vivo with phase resolved transversal PS-OCT. Opt. Express. 2004;12(24):5940–5951. doi: 10.1364/opex.12.005940. [DOI] [PubMed] [Google Scholar]
- 21.Götzinger E, Pircher M, Hitzenberger CK. High speed spectral domain polarization sensitive optical coherence tomography of the human retina. Opt. Express. 2005;13(25):10217–10229. doi: 10.1364/opex.13.010217. [DOI] [PMC free article] [PubMed] [Google Scholar]
- 22.Pircher M, Götzinger E, Findl O, Michels S, Geitzenauer W, Leydolt C, Schmidt-Erfurth U, Hitzenberger CK. Human macula investigated in vivo with polarization-sensitive optical coherence tomography. Invest. Ophthalmol. Vis. Sci. 2006;47(12):5487–5494. doi: 10.1167/iovs.05-1589. [DOI] [PubMed] [Google Scholar]
- 23.Götzinger E, Pircher M, Geitzenauer W, Ahlers C, Baumann B, Michels S, Schmidt-Erfurth U, Hitzenberger CK. Retinal pigment epithelium segmentation by polarization sensitive optical coherence tomography. Opt. Express. 2008;16(21):16410–16422. doi: 10.1364/oe.16.016410. [DOI] [PMC free article] [PubMed] [Google Scholar]
- 24.Miura M, Yamanari M, Iwasaki T, Elsner AE, Makita S, Yatagai T, Yasuno Y. Imaging polarimetry in age-related macular degeneration. Invest. Ophthalmol. Vis. Sci. 2008;49(6):2661–2667. doi: 10.1167/iovs.07-0501. [DOI] [PMC free article] [PubMed] [Google Scholar]
- 25.Saxer CE, de Boer JF, Park BH, Zhao Y, Chen Z, Nelson JS. High-speed fiber based polarization-sensitive optical coherence tomography of in vivo human skin. Opt. Lett. 2000;25(18):1355–1357. doi: 10.1364/ol.25.001355. [DOI] [PubMed] [Google Scholar]
- 26.Yamanari M, Makita S, Yasuno Y. Polarization-sensitive swept-source optical coherence tomography with continuous source polarization modulation. Opt. Express. 2008;16(8):5892–5906. doi: 10.1364/oe.16.005892. [DOI] [PubMed] [Google Scholar]
- 27.Oh WY, Yun SH, Vakoc BJ, Shishkov M, Desjardins AE, Park BH, de Boer JF, Tearney GJ, Bouma BE. High-speed polarization sensitive optical frequency domain imaging with frequency multiplexing. Opt. Express. 2008;16(2):1096–1103. doi: 10.1364/oe.16.001096. [DOI] [PMC free article] [PubMed] [Google Scholar]
- 28.Al-Qaisi MK, Akkin T. Polarization-sensitive optical coherence tomography based on polarization-maintaining fibers and frequency multiplexing. Opt. Express. 2008;16(17):13032–13041. doi: 10.1364/oe.16.013032. [DOI] [PubMed] [Google Scholar]
- 29.Drexler W. Ultrahigh-resolution optical coherence tomography. J. Biomed. Opt. 2004;9(1):47–74. doi: 10.1117/1.1629679. [DOI] [PubMed] [Google Scholar]
- 30.Wojtkowski M, Srinivasan V, Fujimoto JG, Ko T, Schuman JS, Kowalczyk A, Duker JS. Three-dimensional retinal imaging with high-speed ultrahigh-resolution optical coherence tomography. Ophthalmology. 2005;112(10):1734–1746. doi: 10.1016/j.ophtha.2005.05.023. [DOI] [PMC free article] [PubMed] [Google Scholar]
- 31.Schmidt-Erfurth U, Leitgeb RA, Michels S, Povazay B, Sacu S, Hermann B, Ahlers C, Sattmann H, Scholda C, Fercher AF, Drexler W. Three-dimensional ultrahigh-resolution optical coherence tomography of macular diseases. Invest. Ophthalmol. Vis. Sci. 2005;46(9):3393–3402. doi: 10.1167/iovs.05-0370. [DOI] [PubMed] [Google Scholar]
- 32.Chen TC, Cense B, Pierce MC, Nassif N, Park BH, Yun SH, White BR, Bouma BE, Tearney GJ, de Boer JF. Spectral domain optical coherence tomography: ultra-high speed, ultra-high resolution ophthalmic imaging. Arch. Ophthalmol. 2005;123(12):1715–1720. doi: 10.1001/archopht.123.12.1715. [DOI] [PubMed] [Google Scholar]
- 33.Leitgeb R, Drexler W, Unterhuber A, Hermann B, Bajraszewski T, Le T, Stingl A, Fercher A. Ultrahigh resolution Fourier domain optical coherence tomography. Opt. Express. 2004;12(10):2156–2165. doi: 10.1364/opex.12.002156. [DOI] [PubMed] [Google Scholar]
- 34.Pircher M, Götzinger E, Leitgeb R, Sattmann H, Hitzenberger CK. Ultrahigh resolution polarization sensitive optical coherence tomography. Proc. SPIE. 2005;5690:257–262. [Google Scholar]
- 35.Wiesauer K, Pircher M, Goetzinger E, Hitzenberger CK, Engelke R, Ahrens G, Gruetzner G, Stifter D. Transversal ultrahigh-resolution polarizationsensitive optical coherence tomography for strain mapping in materials. Opt. Express. 2006;14(13):5945–5953. doi: 10.1364/oe.14.005945. [DOI] [PubMed] [Google Scholar]
- 36.Moreau J, Loriette V, Bocarra AC. Full-Field Birefringence Imaging by Thermal-Light Polarization-Sensitive Optical Coherence Tomography. II. Instrument and Results. Appl. Opt. 2003;42(19):3811–3818. doi: 10.1364/ao.42.003811. [DOI] [PubMed] [Google Scholar]
- 37.Hitzenberger CK, Goetzinger E, Sticker M, Pircher M, Fercher AF. Measurement and imaging of birefringence and optic axis orientation by phase resolved polarization sensitive optical coherence tomography. Opt. Express. 2001;9(13):780–790. doi: 10.1364/oe.9.000780. [DOI] [PubMed] [Google Scholar]
- 38.Wojtkowski M, Srinivasan V, Ko T, Fujimoto J, Kowalczyk A, Duker J. Ultrahigh-resolution, high-speed, Fourier domain optical coherence tomography and methods for dispersion compensation. Opt. Express. 2004;12(11):2404–2422. doi: 10.1364/opex.12.002404. [DOI] [PubMed] [Google Scholar]
- 39.Cense B, Koperda E, Brown JM, Kocaoglu OP, Gao W, Jonnal RS, Miller DT. Volumetric retinal imaging with ultrahigh-resolution spectral-domain optical coherence tomography and adaptive optics using two broadband light sources. Opt. Express. 2009;17(5):4095–4111. doi: 10.1364/oe.17.004095. [DOI] [PMC free article] [PubMed] [Google Scholar]
- 40.Zawadzki RJ, Cense B, Zhang Y, Choi SS, Miller DT, Werner JS. Ultrahigh-resolution optical coherence tomography with monochromatic and chromatic aberration correction. Opt. Express. 2008;16(11):8126–8143. doi: 10.1364/oe.16.008126. [DOI] [PMC free article] [PubMed] [Google Scholar]
- 41.Pircher M, Götzinger E, Baumann B, Hitzenberger CK. Corneal birefringence compensation for polarization sensitive optical coherence tomography of the human retina. J. Biomed. Opt. 2007;12(4):10. doi: 10.1117/1.2771560. [DOI] [PubMed] [Google Scholar]
- 42.Knighton RW, Huang XR. Linear birefringence of the central human cornea. Invest. Ophthalmol. Vis. Sci. 2002;43(1):82–86. [PubMed] [Google Scholar]
- 43.Götzinger E, Pircher M, Dejaco-Ruhswurm I, Kaminski S, Skorpik C, Hitzenberger CK. Imaging of birefringent properties of keratoconus corneas by polarization-sensitive optical coherence tomography. Invest. Ophthalmol. Vis. Sci. 2007;48(8):3551–3558. doi: 10.1167/iovs.06-0727. [DOI] [PubMed] [Google Scholar]
- 44.Baumann B, Götzinger E, Pircher M, Hitzenberger CK. Single camera based spectral domain polarization sensitive optical coherence tomography. Opt. Express. 2007;15(3):1054–1063. doi: 10.1364/oe.15.001054. [DOI] [PMC free article] [PubMed] [Google Scholar]
- 45.Cense B, Mujat M, Chen TC, Park BH, de Boer JF. Polarization-sensitive spectral-domain optical coherence tomography using a single line scan camera. Opt. Express. 2007;15(5):2421–2431. doi: 10.1364/oe.15.002421. [DOI] [PubMed] [Google Scholar]
- 46.Davé DP, Akkin T, Milner TE. Polarization-maintaining fiber-based optical low-coherence reflectometer for characterization and ranging of birefringence. Opt. Lett. 2003;28(19):1775–1777. doi: 10.1364/ol.28.001775. [DOI] [PubMed] [Google Scholar]
- 47.Ahlers C, Götzinger E, Pircher M, Golbaz I, Prager F, Schütze C, Baumann B, Hitzenbeger CK, Schmidt-Erfurth U. Imaging of the retinal pigment epithelium in age-related macular degeneration using polarization sensitive optical coherence tomography. Invest. Ophthalmol. Vis. Sci. doi: 10.1167/iovs.09-3817. doi:10.1167/iovs.09-3817. [DOI] [PMC free article] [PubMed] [Google Scholar]