

Summary
The bulge region of adult murine hair follicles harbors epidermal stem cells with multipotent capacity; however, the restricted contributions of these cells under homeostatic conditions indicates that additional stem or progenitor cell populations may be required to maintain squamous and sebaceous lineages. We have identified a distinct population of murine hair follicle keratinocytes residing in the upper isthmus (UI) between the infundibulum and bulge regions that are distinguished by low α6 integrin levels and are negative for CD34 and Sca-1. Purified UI cells give rise to long-term, stable epidermal, follicular and sebaceous lineages and can self-renew in vivo. These cells are non-quiescent and possess a unique transcript profile compared with bulge stem cells and may represent a distinct reservoir of epidermal stem or progenitor cells.
Keywords: Hair follicle, Epidermis, Upper isthmus, Stem cell antigen 1, Tbc1d10c
Introduction
Mammalian epidermis is a perpetually renewing tissue that is sustained by permanently residing multipotent stem cells able to generate multiple differentiated lineages including the interfollicular epidermis (IFE), hair follicle (HF) and sebaceous gland (SG) (Owens and Watt, 2003). The bulge region of the murine HF has long been recognized as a major reservoir for epidermal keratinocyte stem cells (Cotsarelis et al., 1990; Fuchs et al., 2004; Cotsarelis, 2006) and recently these cells have been purified based on their unique coexpression of α6 integrin, a marker of proliferative epidermal keratinocytes, and the hematopoietic stem cell marker CD34 (Trempus et al., 2003).
The stem cell capacity of HF bulge keratinocytes has been validated based on the adapted criteria developed in the hematopoietic system regarding infrequent cell division, self-renewal, clonogenicity and multipotency (Trempus et al., 2003; Blanpain et al., 2004; Morris et al., 2004). However, under homeostatic conditions, bulge cells primarily contribute to HF compartments (Ghazizadeh and Taichman, 2001; Levy et al., 2005) but not the SG (Ghazizadeh and Taichman, 2001; Horsley et al., 2006) or IFE (Ghazizadeh and Taichman, 2001; Levy et al., 2005; Ito et al., 2005) indicating the existence of additional epidermal keratinocyte stem cell populations. Recently, a distinct HF region residing above the bulge was identified by the presence of the MTS24 surface marker, and purified MTS24+ cells were highly clonogenic in vitro suggesting that these cells may represent a progenitor cell population (Nijhof et al., 2006). Other studies have provided strong evidence for the maintenance of the epidermal compartment under homeostatic conditions by progenitor IFE cell populations (Clayton et al., 2007), suggesting that a similar scenario for progenitor cells may exist for certain HF compartments outside of the bulge region.
In a search for additional markers to identify putative stem cell compartments outside the bulge region, we used the hematopoietic stem cell surface marker stem cell antigen-1 (Sca-1) or lymphocyte activation protein-6A (Ly-6A) (Spangrude et al., 1988). Sca-1 is present in a number of adult stem cell populations (Spangrude et al., 1988; Welm et al., 2002; Oh et al., 2003) and has been reported to regulate self-renewal (Ito et al., 2003) and lineage commitment (Bradfute et al., 2005) in hematopoietic stem cells. In adult skin, Sca-1 surface expression is thought to be excluded from keratinocyte stem cells (Albert et al., 2001) and has been associated with transit-amplifying populations of basal epidermal cells with low clonogenic potential (Triel et al., 2004). Using Sca-1 in conjunction with α6 integrin and CD34 we have identified a distinct region of cells residing within the upper isthmus (UI) of the hair follicle with stem cell characteristics.
Results
Sca-1, CD34 and α6 integrin surface expression delineates three distinct hair follicle compartments
Previous studies implicated Sca-1 expression as a marker for non-label retaining cell populations in the adult epidermis (Albert et al., 2001) and it is enriched in basal epidermal cells with low clonogenic potential (Triel et al., 2004). Therefore, the localization of Sca-1-positive cells, presumed to be transit-amplifying cells, may give new insight into the organization of transit, progenitor and/or stem cell compartments within the epidermis. To verify the localization of Sca-1-positive epidermal keratinocytes we conducted extensive immunofluorescence labeling for Sca-1 in adult murine skin. Immunofluorescence labeling for Sca-1 was conducted in conjunction with α6 integrin and CD34 surface proteins in epidermal whole mounts and histological sections of murine skin. As expected, α6 integrin expression was continuous throughout the basal layer of IFE and HFs (Fig. 1A,E,G) (Watt, 2002) and CD34 and cytokeratin K15 expression were localized to the bulge region of HFs (Fig. 1C,I; supplementary material Fig. S2) (Trempus et al., 2003). Sca-1 expression was detected in the infundibulum (IFD) region of the HF and the basal layer of the IFE, but Sca-1 was absent in all HF areas below the IFD and sebaceous duct, including the bulge region (Fig. 1B,F,H; supplementary material Fig. S2). α6 integrin colocalized with Sca-1 in the IFD of HFs and in the IFE but not in the bulge region where α6 colocalizes with CD34 or in a distinct region between the IFD-sebaceous duct border and the bulge (Fig. 1D,J). Although not quantifiable by immunofluorescence labeling, this small band of HF cells appears to exhibit lower surface levels of α6 integrin (α6L), at least compared with that of the bulge compartment (Fig. 1A). These results show that Sca-1 immunolabeling, in conjunction with α6 integrin and CD34, reveals a distinct region of the HF, located within the UI, below the IFD and sebaceous duct, and above the bulge region (subsequently referred to as UI cells), in which the resident cells appear to exhibit α6LCD34−Sca-1− surface marker expression.
Fig. 1.
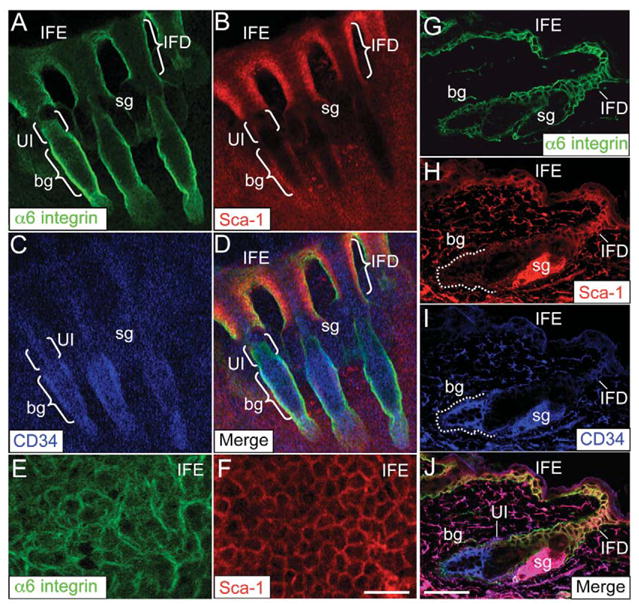
Sca-1 cell surface marker expression in adult murine skin. Epidermal whole mounts prepared from tail skin (A–F) and dorsal skin cryosections (G–J) were labeled with antibodies against the cell surface markers α6 integrin (A,G,E), Sca-1 (B,F,H) and CD34 (C,I). Fluorescent images were taken with a Zeiss LSM 510 confocal microscope. To visualize colocalization, A–C and G–I were merged to highlight UI cells in tail (D) or dorsal (J) skin. High-magnification images of A,B show continuous staining of α6 integrin (E) and Sca-1 (F) in the basal layer of the IFE. bg, bulge; IFD, infundibulum; IFE, interfollicular epidermis; sg, sebaceous gland. Scale bars: 50 μm (A–D and G–I); 10 μm (E,F).
Purification of UI region keratinocytes by flow cytometry
A high-magnification view of an epidermal whole mount illustrates the three distinct epidermal compartments identified by combining α6 (Fig. 2A), CD34 (Fig. 2C) and Sca-1 (Fig. 2B) immunostaining (Fig. 2D). We used fluorescence-activated cell sorting (FACS)-based technology to verify and isolate UI region epidermal keratinocytes based on their potentially low expression of α6 integrin and absence of CD34 (Figs 1, 2), as previously described (Trempus et al., 2003; Blanpain et al., 2004), in conjunction with Sca-1 surface expression. First, the total population of α6-positive basal cells was identified by comparing histograms of unstained and α6-FITC-stained cells (Fig. 2E,H,K). Subsequently, the total population of α6-positive cells (α6all) was gated based on surface levels of CD34 and Sca-1, revealing α6L and α6H CD34-positive bulge cells as previously reported (Blanpain et al., 2004) and α6L+HCD34−Sca-1+ IFE + IFD cells (Fig. 2F,G). α6L and α6H cells were then individually gated based on surface levels of CD34 and Sca-1, where we found α6LCD34−Sca-1− UI cells (Fig. 2I,J) and α6HCD34−Sca-1− cells (Fig. 2L,M). Flow-cytometry-based quantification of these populations revealed that α6LCD34−Sca-1− UI cells represent 5% and α6HCD34−Sca-1− cells represent 2.8% of the live keratinocyte population (Fig. 2J,M).
Fig. 2.

High-magnification view of the hair follicle UI region and FACS analysis of UI epidermal keratinocytes from murine skin. Epidermal whole mounts were probed with antibodies to α6 integrin (A), Sca-1 (B) and CD34 (C). Merged panel (D) shows high magnification image of three HF compartments including α6L+HCD34−Sca-1+ IFE + IFD (P1), α6LCD34−Sca-1− UI (P2) and α6L+HCD34+Sca-1− (P3) regions isolated by FACS below (E–M). (E–M) Keratinocytes were isolated from adult dorsal skin as previously described (Morris, 1994), labeled with α6 integrin, CD34 and Sca-1 antibodies and subjected to flow cytometry. Viable α6-positive cells were identified and further gated based on their surface expression of CD34 and Sca-1. Scale bar: 20 μm.
UI keratinocytes possess high clonogenic and multipotent capacities
To determine the proliferative capacity of α6LCD34−Sca-1− UI cells and α6HCD34−Sca-1− cells, freshly isolated epidermal keratinocytes were sorted using FACS as previously described (Fig. 2) and subsequently plated in equal numbers in complete FAD medium in the presence of mitotically arrested 3T3 fibroblasts (Rheinwald and Green, 1975) for 2 weeks. Keratinocyte colonies were visualized using Rhodamine stain and compared between the six FACS-sorted populations. CD34-positive bulge cells exhibited higher clonogenic capacity compared with interfollicular basal cells with respect to colony number and size (Fig. 3A–C) (Trempus et al., 2003) and α6LCD34−Sca-1− UI cell and α6HCD34−Sca-1− cell populations exhibited a similar clonogenic capacity to bulge stem cells (Fig. 3A–C). Similar results were obtained when FACS-sorted populations were plated in keratinocyte serum-free medium (supplementary material Fig. S1A,B). High-magnification phase images of UI colonies at 2 weeks post plating confirms the presence of small proliferative keratinocytes within these clones and excludes the possibility that the size of UI-derived colonies is primarily due to the presence of large differentiated cells (Fig. 3D–F). Collectively, these results indicate that α6LCD34−Sca-1− and α6HCD34−Sca-1− cells represent distinct populations of highly clonogenic epidermal keratinocytes and Sca-1 is a useful marker to further fractionate clonogenic cells within the epidermis.
Fig. 3.

Colony-forming efficiency of UI epidermal keratinocytes. (A–C) All six FACS-sorted cell populations from Fig. 2 were plated at equal density and cultured for 2 weeks. Cultures were stained with Rhodamine and the average (n=3 plates per group) total colony number (B) and the percent of colonies >4 mm in size (C) were quantified using NIH ImageJ software and statistically compared using a Student’s t-test (*P<0.05, statistically different compared with UI cells; error bars represent s.d.). (D–F) Higher-magnification phase-contrast images of three FACS-sorted populations shown in A.
To assess the in vivo multipotent capacity of α6LCD34−Sca-1− UI cells and α6HCD34−Sca-1− cells, we used the hair reconstitution assay, which tests the capacity for adult mouse keratinocytes to successfully reconstitute skin with the full complement of IFE and pilosebaceous units (Weinberg et al., 1993; Kamimura et al., 1997). Epidermal keratinocytes were isolated from ACTB-EGFP transgenic mice as previously described (Morris, 1994), FACS-sorted into α6L+HCD34−Sca-1+ (IFE + IFD), α6LCD34−Sca-1−(UI), α6L+HCD34+Sca-1− (bulge) and α6HCD34−Sca-1− populations (supplementary material Fig. S3A–D) and surgically implanted onto recipient nude mice. Although hair formation was typically observed at 3 weeks post implantation, skin grafts were recorded and harvested at 6 weeks post grafting to ensure long-term skin and hair reconstitution and exclude any contributions from progenitor populations (Schneider et al., 2003). As expected, skin grafts derived from α6L+HCD34+Sca-1− bulge stem cells developed both skin and hair (Fig. 4A–D) (Blanpain et al., 2004; Morris et al., 2004), whereas α6L+HCD34−Sca-1+ (IFE + IFD) cells did not give rise to hair (Fig. 4G), consistent with previous studies with these keratinocyte populations (Blanpain et al., 2004; Morris et al., 2004). No hair was observed from as many as 11×106 α6L+HCD34−Sca-1+ grafted cells (data not shown) or in the dermal fibroblast control graft (Fig. 4H). α6LCD34−Sca-1− UI cells demonstrated a robust capacity to generate hair follicle and epidermal lineages as reconstituted hair was generated from as few as 2.5×10⁵ grafted α6LCD34−Sca-1− UI cells (Fig. 4E,F; supplementary material Fig. S4). Similar results were obtained in five hair-reconstitution experiments each derived from separate cell-sorting assays, using 2.5×10⁵ UI cells (data not shown). UI cells isolated from FVB mouse skin also reconstituted skin and hair (supplementary material Fig. S4C,D), indicating that the phenotype of UI cells was not unique to the C57Bl/6 genetic background of ACTB-EGFP mice; however, the in vitro clonogenic population of α6HCD34−Sca-1− grafted cells did not reconstitute hair (supplementary material Fig. S4E,F).
Fig. 4.
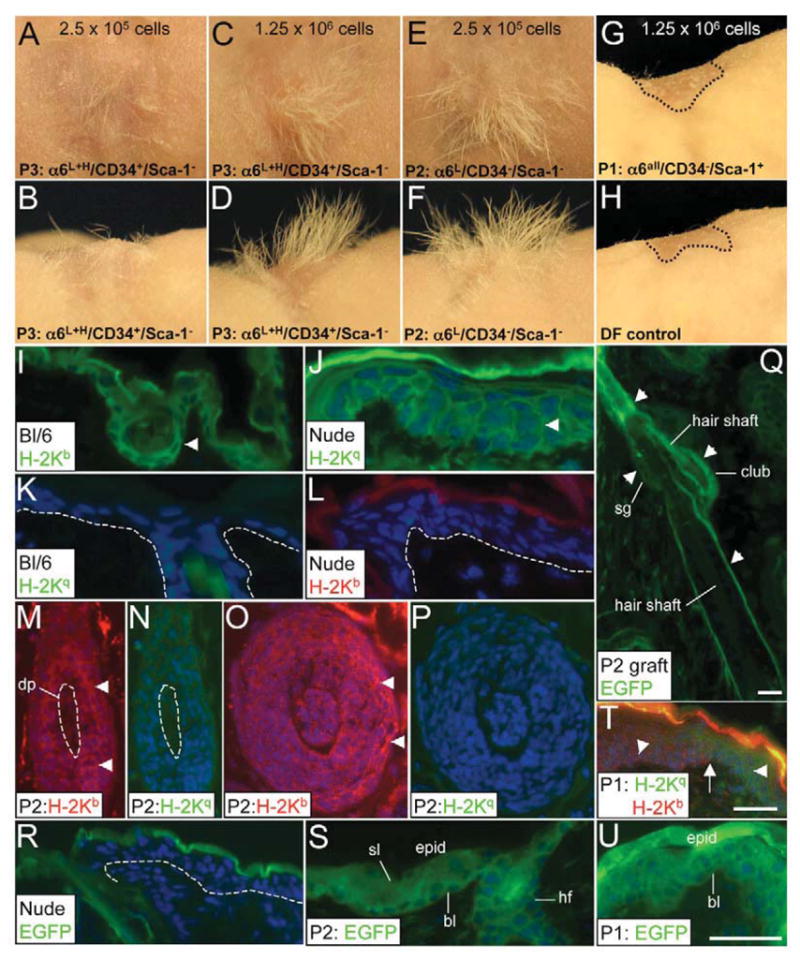
Hair reconstitution assay showing multipotent capacity of UI keratinocytes. (A–H) FACS-sorted keratinocyte populations were mixed with dermal fibroblasts and injected into silicon graft chambers. Chambers were removed 1 week after cell injection and images of reconstituted skin and hair were captured 6 weeks post grafting. The number of FACS-sorted keratinocytes implanted in each graft is indicated. (B,D,F,H) Side view of each panel above. Dashed circle designates the graft perimeter (G,H). (I–U) H-2Kb (I,L,M,O,T), H-2Kq (J–K,N,P,T) and GFP (Q–S,U) immunofluorescent detection in C57Bl/6 (I,K) and nude (J,L) skin and a skin graft reconstituted from UI (M–S) or IFE + IFD (T–U) cells. Arrowheads indicate positive immunofluorescence and arrow points to boundary between grafted epidermis (H-2Kb-positive) and endogenous nude epidermis (H-2Kq-positive) at the graft periphery (T). DF, dermal-fibroblast-only graft (control); DP, dermal papilla; bl, basal layer; sl, suprabasal layer. Dashed line delineates epidermal basal layer (K,L,R) or encircles dermal papilla cells (M–N). Scale bars: 20 μm.
Verification of UI cell-derived follicular, sebaceous and squamous lineages in skin grafts
The presence of foreign grafted cells in the reconstituted hair and skin grafts was detected by two immunolabeling approaches: immunostaining for MHC class molecules H-2Kq (host nude background) versus H-2Kb (C57Bl/6 background) (Kamimura et al., 1997) and GFP to confirm the presence of ACTB-EGFP-derived transgenic cells in UI skin grafts. H-2Kb labeling was present throughout the epidermal layers of C57Bl/6 epidermis (Fig. 4I) and HFs from skin grafts reconstituted from FACS-sorted UI cells (Fig. 4M,O) but not in host nude skin (Fig. 4L). Likewise, H-2Kq labeled nude IFE (Fig. 4J) but was absent in C57Bl/6 epidermis (Fig. 4K) or H-2Kb-positive hair follicles in UI cell grafts (Fig. 4N,P). GFP protein was detected in all regions of the HF, including the SG, and IFE in skin grafts derived from UI cells (Fig. 4Q,S) but not in host nude skin in the graft periphery (Fig. 4R). Importantly, GFP-positive club hairs adjoined to GFP-positive anagen HFs were observed in skin grafts derived from UI cells (Fig. 4Q) demonstrating the functional capacity of long-term, established UI cell-derived HFs to undergo the HF cycle thereby illustrating the in vivo self-renewal capacity of UI cells. Finally, the IFE in skin grafts derived from α6L+HCD34−Sca-1+ (IFE + IFD) cells labeled positive for both H-2Kb and GFP proteins, indicating that these cells do have the unipotent capacity to reconstitute IFE (Fig. 4T,U) and probably represent a progenitor keratinocyte population.
UI keratinocytes are non-quiescent cells
To determine the relative cycling rate of cells in the UI region we measured the DNA content of FACS-sorted populations of UI, bulge and IFE + IFD cells in both telogen (resting) and anagen (proliferative) epidermis as previously described (Vindelov et al., 1983). In telogen HFs a high percentage (1.82%) of Sca-1-positive IFE + IFD basal cells were detected in S-phase (Fig. 5A,G) compared with just 0.14% of CD34-positive bulge cells (Fig. 5E,G). In contrast to bulge cells, a high proportion of S-phase UI cells (1.20%) were observed in telogen skin (Fig. 5C,G). The S-phase population quantifiably increased in all three populations during the anagen phase of the hair cycle where UI cells still maintained a much higher percentage of cycling cells compared with bulge cells (Fig. 5B,D,F). The distribution of S-phase cells within these three epidermal compartments in telogen mouse skin was confirmed by flow cytometry analysis measuring EdU incorporation into genomic DNA after a single EdU pulse (supplementary material Fig. S5). The in vitro clonogenic population of α6HCD34−Sca-1− cells also contained an S-phase compartment of comparable size to UI cells (data not shown).
Fig. 5.

Cell cycle status and label retention in UI keratinocytes. (A–F) FACS dot blot showing DNA content (y-axis) vs pulse width (x-axis) from FACS-sorted keratinocytes isolated from telogen (A,C,E) and anagen (B,D,F) skin. (G) Quantification of G0-G1, S or G2-M phase cells. (H) Cells retaining label are represented as the average percentage of BrdU-positive cells for each FACS-sorted population within the total number of BrdU-positive cells in the entire epidermis per experiment. 2000 cells per population were counted in each experiment and data represent the average of two experiments. *P<0.05, statistically significant from UI and IFE + IFD cells (Student’s t-test). Error bars denote s.d.
To confirm the non-quiescent status of UI region cells we next conducted label retention analysis as previously described (Braun et al., 2003). Neonatal mice received six injections of BrdU to label proliferating skin cells followed by a 6-week chase. FACS-sorted populations of UI, bulge and IFE + IFD cells were derived from adult telogen dorsal skin and cytospun onto histological slides. FACS-sorted epidermal cells were then labeled with antibodies to detect BrdU incorporation as a marker of label-retaining cells and quantified. Similarly to previous studies (Blanpain et al., 2004), bulge cells constitute the majority (79%) of the total pool of label-retaining epidermal cells; however, UI cells retained only slightly more label (7.9%) compared with IFE + IFD cells (5.4%) (Fig. 5H). Collectively, these results indicate that cells localized to the UI region of the HF are non-quiescent compared with bulge HF cells.
Microarray analysis confirms a distinct gene expression profile in UI cells
We conducted microarray analysis to confirm that α6LCD34−Sca-1− cells isolated by FACS are localized to the UI region of the HF and to determine whether UI keratinocyte-derived transcript profile was distinct from bulge stem cells and/or IFE cells (see supplementary material Fig. S6 for experimental design). Total RNA was isolated from three FACS-sorted populations, α6LCD34−Sca-1− UI, α6LCD34+Sca-1− bulge and α6all cells, processed into biotinylated cRNA and analyzed for differences in gene expression levels on Mouse Genome 430 2.0 Array Chips (Affymetrix). Gene chip data were compared between the three groups using ArrayAssist 4.1 (Stratagene).
To validate the microarray expression analysis and to confirm the in vivo location of FACS-sorted UI keratinocytes we first compared the mRNA levels of the surface markers used to identify the UI region – α6 integrin, CD34 and Sca-1 – in UI cells versus bulge and α6all populations. Consistent with immunolabeling in adult skin (Fig. 1), α6 integrin mRNA levels were lower in UI cells compared with the α6-positive and CD34-positive bulge stem cell populations (Table 1). Sca-1 mRNA levels were 3.8 times lower in UI cells versus α6all cells and were equal to bulge cells (Table 1), which also lack surface expression of Sca-1 (Figs 1, 2), whereas CD34 mRNA levels were 30-fold higher in bulge cells compared with UI cells (Table 1).
Table 1.
Selected genes for microarray validation in UI keratinocytes
| Gene | UI vs α6-positive | UI vs bulge stem cells |
|---|---|---|
| α6 integrin | −2.6 | −1.6 |
| Stem cell antigen 1 | −3.2 | 1.0 |
| CD34 | −3.8 | −30 |
| CD44 | +1.6 | +2.5 |
| Keratin K14 | −1.6 | −1.2 |
| Keratin K5 | −1.5 | 1.0 |
+, fold induction; −, fold repression. Genes were searched by name and were not selected by Benjamini-Hochberg test correction.
Using a Student’s t-test comparison with a Benjamini-Hochberg correction, 37 genes were found uniquely altered in UI cells compared with both Sca-1-positive IFE + IFD cells and CD34-positive bulge cells (P<0.05) (Table 2) indicating that the transcript profile in UI cells is distinct. Amphiregulin (Areg), a potent keratinocyte mitogen, was found to be highly induced in UI cells consistent with the high intrinsic cycling rate in these cells (Fig. 5), and, similarly to α6 integrin, its heterodimeric partner β4 was also uniquely downregulated in UI cells (Table 2). Four enriched and 79 downregulated transcripts were common to both UI and bulge stem cells compared with α6all cells (supplementary material Table S1). To further validate the enriched transcripts detected by microarray analysis and to gain insight as to whether any of the transcripts may be exclusive to UI cells, we conducted semi-quantitative RT-PCR analysis on six enriched genes from Table 2 in cDNA samples generated from FACS-sorted UI, bulge and IFE + IFD cell populations (Fig. 6A). Densitometric quantification of amplification products verified that all six genes were highly enriched in UI cells and, interestingly, the transcripts for Tbc1d10c and Dennd1c appear to be exclusive to UI cells (Fig. 6B).
Table 2.
Uniquely regulated genes in UI keratinocytes
| UI vs α6-positive | UI vs bulge stem cells | |
|---|---|---|
| Enriched genes | ||
| Eosinophil-associated, ribonuclease A | 14.5 | 36.2 |
| Immunoglobulin heavy chain 6 | 13.0 | 39.4 |
| Selectin | 11.1 | 18.8 |
| DENN/MADD domain containing 1C | 10.6 | 11.4 |
| GRP1-associated scaffold protein | 10.5 | 15.5 |
| Sterol O-acyltransferase 1 | 10.3 | 17.8 |
| Transmembrane protein 45b | 10.0 | 16.1 |
| TBC1 domain family, member 10c | 7.3 | 8.9 |
| Amphiregulin | 7.2 | 20.3 |
| Pstpip2 | 6.1 | 3.8 |
| Septin 11 | 5.4 | 11.1 |
| Transmembrane 4 superfamily member 1 | 5.3 | 13.9 |
| Regulator of G-protein signaling 10 | 4.4 | 11.8 |
| Protein tyrosine phosphatase, non-receptor type 6 | 4.2 | 4.7 |
| Glutathione S-transferase μ1 | 3.6 | 3.5 |
| Cathepsin C | 2.4 | 11.9 |
| Interferon-γ-inducible protein 30 | 2.2 | 2.3 |
| Leptin receptor overlapping transcript-like 1 | 2.1 | 2.6 |
| Downregulated genes | ||
| Solute carrier family 27, member 3 | 7.9 | 5.6 |
| Glycosyltransferase-like 1B | 5.0 | 8.8 |
| Integrin β4 | 4.2 | 5.7 |
| v-maf AS42 oncogene homolog (Maf) | 3.9 | 7.6 |
| Serine peptidase inhibitor, clade H, member 1 | 3.6 | 11.2 |
| G-protein signaling modulator 2 | 3.6 | 4.5 |
| RAS-related C3 botulinum substrate 3 | 3.6 | 5.2 |
| Leprecan-like 1 | 3.6 | 4.0 |
| Hydroxy-δ5-steroid dehydrogenase | 3.5 | 2.8 |
| Plexin B1 | 3.1 | 5.1 |
| Fibroblast growth factor receptor 3 | 3.0 | 3.0 |
| Solute carrier family 7, member 6 | 2.9 | 2.4 |
| Growth arrest specific 1 | 2.8 | 8.1 |
| Procollagen, type XVII α1 | 2.8 | 3.5 |
| Jagged 2 | 2.7 | 2.1 |
| G-protein-coupled receptor 126 | 2.7 | 4.1 |
| Connector enhancer of kinase suppressor of Ras 1 | 2.1 | 3.3 |
| Platelet-derived growth factor α | 2.1 | 4.3 |
| TBC1 domain family, member 8 | 2.0 | 2.5 |
Fig. 6.
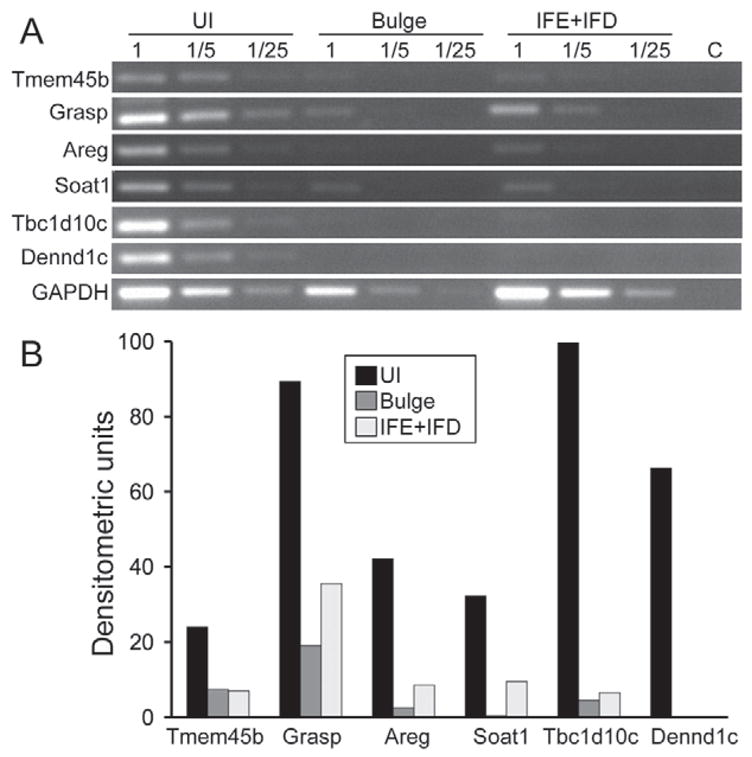
Verification of enriched transcripts in UI cells by RT-PCR analysis. (A) Total RNA from FACS sorted UI, bulge and IFE + IFD epidermal cells was used to generate first-strand cDNA for semi-quantitative RT-PCR analysis using primers for genes enriched in UI cells (Table 2). RT-PCR for GAPDH was conducted as an internal control. Each RT-PCR reaction was generated from undiluted (1), 1:5 dilution (1/5) or a 1:25 dilution (1/25) of each cDNA sample. No amplification products were observed in the water control (C) samples. (B) Quantification of RT-PCR transcript levels generated from undiluted cDNA samples using NIH ImageJ software. Data are expressed as arbitrary densitometric units relative to GAPDH levels.
Cytospun fractions of FACS-sorted UI cells showed low levels of α6 integrin protein (Fig. 7A) compared with Sca-1-positive IFE + IFD cells (Fig. 7C) and positive immunolabeling for the basal keratinocyte marker K14 (Fig. 7B). A total of 94% (272 K14-positive/294 DAPI-positive cells) of cytospun UI cells were K14 positive, further confirming that FACS-sorted UI cells represent a highly pure basal keratinocyte population. Another hematopoietic stem cell surface protein CD44 (Ponta et al., 2003) was enriched in UI cells (Table 1) and confirmed by immunofluorescent labeling in epidermal whole mounts from murine skin (Fig. 7E). High CD44 surface labeling was observed on cells located in the UI region of the HF and little to no CD44 was detected in the bulge region (Fig. 7E). CD44 surface expression does not appear to be unique to UI cells, as a large percentage of epidermal keratinocytes excluding the bulge were found to be positive for CD44 (Fig. 7F,G). However, these results identify high CD44 surface levels as a putative positive selection marker to distinguish UI cells from the bulge region, and support the claim that the α6LCD34−Sca-1− FACS-sorted population is derived from the UI region of the HF.
Fig. 7.
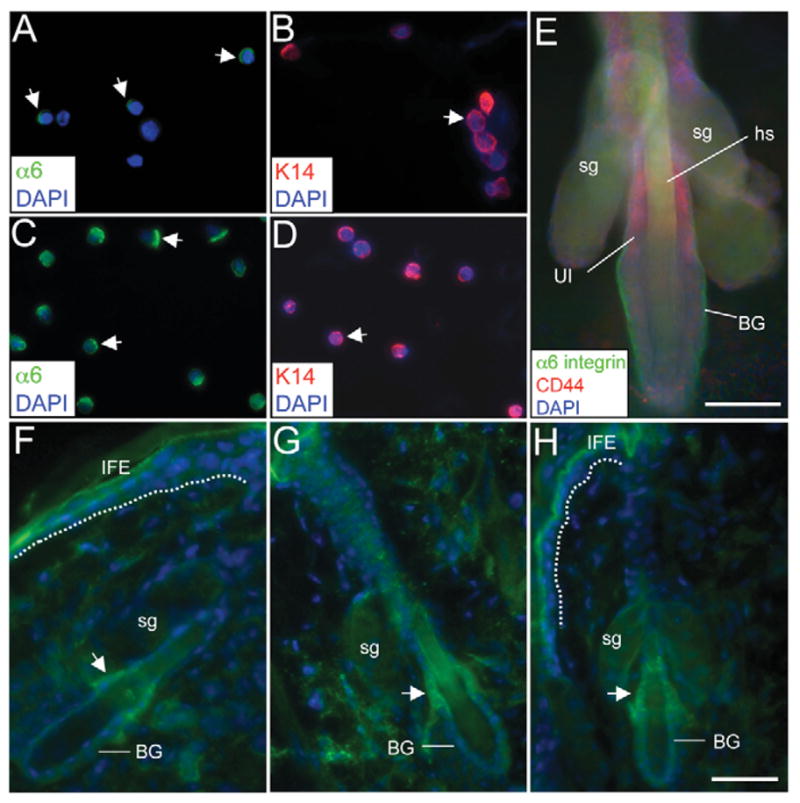
Immunofluorescent labeling of FACS-sorted UI cells and murine HFs. (A–D) α6 integrin (A,C) and K14 (B,D) immunofluorescence in cytospun UI and IFE + IFD FACS-sorted cells. Arrowheads indicate polarized surface α6 or cytoplasmic K14 expression. (E) α6 integrin and CD44 immunofluorescence in a HF. (F–H) Tbc1d10c immunofluorescence in cryosections of adult mouse skin. Three separate HFs are shown. Arrowheads indicate positive Tbc1d10c labeling in the UI region and a hashed line demarcates the basal layer of the IFE (I,K). Staining in the cornified IFE was also observed in control sections stained with secondary antibodies alone (data not shown). BG, bulge; hs, hair shaft; sg, sebaceous gland. Scale bars: 100 μm.
To further support the localization of FACS-sorted α6LCD34−Sca-1− cells in the UI region, adult murine skin was probed with antibodies against Tbc1d10c, a transcript uniquely found in this population (Fig. 6). Tbc1d10c is also named Carabin for its inhibitory roles in calcineurin and Ras signaling in the regulation of T-cell activation (Pan et al., 2007); however, the expression pattern of Tbc1d10c in skin is unknown. Tbc1d10c protein localized to the UI region in adult telogen HFs but was not detected in the bulge or infundibulum regions of the HF or the IFE (Fig. 7I–K). These results validate the microarray and RT-PCR analysis of transcripts unique regulated in UI HF cells (Fig. 6) and further support the idea that UI cells represent a phenotypically distinct HF compartment. In addition, they confirm that the anatomical location of the FACS-sorted α6LCD34−Sca-1− population is in the UI of the HF. Although calcineurin levels were not uniquely regulated in UI cells (Table 2), at least one gene involved in canonical Ras signaling, CNKSR2, was suppressed in UI cells (Table 2). However, any impact of the presence of Tbc1d10c in UI cells on calcineurin or Ras pathways remains to be determined.
Discussion
We have identified a unique population of keratinocytes exhibiting the regenerative characteristics of epidermal stem cells and residing in the UI region of the HF of adult murine skin comprising an area extending from the infundibulum and sebaceous duct to the bulge (Fig. 8). The resident cells in the UI are characterized by α6LCD34−Sca-1− surface levels and have high clonogenic, multipotent and self-renewal capacities. The UI region is distinguished from both the bulge and the lower isthmus HF regions based on the absence of keratin K15 expressing cells (supplementary material Fig. S2). The UI region is likely to be contained within a recently described area of HF cells expressing the surface marker MTS24 reported to have characteristics of stem cells or progenitor cells (Nijhof et al., 2006), although only the proliferative capacity of MTS24-positive cells was analyzed. The MTS24-positive zone appears to extend beyond the borders of the UI region and, unlike the UI, is populated by cells expressing high levels of α6 integrin. Our results indicate that cells in the UI region are distinguished by low α6 levels suggesting the existence of α6L and α6H HF keratinocyte populations in the MTS24-positive zone (Fig. 8). Identification of additional positive surface markers for this region will be critical to confirm whether cells from the UI region contain lower surface levels of α6 integrin compared with other epidermal compartments. We did identify a small population α6HCD34−Sca-1− keratinocytes that exhibited high clonogenic capacity, but were unable to reconstitute hair follicles suggesting that these cells may represent a progenitor population(s) and may also be contained within the previously reported MTS24-positive hair follicle zone (Nijhof et al., 2006). The continuous staining pattern for Sca-1 throughout the basal layer of the IFE (Fig. 1) also supports a follicular residence for α6HCD34−Sca-1− cells, although our results cannot conclusively rule out the existence of these cells within the IFE. Finally, whereas UI cells differ from bulge cells in their gene expression pattern, MTS24-positive cells were reported to have a gene expression profile similar to that of bulge-derived epidermal stem cells (Nijhof et al., 2006), thereby further distinguishing UI cells from MTS24-positive cells. In any case, until the gene encoding MTS24 is identified, we cannot confirm the status of MTS24 in purified UI keratinocytes.
Fig. 8.

Schematic of UI and MTS24 HF compartments. Distinguishing surface marker expression profiles for α6 integrin are shown as high (H, bright green) or low (L, pale green). Two possible compartments for α6HCD34−Sca-1− cells, bordering either side of the UI region (left panel) or distributed throughout the basal layer of the IFE (right panel), are shown. sd, sebaceous duct; hs, hair shaft; dp, dermal papilla.
The presence of Sca-1 in basal epidermal keratinocytes strongly correlated with cells committed to squamous differentiation, suggesting that similarly to the role of Sca-1 in hematopoietic lineage determination (Bradfute et al., 2005), Sca-1 may also direct epidermal lineage fate skewing cells towards squamous differentiation. This concept is consistent with the fact that the total population of Sca-1-positive basal cells (IFE + IFD) could regenerate skin but not HFs (Fig. 4). Our results do not exclude the existence of stem cells within the IFE (Clayton et al., 2007), but rather indicate that putative populations of IFE stem cells may have a diminished capacity for hair lineage commitment.
These results identify and functionally characterize a region of UI hair follicle cells with previously unreported multipotent capacity and are a direct extension of previous studies that first identified and characterized bulge epidermal keratinocytes using surface maker expression (Trempus et al., 2003) and subsequently assessed their epidermal regenerative capacity (Blanpain et al., 2004; Morris et al., 2004). Similarly to these previous studies, our results provide the groundwork for future studies to determine how this UI keratinocyte population may contribute to skin homeostasis, although any potential role for UI keratinocytes in the maintenance of epidermal and follicular lineages is unclear. In addition, whether UI cells can regenerate or contribute to the maintenance of human epidermal lineages remains to be determined.
In contrast to bulge-derived CD34-positive stem cells, UI cells are actively cycling cells in vivo – a feature shared with other epithelial stem cell populations (Marshman et al., 2002; Barker et al., 2007). Since previous labeling methods have been based on the assumption that epidermal stem cells are quiescent (Tani et al., 2000), UI cells may have been largely overlooked and validated together with non-quiescent transit-amplifying cells. Overall, the multipotent capacity and distinct epigenetic environment of UI cells has important implications for regenerative therapies for epidermal disease states and wound healing.
Materials and Methods
Immunofluorescence
Murine tail skin epidermal whole mounts and dorsal skin cryosections were prepared as previously described (Braun et al., 2003) and stained with the following cell surface antibodies: α6 integrin, FITC-conjugated CD49f (clone GoH3; BD Biosciences); Sca-1, PE-conjugated Ly-6A/E (clone D7; BD Biosciences); CD34, APC-conjugated CD34 (clone RAM34; BD Biosciences); CD44, APC-conjugated CD44 (clone IM7; BD Biosciences). Confocal images were acquired using a Zeiss 510 META laser-scanning confocal microscope with 488 nm, 543 nm and 633 nm laser excitation, and 505–550 nm, 560–615 nm and 649–702 nm band-pass filters, respectively.
Dorsal skins were obtained from 7-week old adult mice. Skin grafts were typically harvested 6 weeks post grafting. All tissue specimens were embedded in O.C.T. and cryopreserved in liquid-nitrogen-cooled isopentane. Skin and skin graft cryosections (6–7 μm) were fixed in either 4% paraformaldehyde or acetone, and stained with the following antibodies: α6 integrin, FITC-conjugated CD49f (BD Biosciences); Sca-1, biotin-conjugated Ly-6A/E (BD Biosciences); Alexa Fluor 647-conjugated H-2Kb (BioLegend); FITC-conjugated H-2Kq (BD Biosciences); GFP (Abcam); Tbc1d10c (ProSci). GFP and Tbc1d10c antibodies were detected with species-specific Alexa Fluor 488 secondary antibodies (Invitrogen). Immunolabeling was captured using a Zeiss Axioplan II microscope with fluorescent capabilities.
Flow cytometry
Primary adult epidermal keratinocytes were isolated from the dorsal skin of 7-week old FVB/N (Taconic), C57Bl/6 (Taconic) or β-actin promoter-driven EGFP transgenic, Tg(ACTB-EGFP)1Osb (Jackson Laboratories), mice as previously described (Morris, 1994). Freshly isolated epidermal keratinocytes were suspended in 1% BSA-PBS and stained with FITC-conjugated CD49f (C57Bl/6 and FVB/N cells) or biotin-conjugated CD49f with streptavidin-Alexa Fluor 680 (ACTB-EGFP cells), PE-conjugated Ly-6A/E (Sca-1) and APC-conjugated CD34 antibodies. After washing, cells were stained with 4′,6-Diamidino-2-phenylindole dihydrochloride (DAPI) and then subjected to FACS analysis using a FACS Aria sorter and FACS DiVa 4.1 software (BD Biosciences). In all cases, cells flew under 30 psi pressure through a 100 μm nozzle. After eliminating DAPI-positive dead cells, FITC, PE and APC signals were collected through 530/30, 576/26 and 660/20 nm band-pass filters, respectively. The gates for separating α6-FITC bright and dim populations were set based on the boundaries of two CD34-positive populations on the APC vs FITC contour plot (Blanpain et al., 2004). For each hair reconstitution experiment, typically three dorsal skins were pooled to generate 50–60×106 epidermal cells. From this population, a total of 30×106 viable α6+ cells were identified and subsequently divided into 3×10⁶ α6L+HCD34+ bulge cells, 2×10⁶ UI cells and 20×106 α6L+HCD34−Sca-1+ (IFE + IFD) cells by FACS sorting. For colony-forming efficiency assays, one dorsal skin generating 15–20×106 basal cells per experiment was used.
DNA content and label-retention analysis
FACS-sorted cells were analyzed for DNA content using two methods. For the NP-40/trypsin method (Vindelov et al., 1983), propidium iodide-stained nuclei were acquired using the FACS Aria and pulse processing was used to exclude doublets. Data were analyzed by ModFit LT (Verity Software House, USA). In some cases 7-week-old mice received a single i.p. injection (50 mg/kg) of the thymidine nucleoside analog 5-ethynyl-2′-deoxyuridine (Edu) (Invitrogen) to label proliferating cells. Mice were sacrificed 16 hours after Edu injection and epidermal cells were surface labeled using Sca-1 (PE), CD34 (APC) and α6 integrin (PE-Cy7) antibodies as previously described. Edu incorporation was visualized in FACS-sorted bulge, UI and IFE + IFD populations using the Click-it 488 kit as per the manufacturer’s instructions (Invitrogen) on an LSRII FACS scanner (BD Biosciences). Data were analyzed by FlowJo software (Tree Star).
For label-retention analysis, mice received twice-daily subcutaneous injections of 20 mg/kg 5-Bromo-2′-deoxyuridine (BrdU) (Sigma) at postnatal days D9, D10 and D11 as previously described (Braun et al., 2003). Dorsal skins were harvested from 7-week-old mice and epidermal cells (pooled from three mice) were surface labeled using Sca-1 (PE), CD34 (APC) and α6 integrin (PE-Cy7) antibodies as previously described. FACS sorting was conducted using a FACS Aria sorter and FACS DiVa 4.1 software (BD Biosciences) as described above with the exception that cells were sorted directly onto histological slides (1000 cells/slide). Cells were fixed and stained with antibodies against BrdU (BD Biosciences) followed by detection with Alexa Fluor 488-conjugated secondary antibodies (Invitrogen). The total number of BrdU-positive cells was quantified for each FACS-sorted population (two slides/group) and the entire experiment was repeated once.
Clonogenicity assay
Keratinocytes were sorted by FACS directly into tissue culture dishes using the ACDU function on the FACS Aria at 1000 cells per well in 12-well plates pre-plated with mitotically-arrested 3T3 fibroblasts (strain J2) in complete FAD medium (Rheinwald and Green, 1975) consisting of three parts Dulbecco’s modified Eagle’s medium (Invitrogen) and one part Ham’s F12 medium (Invitrogen) supplemented with 1.8×10⁻⁴ M adenine (Sigma-Aldrich), 0.5 μg/ml hydrocortisone (Sigma-Aldrich), 5 μg/ml insulin (Sigma-Aldrich), 10−10 M cholera enterotoxin (Sigma-Aldrich), 10 ng/ml EGF (Peprotech), 10% FBS (Hyclone), 100 U/ml penicillin (Invitrogen) and 100 μg/ml streptomycin (Invitrogen). This plating density typically resulted in a seeding efficiency of 30–68 cells/cm2 (supplementary material Fig. S1), which is within the clonogenic density range. Cultures were incubated at 32°C for 2 weeks, after which the 3T3 cells were removed and keratinocyte colonies were fixed and stained with Rhodamine. Total colony numbers and the percentage of colonies >4 mm in size were counted using NIH ImageJ software. In some cases, equal numbers of FACS-sorted cells were plated in keratinocyte serum-free medium (CellnTec) without a mitotically arrested fibroblast feeder layer for 2 weeks. Colonies were stained and counted as above (supplementary material Fig. S1).
Hair-reconstitution assay
Freshly isolated epidermal keratinocytes were sorted by FACS and mixed with 4×10⁶ neonatal dermal fibroblasts, and injected into silicon chambers (Renner GMBH) surgically implanted on the dorsal fascia of recipient nude mice (NSWNU-M, Taconic Farms) (2.5×10⁵ or 1.25×10⁶ keratinocytes per graft) as previously described (Weinberg et al., 1993; Kamimura et al., 1997). A single FACS sorting experiment typically yielded a maximum of 1.5–2.0×10⁶ purified UI cells, which was subsequently divided into one 2.5×10⁵ cell graft and one 1.25×10⁶ cell graft per experiment. This entire experimental procedure was repeated five times. Chambers were removed 1 week after cell injection and reconstituted skin and hair follicle appendages were typically observed within 3–4 weeks post grafting. Skin grafts were typically harvested 6 weeks after implantation for histological analysis and immunofluorescence. The Institute of Comparative Medicine at Columbia University Medical Center approved all animal studies.
Microarray analysis
Keratinocytes were freshly isolated from 7-week-old female C57BL/6 dorsal mouse skin as previously described and sorted by FACS into the following three populations: α6LCD34−Sca-1− (UI cells), α6L+HCD34+Sca-1− (all bulge cells) and α6all (all basal cells) at 2–4×10⁶ cells per population. Total RNA was isolated using RNeasy Mini Kit (Qiagen) and double-stranded cDNA was synthesized using a cDNA Synthesis System (Roche) and transcribed into biotin-labeled cRNA using Bioarray HighYield RNA Transcript Labeling Kit (Enzo Life Sciences). Biotin-labeled cRNA (15 μg/sample) was hybridized at 45°C for 16 hours on Mouse Genome 430 2.0 Array Chips (Affymetrix) containing 45,000 probe sets representing over 34,000 genes, which were subsequently scanned by Affymetrix GeneChip Scanner 3000. Raw microarray values were quantified using GeneChip Operating Software (Affymetrix) and imported into ArrayAssist Expression software 4.1 (Stratagene) using a new Affymetrix Expression Project feature and probe set values were normalized and summarized by a GC-RMA algorithm. Data were processed to identify genes differentially regulated in UI keratinocytes at least twofold or higher using a paired Student’s t-test with a Benjamini-Hochberg multiple test correction (P<0.05) to eliminate false-positive probe sets. Each group was done in triplicate (supplementary material Fig. S6).
RT-PCR analysis
Double-stranded cDNA was synthesized as described above from the following FACS-sorted keratinocyte populations: α6LCD34−Sca-1− (UI cells), α6L+HCD34+Sca-1− (all bulge cells) and α6L+HCD34−Sca-1+ (IFE + IFD cells). For semi-quantitative RT-PCR analysis, cDNA samples were either undiluted, or diluted 1:5 or 1:25 and subjected to PCR analysis using 2× PCR Master Mix as per the manufacturer’s instructions (Promega). Oligonucleotide primer pairs were designed to target separate exons in each of a selection of enriched genes in UI cells detected by microarray analysis (Table 2) and GAPDH was used as an internal control for each sample. PCR products were separated by agarose gel electrophoresis and quantified by densitometry using NIH ImageJ software.
Supplementary Material
Acknowledgments
This work was supported by The American Skin Association, The Dermatology Foundation, The Skin Cancer Foundation and the National Institutes of Health R01 CA114014 (X.Y., S.-H.W. and D.M.O.) and The Danish Research Council, Aage Bang Fund, The Novo Nordisk Fund and Karen Elise Jensen Fund (U.B.J., R.C. and C.T.). We especially thank Soosan Ghazizadeh for her technical expertise with the hair reconstitution assay and Kristie Gordon, Stella Stefanova and Anette Thomsen for their assistance with flow cytometry and immunolabeling studies.
Footnotes
Supplementary material available online at http://jcs.biologists.org/cgi/content/full/121/5/609/DC1
References
- Albert MR, Foster RA, Vogel JC. Murine epidermal label-retaining cells isolated by flow cytometry do not express the stem cell markers CD34, Sca-1, or Flk-1. J Invest Dermatol. 2001;117:943–948. doi: 10.1046/j.0022-202x.2001.01517.x. [DOI] [PubMed] [Google Scholar]
- Barker N, van Es JH, Kuipers J, Kujala P, van den Born M, Cozijnsen M, Haegebarth A, Korving J, Begthel H, Peter PJ, et al. Identification of stem cells in small intestine and colon by marker gene Lgr5. Nature. 2007;449:1003–1008. doi: 10.1038/nature06196. [DOI] [PubMed] [Google Scholar]
- Blanpain C, Lowry WE, Geoghegan A, Polak L, Fuchs E. Self-renewal, multipotency, and the existence of two cell populations within an epithelial stem cell niche. Cell. 2004;118:635–648. doi: 10.1016/j.cell.2004.08.012. [DOI] [PubMed] [Google Scholar]
- Bradfute SB, Graubert TA, Goodell MA. Roles of Sca-1 in hematopoietic stem/progenitor cell function. Exp Hematol. 2005;33:836–843. doi: 10.1016/j.exphem.2005.04.001. [DOI] [PubMed] [Google Scholar]
- Braun KM, Niemann C, Jensen UB, Sundberg JP, Silva-Vargas V, Watt FM. Manipulation of stem cell proliferation and lineage commitment: visualisation of label-retaining cells in wholemounts of mouse epidermis. Development. 2003;30:5241–5255. doi: 10.1242/dev.00703. [DOI] [PubMed] [Google Scholar]
- Clayton E, Doupe DP, Klein AM, Winton DJ, Simons BD, Jones PH. A single type of progenitor cell maintains normal epidermis. Nature. 2007;446:185–189. doi: 10.1038/nature05574. [DOI] [PubMed] [Google Scholar]
- Cotsarelis G. Epithelial stem cells: a folliculocentric view. J Invest Dermatol. 2006;126:1459–1468. doi: 10.1038/sj.jid.5700376. [DOI] [PubMed] [Google Scholar]
- Cotsarelis G, Sun TT, Lavker RM. Label-retaining cells reside in the bulge area of pilosebaceous unit: implications for follicular stem cells, hair cycle, and skin carcinogenesis. Cell. 1990;61:1329–1337. doi: 10.1016/0092-8674(90)90696-c. [DOI] [PubMed] [Google Scholar]
- Fuchs E, Tumbar T, Guasch G. Socializing with the neighbors: stem cells and their niche. Cell. 2004;116:769–778. doi: 10.1016/s0092-8674(04)00255-7. [DOI] [PubMed] [Google Scholar]
- Ghazizadeh S, Taichman LB. Multiple classes of stem cells in cutaneous epithelium: a lineage analysis of adult mouse skin. EMBO J. 2001;20:1215–1222. doi: 10.1093/emboj/20.6.1215. [DOI] [PMC free article] [PubMed] [Google Scholar]
- Horsley V, O’Carroll D, Tooze R, Ohinata Y, Saitou M, Obukhanych T, Nussenzweig M, Tarakhovsky A, Fuchs E. Blimp1 defines a progenitor population that governs cellular input to the sebaceous gland. Cell. 2006;126:597–609. doi: 10.1016/j.cell.2006.06.048. [DOI] [PMC free article] [PubMed] [Google Scholar]
- Ito CY, Li CY, Bernstein A, Dick JE, Stanford WL. Hematopoietic stem cell and progenitor defects in Sca-1/Ly-6A-null mice. Blood. 2003;101:517–523. doi: 10.1182/blood-2002-06-1918. [DOI] [PubMed] [Google Scholar]
- Ito M, Liu Y, Yang Z, Nguyen J, Liang F, Morris RJ, Cotsarelis G. Stem cells in the hair follicle bulge contribute to wound repair but not to homeostasis of the epidermis. Nat Med. 2005;11:1351–1354. doi: 10.1038/nm1328. [DOI] [PubMed] [Google Scholar]
- Kamimura J, Lee D, Baden HP, Brissette J, Dotto GP. Primary mouse keratinocyte cultures contain hair follicle progenitor cells with multiple differentiation potential. J Invest Dermatol. 1997;109:534–540. doi: 10.1111/1523-1747.ep12336704. [DOI] [PubMed] [Google Scholar]
- Levy V, Lindon C, Harfe BD, Morgan BA. Distinct stem cell populations regenerate the follicle and interfollicular epidermis. Dev Cell. 2005;9:855–861. doi: 10.1016/j.devcel.2005.11.003. [DOI] [PubMed] [Google Scholar]
- Marshman E, Booth C, Potten CS. The intestinal epithelial stem cell. BioEssays. 2002;24:91–98. doi: 10.1002/bies.10028. [DOI] [PubMed] [Google Scholar]
- Morris RJ. Procedure for harvesting epidermal cells from the dorsal epidermis of adult mice for primary cell culture in “high calcium” defined medium. In: Leigh IM, Watt FM, editors. Keratinocyte Methods. Cambridge: Cambridge University Press; 1994. pp. 25–31. [Google Scholar]
- Morris RJ, Liu Y, Marles L, Yang Z, Trempus C, Li S, Lin JS, Sawicki JA, Cotsarelis G. Capturing and profiling adult hair follicle stem cells. Nat Biotechnol. 2004;22:411–417. doi: 10.1038/nbt950. [DOI] [PubMed] [Google Scholar]
- Nijhof JG, Braun KM, Giangreco A, van Pelt C, Kawamoto H, Boyd RL, Willemze R, Mullenders LH, Watt FM, de Gruijl FR, et al. The cell-surface marker MTS24 identifies a novel population of follicular keratinocytes with characteristics of progenitor cells. Development. 2006;133:3027–3037. doi: 10.1242/dev.02443. [DOI] [PubMed] [Google Scholar]
- Oh H, Bradfute SB, Gallardo TD, Nakamura T, Gaussin V, Mishina Y, Pocius J, Michael LH, Behringer RR, Garry DJ, et al. Cardiac progenitor cells from adult myocardium: homing, differentiation, and fusion after infarction. Proc Natl Acad Sci USA. 2003;100:12313–12318. doi: 10.1073/pnas.2132126100. [DOI] [PMC free article] [PubMed] [Google Scholar]
- Owens DM, Watt FM. Contribution of stem cells and differentiated cells to epidermal tumours. Nat Rev Cancer. 2003;3:444–451. doi: 10.1038/nrc1096. [DOI] [PubMed] [Google Scholar]
- Pan F, Sun L, Kardian DB, Whartenby KA, Pardoll DM, Liu FO. Feedback inhibition of calcineurin and ras by a dual inhibitory protein carabin. Nature. 2007;445:433–436. doi: 10.1038/nature05476. [DOI] [PubMed] [Google Scholar]
- Ponta H, Sherman L, Herrlich PA. CD44: from adhesion molecules to signalling regulators. Nat Rev Mol Cell Biol. 2003;4:33–45. doi: 10.1038/nrm1004. [DOI] [PubMed] [Google Scholar]
- Rheinwald JG, Green H. Serial cultivation of strains of human epidermal keratinocytes: the formation of keratinizing colonies from single cells. Cell. 1975;6:317–330. doi: 10.1016/s0092-8674(75)80001-8. [DOI] [PubMed] [Google Scholar]
- Schneider TE, Barland C, Alex AM, Mancianti ML, Lu Y, Cleaver JE, Lawrence HJ, Ghadially R. Measuring stem cell frequency in epidermis: a quantitative in vivo functional assay for long-term repopulating cells. Proc Natl Acad Sci USA. 2003;100:11412–11417. doi: 10.1073/pnas.2034935100. [DOI] [PMC free article] [PubMed] [Google Scholar]
- Spangrude GJ, Heimfeld S, Weissman IL. Purification and characterization of mouse hematopoietic stem cells. Science. 1988;241:58–62. doi: 10.1126/science.2898810. [DOI] [PubMed] [Google Scholar]
- Tani H, Morris RJ, Kaur P. Enrichment for murine keratinocyte stem cells based on cell surface phenotype. Proc Natl Acad Sci USA. 2000;97:10960–10965. doi: 10.1073/pnas.97.20.10960. [DOI] [PMC free article] [PubMed] [Google Scholar]
- Trempus CS, Morris RJ, Bortner CD, Cotsarelis G, Faircloth RS, Reece JM, Tennant RW. Enrichment for living murine keratinocytes from the hair follicle bulge with the cell surface marker CD34. J Invest Dermatol. 2003;120:501–511. doi: 10.1046/j.1523-1747.2003.12088.x. [DOI] [PubMed] [Google Scholar]
- Triel C, Vestergaard ME, Bolund L, Jensen TG, Jensen UB. Side population cells in human and mouse epidermis lack stem cell characteristics. Exp Cell Res. 2004;295:79–90. doi: 10.1016/j.yexcr.2003.11.032. [DOI] [PubMed] [Google Scholar]
- Vindelov LL, Christensen IJ, Nissen NI. Standardization of high-resolution flow cytometric DNA analysis by the simultaneous use of chicken and trout red blood cells as internal reference standards. Cytometry. 1983;3:323–331. doi: 10.1002/cyto.990030504. [DOI] [PubMed] [Google Scholar]
- Watt FM. Role of integrins in regulating epidermal adhesion, growth and differentiation. EMBO J. 2002;21:3919–3926. doi: 10.1093/emboj/cdf399. [DOI] [PMC free article] [PubMed] [Google Scholar]
- Weinberg WC, Goodman LV, George C, Morgan DL, Ledbetter S, Yuspa SH, Lichti U. Reconstitution of hair follicle development in vivo: determination of follicle formation, hair growth, and hair quality by dermal cells. J Invest Dermatol. 1993;100:229–236. doi: 10.1111/1523-1747.ep12468971. [DOI] [PubMed] [Google Scholar]
- Welm BE, Tepera SB, Venezia T, Graubert TA, Rosen JM, Goodell MA. Sca-1(+) cells in the mouse mammary gland represent an enriched progenitor cell population. Dev Biol. 2002;245:42–56. doi: 10.1006/dbio.2002.0625. [DOI] [PubMed] [Google Scholar]
Associated Data
This section collects any data citations, data availability statements, or supplementary materials included in this article.