Abstract
Sample ablation by pulsed lasers is one option for removing material from a sample surface for in situ depth profiling during imaging mass spectrometry, but ablation is often limited by laser-induced damage of the remaining material. A preliminary evaluation was performed of sub-100-fs, 800 nm pulsed laser ablation for depth profiling of bacterial biofilms grown on glass by the drip flow method. Electron and optical microscopy were combined with laser desorption vacuum ultraviolet postionization mass spectrometry to analyze biofilms before and after ablation. Ultrashort laser pulses can ablate thick sections of bacterial biofilms, leaving behind a layer of lysed cells. However, mass spectra from intact and ablated biofilms doped with antibiotic are almost identical, indicating little chemical degradation by ablation. These results are consistent with prior observations from laser surgery and support the use of ultrashort pulse laser ablation for minimally disruptive depth profiling of bacterial biofilms and intact biological samples.
Keywords: bacteria, biofilm, sulfadiazine
I. INTRODUCTION
Matrix-assisted laser desorption ionization mass spectrometry (MALDI-MS) is a well established technique for MS imaging of biological materials such as plant and animal tissue.1,2 Among the advantages of MALDI-MS imaging is its ability to detect high molecular weight species (i.e., peptides and proteins) within intact tissue with tens of microns spatial resolution. However, most species desorbed in MALDI-MS are neutrals3–5 rather than directly detectable ions. Thus, detection of laser desorbed neutrals should improve sensitivity and reduce differential ionization effects in MALDI-MS. Laser desorption vacuum ultraviolet postionization mass spectrometry (LDPI-MS) has been developed by some of the authors for imaging of specific analytes in bacterial biofilms and other intact biological samples.6–8 LDPI-MS is essentially MALDI-MS with the addition of a vacuum ultraviolet (VUV) laser for single photon ionization of the abundant laser desorbed neutrals, but often without any added matrix.3 A recent paper reviewed the application of VUV single photon ionization to a wide variety of MS analyses,9 including various thin film and organic layers.3 A recent review of LDPI-MS has described a new instrument and demonstrated its use for the spatial imaging of antibiotics in biofilms.8
Both MALDI-MS and LDPI-MS achieve spatial imaging of intact biological samples by rastering a focused desorption laser with respect to the sample plane. Depth profiling of biological samples requires the ability to remove the top layer of material while leaving the underlying sample chemically and physically unaltered. Depth profiling in MALDI-MS imaging is typically done by mechanical sectioning of films (i.e., cryo- or other microtoming strategies).1,2 Mechanical sectioning, however, is time consuming, complicates correlation of images collected from different depth slices, and limits depth resolution. An in situ method of depth profiling that could be combined in vacuum with laser rastering across the sample surface would therefore be vastly preferable to mechanical sectioning.
Sample ablation by pulsed lasers is an obvious option for removing material from a sample surface for in situ depth profiling during either MALDI-MS or LDPI-MS. However, laser-induced damage of the material that remains after ablation has generally been thought to limit this option. For example, ablation of Eschericia coli bacterial biofilms by , 337 nm pulses leads to changes in microbe morphology, as measured by scanning force microscopy.10,11 Similarly, ablation of natural marine biofilms by 5 ns, 532 nm pulses leaves mostly dead and structurally disrupted cells as imaged by scanning electron microscopy.12 These results are consistent with a large body of literature on laser surgery, which has found that laser pulse lengths exceeding the stress relaxation time induce significant mechanical damage in animal tissue.13,14 Such mechanical damage, as well as accumulated thermal damage from multiple laser shots, limits the use of nanosecond laser ablation for depth profiling of biological samples.
The problems associated with laser ablation by nanosecond pulses could conceivably be ameliorated by using ultrafast lasers. This article provides a preliminary evaluation of sub-100-fs pulse laser ablation for depth profiling of biofilms. Electron and optical microscopy were combined with LDPI-MS to analyze biofilms before and after ultrashort pulse laser ablation.
II. EXPERIMENT
A. Biofilm growth and treatment
Colony biofilms were prepared from stock solutions of Staphylococcus epidermidis (ATCC 35984) and grown on indium tin oxide (ITO) coated glass slides for either or in a drip flow reactor under low nutrient shear via the modification of a published method.15 Biofilms were dried in air for a few hours and left overnight in a dessicator prior to laser ablation. aliquots of 50 mM aqueous solutions of sulfadiazine sodium salt were spiked over the dried biofilm surface and allowed to dry prior to introduction into the LDPI-MS load lock.7
B. Ultrashort pulse laser ablation apparatus
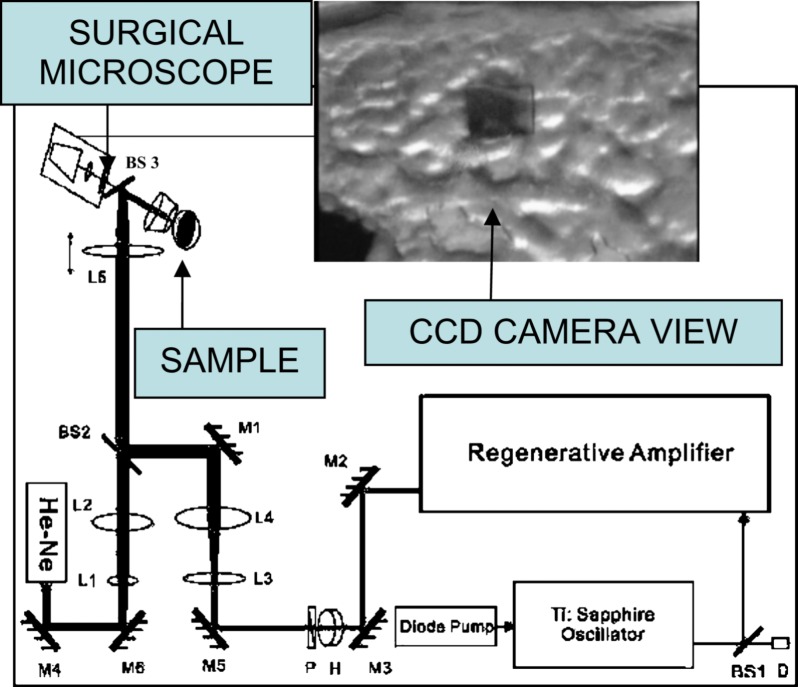
Figure 1 displays a schematic of the apparatus employed for ultrashort pulse laser ablation, which was described previously.16 45 fs, 800 nm pulses produced by a regeneratively amplified Ti:sapphire laser (Spectra-Physics Tsunami oscillator and Spitfire amplifier) were focused by a simple convex lens onto a biofilm sample mounted in air on a motorized three-dimensional (3D) translation stage. A charge coupled device (CCD) camera mounted on a surgical microscope was used for sample viewing and guiding the femtosecond ablation laser, with the assistance of a He–Ne laser aligned coaxially with the ablation beam. Autocorrelation measurements showed that the pulse width was lengthened by the optics to . A scanning knife edge experiment showed that the radius at the laser beam waist was and its Rayleigh range was . The laser was focused above the surface with a spot radius, , of and pulse energies, , varied from 100 to , corresponding to fluences of and intensities of , where fluence is defined as .
FIG. 1.
(Color online) Optical delivery system. M is mirror, BS is beam splitter, L is lens, D is detector, H is half wave plate, P is polarizer, and He–Ne is helium-neon laser; paths of the guiding and the Ti-sapphire beams are shown by the sketch. The inset displays the image of a laser-ablated area on the surface of the biofilm taken by the CCD camera.
C. Scanning electron and two-photon laser scanning microscopy
Images of laser-ablated biofilm samples were obtained by scanning electron microscopy (SEM) (Hitachi S-3000N) with a tungsten electron source operating at 10–25 keV in variable pressure mode. Some SEM images were obtained in high vacuum mode after fixing by 2.5% gluteraldehyde and dehydration by gradient ethanol dilutions. Samples were then coated with an 8 nm thick 4:1 ratio Pt/Pd overlayer using a commercial vacuum spin coater (Cressington 208HR). SEM conditions were known to preserve biological structures. Comparison of variable pressure versus high vacuum images showed no morphological changes at the image resolution scale from coating.
Two photon-laser scanning microscopic (2P-LSM) images were obtained by a home-built two-photon confocal microscope, after staining the biofilm samples with a 300 nM solution of ,6-diamidino-2-phenylindole in phosphate buffered saline. The two-photon microscope used 35 fs, 800 nm pulses from the Ti:sapphire laser. The fluorescence signal was collected through a short pass filter (with 650 nm cutoff) and detected with a photomultiplier tube (Hamamatsu H7422P).
D. LDPI-MS apparatus
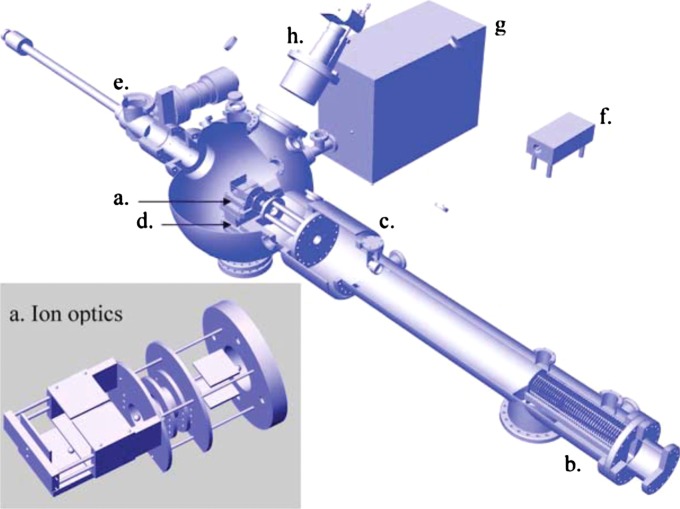
Mass spectral data were collected on the home-built LDPI instrument shown in Fig. 2.8 A 349 nm Nd:YLF (yttrium lithium fluoride) pulsed laser (Spectra-Physics Explorer) with a typical pulse energy of and a laser spot diameter of was used for desorption. A 157 nm fluorine excimer laser (7.87 eV, Lambda Physik OptexPro) with a pulse energy of and beam width of in the ionization region was used for postionization. Both lasers were operated at 100 Hz repetition rates. Spectra were collected by averaging over 100 laser shots. The home-built reflectron time-of-flight mass analyzer displayed resolution exceeding 1200 at m/z 397 and was equipped with customized pseudo-orthogonal delayed pulsed extraction and acceleration ion optics, an Einzel lens, steering plates, a two-stage ion mirror, and a microchannel plate detector. MS data acquisition was achieved with a digitizing 12 bit, 125 MS/s plug-in data acquisition card with 128 MS memory (DynamicSignals LLC CompuScope 8229). The samples were mounted on a vacuum compatible translation stage (Micos USA LS-120), which achieved a base pressure of during analysis and was rastered with respect to the desorption laser beam. A digital single lens reflex camera (Nikon D300 with Nikkor telephoto AF Micro 200 mm lens) was used for visual imaging of the sample within the LDPI-MS vacuum chamber. Other aspects of the LDPI-MS instrument and its performance will be detailed in a future publication.
FIG. 2.
(Color online) LDPI-MS instrument schematic with inset showing an expanded view of (a) ionization/extraction region ion optics. (b) is reflectron time-of-flight mass analyzer, (c) is reflectron detector, (d) is vacuum compatible translation stage, (e) is load lock, (f) is 349 nm Nd:YLF desorption laser, (g) is 157 nm fluorine laser for VUV postionization, and (h) is camera for optical imaging of sample.
III. RESULTS
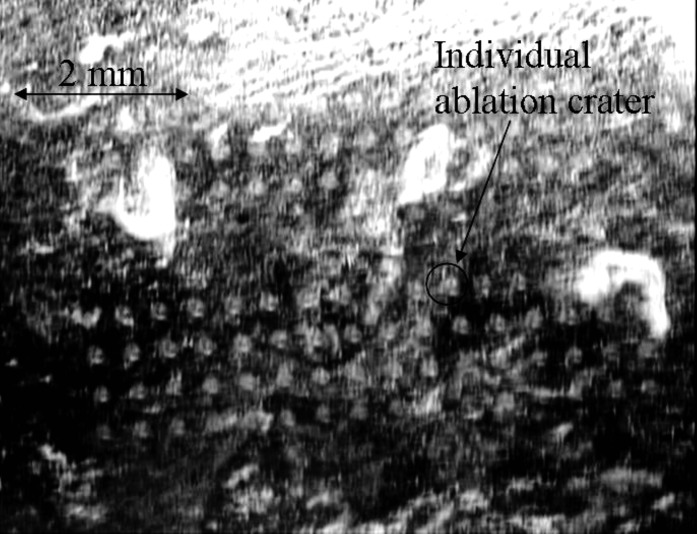
Figure 3 shows ablation craters created by single laser shots on a thick biofilm, with fluences ranging from (craters toward top left) to (craters toward bottom right). The biofilms were grown for 24 h on an ITO-coated glass slide. The ablation threshold for these relatively thin biofilms was found to be . The threshold, determined by observing changes on the surface of the biofilms with the CCD camera, was found to vary both from sample to sample and within a single inhomogeneous sample. By comparison, thick biofilms grown for showed a threshold of . 2P-LSM images taken from a nonablated region of a biofilm grown for verified that its thickness was (data not shown). During ablation, the laser beam was focused above the sample as this strategy minimizes collateral damage.17
FIG. 3.
Ablation craters on the surface of a thin Staphylococcus epidermidis biofilm ( thick) grown on ITO-coated glass slide imaged by CCD camera. Laser spot diameter was set to be . Fluences in the range between (craters toward top left) and (craters toward bottom right) were applied.
The fluence threshold for ultrashort pulse irradiation of the thick biofilm is similar to the value reported for Eschericia coli biofilms grown on polymer films using , 337 nm pulses.10 However, the four orders of magnitude higher intensities applied by femtosecond laser ablation allows for a very different ablation mechanism, as discussed below. Emission of blue light from the laser spot, which was observed during laser irradiation, is indicative of a breakdown process (data not shown).
Variable pressure SEM images of the thick biofilm after a single laser shot displayed an elliptical ablation crater long and wide (data not shown). It appears that only the peak region of the Gaussian-shaped laser pulses removed material from the surface of the thicker biofilms under these focusing conditions.
Ablation of a area was performed by applying the diameter laser beam with an energy fluence of , which is slightly above the ablation energy threshold. The laser beam was rastered across the surface with spacing between shots. High vacuum SEM of Pt/Pd-coated biofilms displayed in Fig. 4 (left) shows a large, square ablated region. The pronounced cracks resulted from initial drying of the biofilm sample during preparation. No obvious effect of these cracks on the ablation event was observed. 2P-LSM images were recorded after channels were carved in the biofilms by moving the sample stage at a velocity while firing the ablation laser in a fast repetition mode (100 Hz, ). The resultant 2P-LSM images showed that the cross section of the laser-ablated channels appeared more squared than curved (data not shown).
FIG. 4.
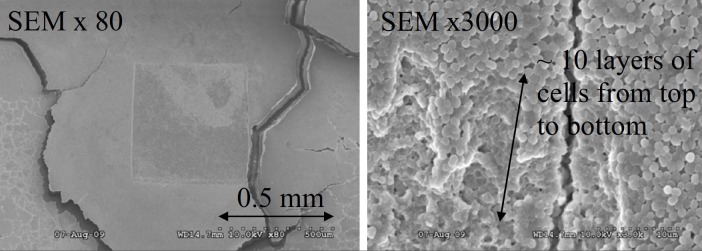
(Left) SEM image of an area of ablated on the surface of thick biofilm ( thick). Laser was focused to a spot diameter of and ablation was done by rastering laser beam across the surface with spacing between shots. Magnification was 80×. (Right) Top right corner of the ablated region shown on the left image. Magnification was 3000×. The depth penetration was estimated by counting layers of cells from the top to the bottom, as the diameter of an individual S. epidermidis cell is .
Figure 4 (right) shows a magnified view of the SEM image of the top right corner of the ablated region (left image). This image was used to estimate ablation depth penetration by counting layers of cells from the top to the bottom of the ablation crater (shown by the arrow). The diameter of an individual, intact S. epidermidis cell is ,7 allowing the crater depth to be estimated as . The use of low beam voltage and Pt/Pd coating on the biofilm samples prevented electron beam damage during SEM analysis.
SEM images were also used to show that the integrity of individual bacterial cells at the bottom of the ablated region was disrupted, as compared to native cells in the biofilm prior to ablation. Figure 5 (left) is a SEM image of a native biofilm surface showing intact, spherical cells typical of S. epidermidis. Figure 5 (right) shows the bottom of the ablated biofilm region, with many lysed cells among a few intact cells.
FIG. 5.
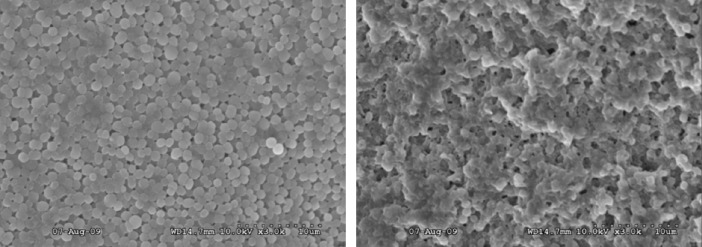
(Left) SEM image of intact surface of biofilm. Magnification was 3000×. (Right) Bottom of laser-ablated region at the same magnification. Comparison between left and right image is indicating that integrity of individual cells on the bottom of ablated region is disrupted since cells are lysed by laser ablation.
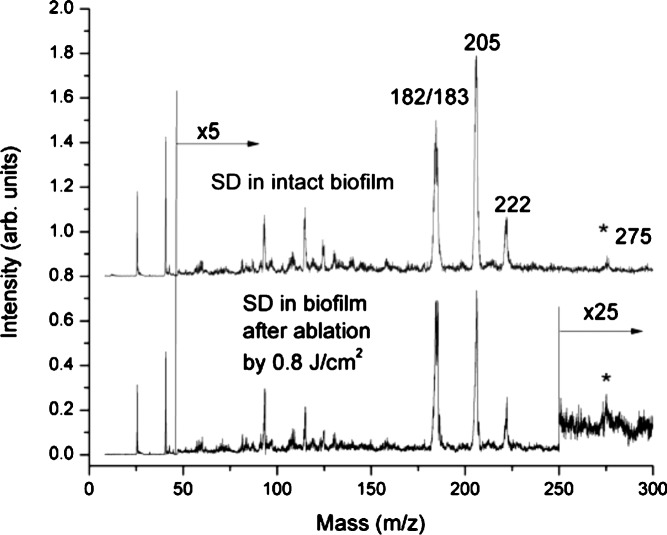
Next, the extent of chemical damage in the thick biofilm after laser ablation was evaluated by LDPI-MS with 7.87 eV VUV single photon ionization, which detects only an antibiotic doped into the biofilm as well as any other low ionization energy species naturally present therein.7 Figure 6 shows the LDPI-MS spectrum of sulfadiazine from an unablated microbial biofilm grown on an ITO-coated glass slide (upper panel) and from the bottom of the laser-ablated region of an irradiated biofilm (lower panel). The mass spectra from the intact and ablated biofilms are very similar, indicating little degradation of the antibiotic by ultrashort pulse laser ablation. In particular, the double peak at m/z 182/183 was identified as the fragment of sulfadiazine previously observed to dominate 7.87 eV LDPI-MS of this antibiotic in S. epidermidis biofilms.7 The peaks at m/z 205 and 221 were likely Na and K adducts with the aforementioned fragment sulfadiazine, respectively, but this assignment requires further work for verification. The peak at m/z 275 was likely intact sulfadiazine sodium salt. Minor differences in the spectra apparently arose from sample-to-sample fluctuations rather than laser ablation.
FIG. 6.
LDPI-MS of sulfadiazine detected within intact biofilm and from the bottom of the laser-ablated region. Intensity in spectral region above m/z 50 was multiplied by 5 and for the ablated film, multiplied by 25 above m/z 250.
IV. DISCUSSION
The results above demonstrate that sub-100-fs, 800 nm laser pulses can ablate thick sections of bacterial biofilms, leaving behind a layer of lysed cells. Furthermore, an antibiotic introduced into the biofilms survived the laser ablation process when sampled by subsequent laser desorption VUV postionization mass spectrometry. These results are consistent with observations from laser surgery13,16 and support the use of ultrashort pulse laser ablation for depth profiling of bacterial biofilms and intact biological samples. Further postablation chemical analysis is required, however, to more fully evaluate the extent of chemical damage to the remaining biofilms.
Previous studies of laser ablation of biofilms used nanosecond lasers with either visible12 or ultraviolet10,11 wavelengths. These studies were concerned with biofilm removal and did not explore the possibility of depth profiling. However, laser ablation of plant tissue for MS imaging of metabolites at different depths utilized 4 ns, pulses and achieved a depth resolution of and a lateral resolution of .18 Selective laser ablation of outer layers of organic material by nanosecond UV excimer laser pulses is also common in art conservation.19,20
A variety of ablation mechanisms is possible, depending on the wavelength, pulse duration, and intensity of the laser. The ablation mechanism is also affected by how the chemical and physical characteristics of the target interact with the specific properties of the laser pulse. If the pulse duration is shorter than the thermal and mechanical stress relaxation times (micro- and nanosecond time scales, respectively) of the target material, then the absorbed energy is largely confined to the focal volume of the laser, allowing very highly controlled removal of material. If the intensity is below the breakdown threshold ( for water with 100 fs pulses13), ablation results from superheating of the matrix that leads to a phase explosion. This is the case, for example, in the profiling of plant tissue mentioned previously.18,21 At higher intensities, an avalanche mechanism produces a plasma, which transfers energy to the medium. Light absorption is limited to the regions of subcritical plasma density, which shield deeper layers from direct photon excitation. The depth of the resulting crater is determined by the propagation rate of the resulting melt front. The intensities required for plasma-induced ablation are readily achieved with ultrashort laser pulses of even modest energy, as is the case here. The emission of blue light from the laser spot observed here during ultrashort pulse laser irradiation is consistent with such a mechanism. Other examples of plasma-induced ablation include the formation of 3D patterns in collagen17 and ablation of the trabecular meshwork of the eye.22
V. CONCLUSIONS
The efficiency of ablation and the lack of chemical degradation of an antibiotic doped into the biofilm confirm that femtosecond laser pulses may be suitable for chemical depth profiling, although lysed cells were observed at the bottom of the ablation crater. A similar conclusion was reached in the depth profiling of plant tissue with nanosecond pulses.18,21 Recently, 55 ps pulses at were used to ablate bone tissue at intensities well below the plasma breakdown.23 Direct excitation of the vibrational stretch of water molecules allows for efficient conversion of laser energy into mechanical forces, which can produce very smooth ablation surfaces. A comparison of the biological responses to plasma-induced and photomechanical ablation would be valuable.
A matter that requires further examination is the extent and consequences of collateral damage to surrounding tissue, as the mass spectra presented here constitute only a preliminary evaluation of chemical damage. However, prior work supports low collateral damage by sub-100-fs, 800 nm ablation. Laser trabecular ablation showed that the nuclei of cells surrounding the ablation crater were intact.22 A comparison of laser and conventional bone surgery showed only a slightly diminished wound healing response of bone tissue ablated with a Ti:sapphire laser.24
Future work will evaluate several possible advantages of ablation by sub-100-fs laser pulses over phase explosion induced by vibrational resonance. First, plasma-mediated ablation may apply to a wider range of materials and may lead to a more uniform ablation across a given sample, as desorption efficiency via nanosecond infrared pulses varies with local water content in the sample.18,21 Second, ultrashort laser pulses may allow improved spatial resolution in depth profiling, at least compared to midinfrared lasers. Third, postionization experiments have yet to investigate the possibility that higher fluxes of intact neutrals may be ejected by ultrashort laser pulses. If ultrashort pulse laser ablation desorbs significant numbers of intact molecular neutrals, it could be used instead of the nanosecond pulsed desorption laser for 3D chemical imaging of biological samples when combined with VUV postionization. Prior work also indicates a potential to forgo postionization, as ultrashort laser pulses can directly produce at least some intact molecular ions from biologically relevant samples.25,26
ACKNOWLEDGMENTS
The authors acknowledge their ongoing collaboration with Ross Carlson of the Center for Biofilm Engineering at Montana State University (Bozeman, MT), who freely provided his invaluable expertise on bacterial biofilms. They also thank Jerry F. Moore of MassThink (Naperville, IL) for his central role in the construction and operation of the LDPI-MS instrument. This work was supported by the National Institute of Biomedical Imaging and Bioengineering via Grant No. EB006532.
REFERENCES
- 1.McDonnell L. A. and Heeren R. M. A., Mass Spectrom. Rev. 26, 606 (2007). 10.1002/mas.20124 [DOI] [PubMed] [Google Scholar]
- 2.Reyzer M. L. and Caprioli R. M., Curr. Opin. Chem. Biol. 11, 29 (2007). 10.1016/j.cbpa.2006.11.035 [DOI] [PubMed] [Google Scholar]
- 3.Hanley L., Kornienko O., Ada E. T., Fuoco E., and Trevor J. L., J. Mass Spectrom. 34, 705 (1999). [DOI] [PubMed] [Google Scholar]
- 4.Dreisewerd K., Chem. Rev. 103, 395 (2003). 10.1021/cr010375i [DOI] [PubMed] [Google Scholar]
- 5.Tsai S. -T., Chen C. -H., Lee Y. T., and Wang Y. -S., Mol. Phys. 106, 239 (2008). 10.1080/00268970701779671 [DOI] [Google Scholar]
- 6.Edirisinghe P. D., Moore J. F., Skinner-Nemec K. A., Lindberg C., Giometti C. S., Veryovkin I. V., Hunt J. E., Pellin M. J., and Hanley L., Anal. Chem. 79, 508 (2007). 10.1021/ac0615605 [DOI] [PubMed] [Google Scholar]
- 7.Gasper G. L., Carlson R., Akhmetov A., Moore J. F., and Hanley L., Proteomics 8, 3816 (2008). 10.1002/pmic.200701142 [DOI] [PMC free article] [PubMed] [Google Scholar]
- 8.Akhmetov A., Moore J. F., Gasper G. L., Koin P. J., and Hanley L., J. Mass Spectrom. 45, 137 (2010). 10.1002/jms.1716 [DOI] [PMC free article] [PubMed] [Google Scholar]
- 9.Hanley L. and Zimmermann R., Anal. Chem. 81, 4174 (2009). 10.1021/ac8013675 [DOI] [PMC free article] [PubMed] [Google Scholar]
- 10.Richter A., Gonpot P., and Smith R., Nucl. Instrum. Methods Phys. Res. B 180, 1 (2001). 10.1016/S0168-583X(01)00389-5 [DOI] [Google Scholar]
- 11.Richter A., Mahmoud S. A., and Ries R., Vacuum 66, 179 (2002). [Google Scholar]
- 12.Nandakumar K., Obika H., Utsumi A., Ooie T., and Yano T., Biotechnol. Bioeng. 86, 729 (2004). 10.1002/bit.10829 [DOI] [PubMed] [Google Scholar]
- 13.Vogel A. and Venugopalan V., Chem. Rev. 103, 577 (2003). 10.1021/cr010379n [DOI] [PubMed] [Google Scholar]
- 14.Niemz M., Laser-Tissue Interactions (Springer, Berlin, 1996). [Google Scholar]
- 15.Goeres D. M., Hamilton M. A., Beck N. A., Buckingham-Meyer K., Hilyard J. D., Loetterle L. R., Lorenz L. A., Walker D. K. and Stewart P. S., Nat. Protoc. 4, 783 (2009). 10.1038/nprot.2009.59 [DOI] [PubMed] [Google Scholar]
- 16.Nakamura H., Liu Y., Witt T. E., Edward D. P., and Gordon R. J., Invest. Ophthalmol. Visual Sci. 50, 1198 (2009). 10.1167/iovs.07-1536 [DOI] [PubMed] [Google Scholar]
- 17.Liu Y., Sun S., Singha S., Cho M. R., and Gordon R. J., Biomaterials 26, 4597 (2005). 10.1016/j.biomaterials.2004.11.033 [DOI] [PubMed] [Google Scholar]
- 18.Nemes P., Barton A. A., Li Y., and Vertes A., Anal. Chem. 80, 4575 (2008). 10.1021/ac8004082 [DOI] [PubMed] [Google Scholar]
- 19.Dickmann K. and Fotakis C., Lasers in the Conservation of Artworks (Springer, Berlin, 2005). 10.1007/b138716 [DOI] [Google Scholar]
- 20.Theodorakopoulos C., Zafiropulos V., Boon J. J., and Boyatzis S. C., Appl. Spectrosc. 61, 1045 (2007). 10.1366/000370207782217833 [DOI] [PubMed] [Google Scholar]
- 21.Chen Z. and Vertes A., Phys. Rev. E 77, 036316 (2008). 10.1103/PhysRevE.77.036316 [DOI] [PubMed] [Google Scholar]
- 22.Toyran S., Liu Y., Singha S., Shan S., Cho M. R., Gordon R. J., and Edwards D. P., Exper. Eye Res. 81, 298 (2005). [DOI] [PubMed] [Google Scholar]
- 23.Franjic K., Cowan M. L., Kraemer D., and Miller R. J. D., Opt. Express 17, 22937 (2009). 10.1364/OE.17.022937 [DOI] [PubMed] [Google Scholar]
- 24.Girard B., Cloutier M., Wilson D. J., Clokie C. M. L., Miller R. J. D., and Wilson B. C., Lasers Surg. Med. 39, 458 (2007). 10.1002/lsm.20493 [DOI] [PubMed] [Google Scholar]
- 25.Berry J. I., Sun S., Dou Y., Wucher A., and Winograd N., Anal. Chem. 75, 5146 (2003). 10.1021/ac034375p [DOI] [PubMed] [Google Scholar]
- 26.Coello Y., Gunaratne T. C., and Dantus M., Proc. SPIE 7182, 71821W (2009). 10.1117/12.808252 [DOI] [Google Scholar]


