Cyclosporine (CsA) is an important immunosuppressive cyclic oligopeptide that is extensively metabolized in humans. Recent reports have suggested that several metabolites of CsA may contribute to the immunosuppressive activity and/or nephro-toxicity observed in patients.1,2 We have also observed that metabolites 17, 1, and 21 (M17, M1, and M21)3 have immunosuppressive activity on alloreactive T cells.4 In light of these observations, the accurate quantitation of CsA metabolites in transplant patients may add valuable information concerning the activity of the administered drug. Preliminary reports of trough blood concentrations of M17 in kidney and heart transplant patients have shown higher concentrations of M17 than of CSA.5,6 Low concentrations of some metabolites and analytical problems7 have previously prevented a thorough investigation of blood concentrations of M17, M1, M18, and M21 in transplant patients. The objectives of our study were to develop an accurate method to quantitate CsA and its metabolites in blood, to measure the concentrations of CsA, M17, M1, M18, and M21 in the trough blood samples of renal, liver, cardiac, and bone marrow transplant patients, and to assess metabolic differences among patient populations receiving CsA.
PATIENTS AND METHODS
Patients
Blood samples were obtained from both hospitalized patients and outpatients who were receiving a stable CsA dose for at least seven days. The trough blood samples were obtained in the morning immediately prior to the next drug dose. Nineteen samples were obtained from 12 liver transplant patients, 18 samples came from 18 heart transplant patients, 22 samples came from 22 kidney transplant patients, and 14 samples from eight bone marrow transplant patients were collected for the study. Biochemical information collected on each patient included serum creatinine, bilirubin, and liver enzymes. Comparisons were made using Student’s t test assuming a level of significance of P < .05.
Instrumentation
The high-performance liquid chromatography (HPLC) system incorporated an automated gradient controller, two solvent delivery pumps, a model 712 sample processor, and a Model 441 absorbance detector set at 214 nm (Waters Associates, Milford, MA). The column was a Resolve C-18, 15 cm × 3.9 mm, 5-micron column (Waters) that was heated to 70°C. An LC-18 pellicular packing (Supelco, Bellefonte, PA) was used to pack the guard column. A Model 3390A reporting integrator (Hewlett-Packard, Avondale, PA) was used to measure the retention times and integrate peak areas.
Materials
CsA and trace quantities of purified M17, M1, M18, and M21 were generously supplied by G. Maurer (Sandoz Incorporated, Basel, Switzerland). Bile-derived M17, M1, M18, and M21 were isolated and purified from the bile of liver transplant patients who were receiving CsA therapy.3 All organic solvents used in the procedures were HPLC grade (J.T. Baker Chemical Company, Philipsburg, NJ). Water was deionized and purified through a Barnstead Nanopure II system (Barnstead, Boston, MA). The identification of peaks corresponding to M17, M1, M18, and M21 was performed by comparison of the peak retention times and the mass spectral data of those peaks in comparison with purified material. The M8 and M13 shown on chromatograms were tentatively identified by mass spectral analysis.
Sample Preparation and Quantification
Two milliliters of whole blood were mixed with 50 μL of cyclosporine D (CsD, 12.5 μg/mL) in methanol and 2 mL distilled water. The mixture was extracted with 14 mL of diethyl ether, and the ether layer was removed and evaporated under nitrogen to dryness. Following the reconstitution of the residue in 2 mL methanol and 1 mL water, the solution was defatted twice with 7 mL n-hexane per washing. The aqueous methanolic solution was re-extracted with 7 mL ether, and the ether was again removed and taken to dryness. The final dried extract was reconstituted in 100 μL of methanol and 40 μL were injected onto the column. The mobile phase consisted of a linear gradient of acetonitrile and water as shown in Table 1. Standards were spiked with M17, M1, M18, M21, and CsA using blank human blood, were extracted, and then analyzed. A least-squares linear regression analysis was used to calculate linear equations relating peak area ratios of individual metabolites or CsA to CsD and drug or metabolite concentrations. The correlation observed in each case was at least r = .999. The slopes of the standard curves of M17, M1, M18, M21, and CsA were 0.00315, 0.00240, 0.00260, 0.00239, and 0.00424, respectively. The concentrations of M17, M1, M18, M21, and CsA were measured by the ratio of peak areas (CsA or metabolite/CsD) equivalent to the concentration measured on individual standard curves. The precision of the assay was evaluated by determining the percent coefficient of variation upon analyses of at least nine samples for each metabolite.
Table 1.
The linear HPLC Gradient Profile Used in the C-18, 5-Micron Column for CsA Metabolite Separation
| Time (min) | Flow Rate (mL/min) | Composition* |
|---|---|---|
| 0 | 1.0 | 47:53 |
| 33 | 1.0 | 57:43 |
| 35 | 1.0 | 61:39 |
| 37 | 1.0 | 65:35 |
| 39 | 1.0 | 66:34 |
| 41 | 1.0 | 67:33 |
| 52 | 1.0 | 67:33 |
| 55 | 1.0 | 73:27 |
| 60 | 1.0 | 73:27 |
| 63 | 1.0 | 47:53 |
Acetonitrile:water.
RESULTS
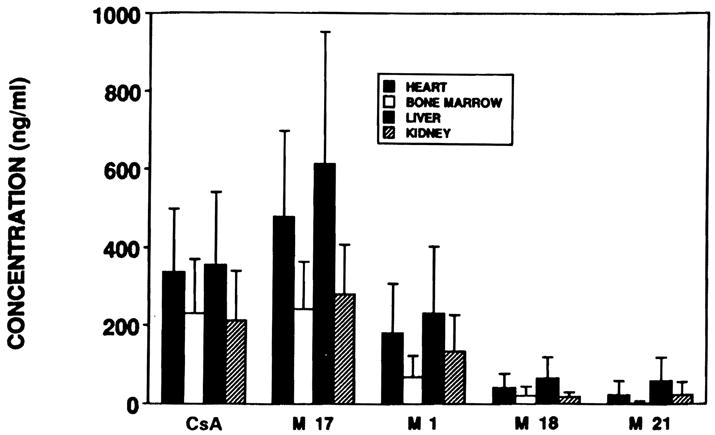
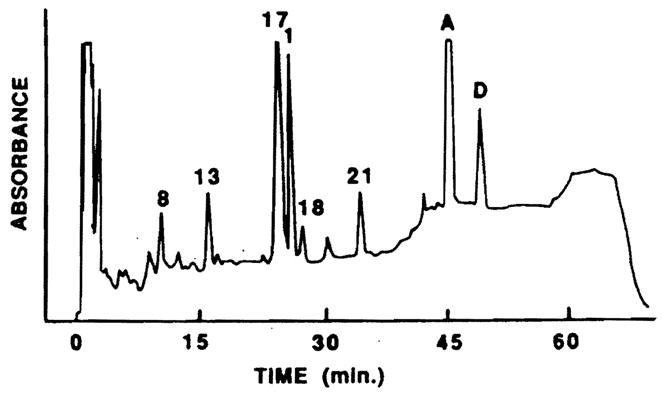
The concentrations of CsA and each of the metabolites in the trough blood samples of the transplant populations are represented in Fig 1. Figure 2 represents an HPLC chromatogram of the extract of 2 mL blood from a liver transplant patient and demonstrates the resolution of metabolite peaks from each other. The retention times for a complete metabolite profile were 10.8 minutes (M8), 16.5 minutes (M13), 24.8 minutes (M17), 26.3 minutes (M1), 27.9 minutes (M18), 35.0 minutes (M21), 45.8 minutes (CsA), and 49.7 minutes (CsD). The run time was 71 minutes with the final 20 minutes being required to eliminate extraneous lipophilic materials. This HPLC system has been used for the analysis of blood urine, and bile, and has shown minimal interference by other endogenous materials in these samples. The coefficients of variation for blood metabolite concentration measurement were 1.8% for M17 (n = 10), 4.9% for M1 (n = 10), 9.3% for M18 (n = 9), 7.6% for M21 (n = 9), and 1.8% for CsA (n = 10).
Fig 1.

Bar graph of the concentrations of each of the metabolites (±SD) in all of the patient groups studied.
Fig 2.

Chromatogram of an extract of 2 mL blood of liver transplant patient showing M8, M13, M17 (988 ng/mL), M1 (779 ng/mL), M18 (120 ng/mL), M21 (256 ng/mL), and CsA (2.058 ng/mL).
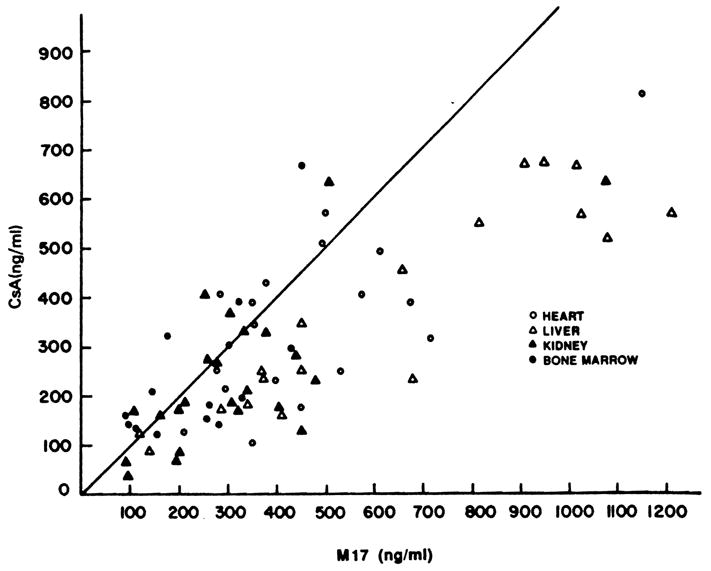
While considerable variability in metabolite concentrations did exist as shown in Fig 1, the highest quantities of metabolites were observed in the liver and cardiac transplant patients. The M17 concentrations in trough blood samples were frequently higher than CsA concentrations, as shown in Fig 3. Blood from liver, heart, and renal transplant patients had a higher M17 to CsA ratio than did the samples from bone marrow transplant patients (P < .02). In liver transplant patients particularly, the M17 blood concentration was higher than the CsA concentration (P < .02). The M17 concentration was not significantly different from the CsA concentration in renal, heart, and bone marrow transplant patients. The ratio of M1 to M17 concentration was higher in renal transplant patients than in the other transplant populations (P < .02). Eight of the 22 studies in renal transplant patients demonstrated an M1 level that was 70% or more of the M17 concentation. Only one of 14 samples from bone marrow transplant patients had detectable amounts of M21, but this low concentration of M21 in the blood of bone marrow transplant patients may relate to the intravenous (IV) route of administration of CsA.8
Fig 3.

The concentrations of M17 and CsA in each of the patients studied. The line plotted represents a 1:1 ratio between the concentrations.
DISCUSSION
Cyclosporine metabolites can be measured in trough blood samples from all transplant patients. The high concentrations of M17 demonstrated in this study are particularly notable in view of the high level of inhibitory activity of M17 against biopsy-grown lymphocytes.9 The trough concentrations of M17 in renal and heart transplant patients were higher than CsA, which is similar to previous observations.5,6 We also observed that trough M17 concentrations were an average 174% of CsA concentrations in liver transplant patients. Figure 3 demonstrates that the predisposition for M17 levels to be greater than CsA concentrations was not only present in liver transplant patients, but was also noted in heart and renal transplant patients. The concentrations of M17 were not related to the biochemical measurements of renal or hepatic function in these patient groups. While the radioimmunoassay (RIA) did provide some evidence that metabolite concentrations might be high in liver transplant patients,10 little additional useful information concerning metabolite concentrations can be derived from the RIA because of its extreme variability in reactivity to CsA metabolites.11 The contribution of M17 to the overall immunosuppressive activity of CsA should therefore continue to be assessed.
Metabolite 1 has in vitro immunosuppressive activity but less than that of M17 and CSA.12 The high concentrations of M1 compared to M17 in renal transplant patients were not significantly related to serum creatinine, although out patient population was limited. The M1 concentrations were 50% to 60% of CsA concentrations in liver, heart, and renal transplant patients. Studies of the synergistic effect of CsA metabolites with CsA may demonstrate that these concentrations can promote a significant pharmacologic or toxicologic effect. The M18 and M21 trough concentrations in blood were relatively low in comparison with the M17, M1, and CsA concentrations, but the chromatographic separation of M18 and M21 is essential for describing CsA disposition in patients.
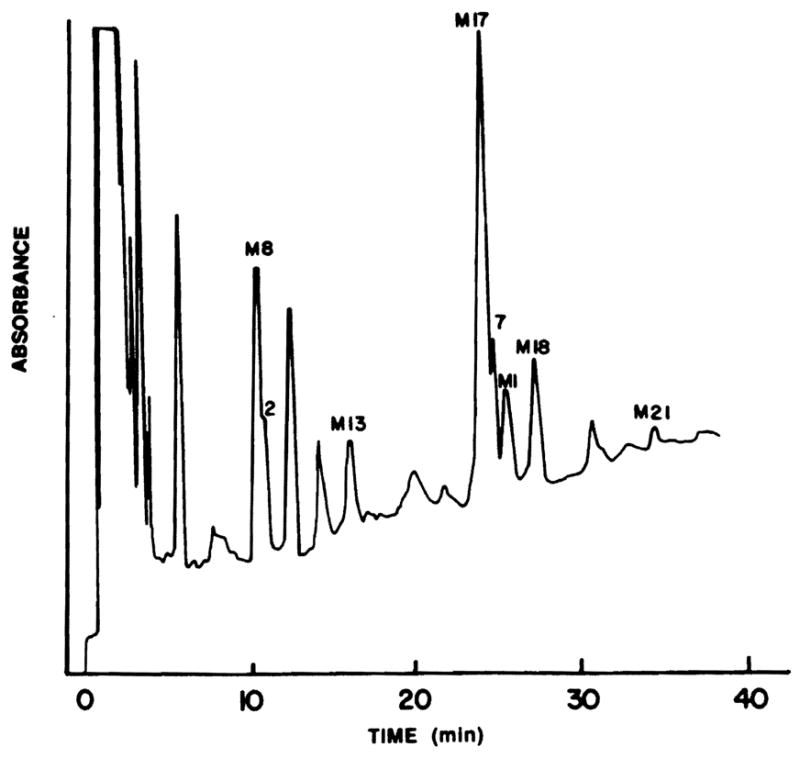
A number of important observations were made during the analysis of blood samples from this patient population. One new CsA metabolite elutes from an HPLC column under M17 in previous analytical methods and yet is in the blood in high concentrations in one of the patients included in this series. Figure 4 demonstrates the chromatogram of this patient with the new metabolite near M17 (peak 7) and an additional new CsA metabolite (peak 2). The molecular weights of these compounds were determined by fast atom bombardment/mass spectrometry. The protonated molecular ion was 1,237 for peak 2 and 1,221 for peak 7.
Fig 4.

Chromatogram of the blood extract of a liver transplant patient depicting the measured metabolites and two new CsA metabolites (peaks 2 and 7).
The ratios of the metabolite to CsA concentrations change over the course of treatment with CsA. The trough blood concentrations during early and late CsA treatment in bone marrow transplant patients have shown that the M17:CsA ratio increased threefold in 5 months. The study of the two bone marrow transplant patients during early and late periods had the concentration ratio of M17:CsA increasing from 59% and 73% in the early period to 195% and 208%, 5 months later. Changes in the metabolite pattern in liver transplant patients are complicated due to functional changes in the new liver. In one liver transplant patient, the M17:CsA ratio increased from 104% while in intensive care to 194% when stable, with the M1:CsA ratio increasing from 25% to 79%. The study of another liver transplant patient on two consecutive days showed a very consistent ratio of M17 and M1 to CsA. As in the CsA trough concentration monitoring, the varying patterns and different quantitative amounts of M17, M1, M18, and M21 in the blood of liver, heart, kidney, and bone marrow transplant patients within and between groups may be affected by liver function, blood sampling time, concurrent drug therapy, and the CsA dose.
The HPLC system described for the quantitation of CsA metabolites is precise and provides excellent resolution between metabolites. The sample preparation procedures used provided a satisfactory recovery of metabolites from blood. The peaks for M8, M13, and possibly other known metabolites could also be quantitated using this sytem. The column life is limited using this system (less than 100 samples) and is related to the critical separation of these similar compounds. The proper extraction of the specimens for CsA metabolites is critical for the removal of lipophilic materials that decrease column life.
In conclusion, high concentrations of CsA metabolites were found in the trough blood samples of renal, liver, heart, and bone marrow transplant patients. The HPLC resolution of these compounds for routine analysis is possible but requires meticulous attention to sample preparation and column care. Further studies of the pharmacologic/toxicologic importance of these metabolites in transplant patients is essential for a complete understanding of the action of CsA.
References
- 1.Freed BM, Rosano TG, Lempert N. Transplantation. 1987;43:123. doi: 10.1097/00007890-198701000-00027. [DOI] [PubMed] [Google Scholar]
- 2.Yee GC, Kennedy MS, Self SG, et al. Transplant Proc. 1986;18:774. [PubMed] [Google Scholar]
- 3.Maurer G, Lemaire M. Transplant Proc. 1986;18(suppl 5):25. [PubMed] [Google Scholar]
- 4.Burckart GJ, Wang CP, Zeevi A, et al. Transplant Proc. (in press) [Google Scholar]
- 5.Rosano TG, Freed BM, Pell MA, et al. Transplant Proc. 1986;18(suppl 5):35. [PubMed] [Google Scholar]
- 6.Shah AK, Lake KD, Sawchuk RJ. Pharm Res. 1987;4(suppl):S–107. [Google Scholar]
- 7.Burckart GJ, Wang CP, Venkataramanan R, et al. Transplantation. 1987;43:932. [PubMed] [Google Scholar]
- 8.Schwinghammer TL, Wang CP, Burckart GJ, et al. Drut Intell Clin Pharm. 1987;21:20A. [Google Scholar]
- 9.Zeevi A, Venkataramanan R, Burckart G, et al. Hum Immunol. doi: 10.1016/0198-8859(88)90089-4. (in press) [DOI] [PubMed] [Google Scholar]
- 10.Burckart G, Starzl T, Williams L, et al. Transplant Proc. 1985;17:1172. [PMC free article] [PubMed] [Google Scholar]
- 11.Holt DW, Marsden JT, Johnston A. Transplant Proc. 1986;18(suppl 5):101. [PubMed] [Google Scholar]
- 12.Zeevi A, Eiras G, Burckart G, et al. Transplant Proc. (this issue) [Google Scholar]


