

Abstract
Electrical excitability in neurons depends on the activity of membrane-bound voltage gated sodium channels (Nav) that are assembled from an ion conducting α-subunit and often auxiliary β-subunits. The α-subunit isoform Nav1.3 occurs in peripheral neurons together with the Nav β3-subunit, both of which are coordinately up-regulated in rat dorsal root ganglion neurons after nerve injury. Here we examine the effect of the β3-subunit on the gating behavior of Nav1.3 using whole cell patch clamp electrophysiology in HEK-293 cells. We show that β3 depolarizes the voltage sensitivity of Nav1.3 activation and inactivation and induces biphasic components of the inactivation curve. We detect both a fast and a novel slower component of inactivation, and we show that the β3-subunit increases the fraction of channels inactivating by the slower component. Using CD and NMR spectroscopy, we report the first structural analysis of the intracellular domain of any Nav β-subunit. We infer the presence of a region within the β3-subunit intracellular domain that has a propensity to form a short amphipathic α-helix followed by a structurally disordered sequence, and we demonstrate a role for both of these regions in the selective stabilization of fast inactivation. The complex gating behavior induced by β3 may contribute to the known hyperexcitability of peripheral neurons under those physiological conditions where expression of β3 and Nav1.3 are both enhanced.
Keywords: Circular Dichroism (CD), Ion Channels, NMR, Protein Domains, Sodium Channels, Auxiliary β 3-Subunit
Introduction
Voltage-gated sodium (Nav) channels are responsible for the rising component of the action potential. The Nav channel is composed of a 260-kDa α-subunit containing the ion-selective pore together with 25–40-kDa regulatory β-subunits. There are 10 mammalian α-subunit genes (Nav 1.1–1.9 and an atypical channel) and 4 β-subunit genes (β 1–4) (1, 2). The β-subunits influence the kinetics and voltage dependence of the α-subunit gating (3). Individual α and β-subunit genes are expressed in complex tissue-specific and developmentally regulated patterns to generate a wide combinatorial variety of channels with distinct properties, which presumably reflects the differing physiological demands of individual cells, tissues, and organs (4). A noticeable example is shown by the neuronal channel α-subunit Nav1.3 (5) and the β3-subunit (6). The tissue-specific expression patterns of Nav1.3 correlate closely with β3 (6–8), and the subunits show parallel expression patterns throughout development (7, 9). Furthermore, the expression of these two proteins is co-coordinately up-regulated in rat dorsal root ganglion neurons in a nerve-injury model of neuropathic pain (10–13) and in experimental diabetic neuropathy (7, 14). This suggests that the β3-subunit may play an important role in the selective regulation of Nav1.3 in both physiological and pathological situations.
As with all β-subunits, β3 is composed of an extracellular V-type immunoglobulin (Ig) domain, a single α-helical transmembrane domain, and a short intracellular domain (6). In both β3 and its close homolog β1, mutations that affect the structure of the Ig domain modify gating behavior (15, 16). By contrast, the effects of the intracellular domains are less clearly established. In β1, there are conflicting reports concerning the effects of the intracellular domain on α-subunit gating (17, 18). In the case of β3, the role of the intracellular domain has been difficult to assess as its deletion led to a β3-subunit that failed to bind the α-subunit (16). This ambiguity is compounded by the current lack of structural information on any β-subunit intracellular domain.
Here we use whole cell patch clamp electrophysiology to examine the effect of β3 on Nav1.3 gating. We show that β3 generates multiphasic inactivation curves and reduces the proportion of channels that inactivate via a fast current decay in favor of a novel, relatively slow current decay. Using CD and NMR spectroscopy, we identify a short amphipathic α-helix and a C-terminal disordered region within the β3-subunit intracellular domain. We show that both of these features selectively help to stabilize fast inactivation of Nav1.3. Our work reveals new insights into the effects of the β3-subunit on Nav gating and provides a striking example of Nav regulation driven by localized conformationally dynamic motifs.
EXPERIMENTAL PROCEEDURES
Reagents
All reagents were purchased from Sigma or Fisher unless otherwise stated.
Peptide Synthesis
Peptides corresponding to the wild type β3 and mutant intracellular domain were synthesized by Alta Biosciences Edgbaston, Birmingham, UK. Lyophilized peptides were reconstituted at ∼4 mg/ml in 2 mm sodium phosphate buffer adjusted to pH 7.2, stored at −80 °C until use.
Circular Dichroism
CD spectra between 250 and 190 nm were recorded on an AVIV 215 spectropolarimeter at 25 °C and 0.5-nm steps. Peptides were diluted from stock into 2 mm sodium phosphate buffer, pH 7.2, to working concentrations of 78 μg/ml (pep-WT) and 75 μg/ml (pep-AP) as determined by UV spectroscopy utilizing the single tyrosine present in the sequence. Spectra were separately measured in 2 mm sodium phosphate, pH 7.2, alone or supplemented with 30% trifluoroethanol (TFE)4 in a 1-mm path length quartz cuvette. Peptide samples were centrifuged at 13,000 rpm for 2 min at 25 °C to reduce noise due to scattering. The spectra were not corrected for the refractive index of the solvent. For each spectrum the raw data from at least 15 scans was averaged, smoothed, and transformed into mean residue ellipticity using the DichroWeb server. The transformed data were deconvoluted and analyzed using the CDSSTR algorithm (19).
Nuclear Magnetic Resonance
1H NMR spectra were recorded on a Bruker DRX 600 spectrometer operating at 600 MHz 1H frequency equipped with a TXI pulsed field gradient probe. Samples were 0.3 mm in peptide and contained 30% (v/v) TFE and 5% D2O for lock stabilization. Two-dimensional NOESY (mixing time 150 ms), TOCSY (mixing time 70 ms), and DQF COSY experiments were recorded at 298 K using either a Watergate solvent-suppression scheme or gradient coherence-order selection. Experiment times varied between 18 and 25 h.
Mutations
The cDNA encoding full-length human β3-subunit was subcloned into the plasmid pFastBacMam (20). It was modified to include a C-terminal cMyc tag (21) to facilitate immunodetection in additional experiments. Mutations in the intracellular domain were introduced using the QuikChange method (Stratagene). Positive clones were identified by restriction digestion of isolated plasmids and verified by sequencing.
Transient Transfection
For electrophysiological studies, we used a HEK293 cell line stably expressing Nav1.3 (5). Cells were maintained in DMEM with 10% fetal calf serum (Invitrogen) supplemented with 1× nonessential amino acids (Invitrogen), 2 mm l-glutamine (Invitrogen), and 0.4 mg/ml Geneticin (Invitrogen) at 37 °C and 5% CO2. For conventional patch clamp experiments, cells in 25-cm2 tissue culture flasks were transfected with 10 μg of plasmid DNA (2 μg of pFastBacMam-GFP and 8 μg of pFastBacMam-β3) using Lipofectamine 2000 (Invitrogen) according to the manufacturer's instructions. Cells were detached from the flasks 48 h after transfection using Versene (Invitrogen) and inoculated into the wells of a 6-well plate containing three pre-sterilized borosilicate glass coverslips (13 mm, thickness no. 0) and 2 ml of media. The plate was incubated at 37 °C with 5% CO2 for ∼1.5–2 h to allow the cells to settle. Transfected cells were identified by GFP fluorescence using Nikon Eclipse TE200 inverted optics microscope. Recordings were made at room temperature (19 °C).
Whole Cell Voltage Clamp Electrophysiology
Currents were recorded from the transfected HEK293-Nav1.3 cells using the whole cell configuration of the patch clamp recording technique (22) with an Axopatch 200B Amplifier (Axon Instruments). All voltage methods were applied using pCLAMP 8.2 software (Axon Instruments) and a Digidata 1322A (Axon Instruments). Borosilicate glass patch pipettes (Harvard Apparatus Ltd.) were pulled in four steps using a Sutter P-97 and fire-polished (Narashige micro forge MF-830) to a final resistance of 1–2 megaohms. The series resistance for almost all recordings was less than 6 megaohms, and data where the series resistance was greater than 9 megaohms were not used. The extracellular bath solution contained 4.7 mm KCl, 70 mm NaCl, 70 mm choline chloride, 5 mm HEPES, 11 mm glucose, 1.2 mm MgCl2, and 1 mm CaCl2. The pH was adjusted to 7.4 using NaOH. The pipettes were back-filled with 120 mm CsF, 15 mm NaCl, 10 mm HEPES, 10 mm EGTA, 2 mm Mg ATP, and 0.3 mm Na GTP, pH 7.25. The experimental voltage protocols were initiated exactly 12 min after obtaining access to the cell, and protocols were applied in the same order for each cell. Signals were sampled at 20–50 kHz after low-pass Bessel filtering at 10 kHz. Leak current was estimated using the P/N protocol supplied with the pCLAMP software using four hyperpolarizing subsweeps before the stimulus waveform and was subtracted from the voltage-dependent currents. Membrane potentials were not corrected for the liquid junction potential, which was calculated to be 9.0 mV at 19 °C (using pCLAMP software). Data from cells with a current amplitude of >4 nA or from cells that showed evidence of poor voltage control as reflected in the shape of the current-voltage curve were not included in the analysis.
The voltage dependences of activation were determined from Nav1.3 currents elicited by 5-mV incremental step depolarizations of 20-ms duration (−95 mV to +65 mV) from a −90 mV holding potential. The inter-sweep holding potential was −100 mV. To generate steady-state inactivation, Nav1.3 channels were inactivated by 5-mV incremental step depolarizations of 1-s duration (−100 to +15 mV) from a holding potential of −90 mV. The conditioning pulse was followed by a test pulse to −10 mV for 20 ms to determine the fraction of channels available for activation. Test pulse current amplitudes were normalized to the maximum test pulse amplitude for each cell individually, plotted against conditioning pulse, and fit with a single or the sum of two Boltzmann functions.
Conductance (g) was calculated from peak current amplitude (I) according to the equation g = I/(V − Vrev), where V is the test potential, and Vrev is the experimentally determined reversal potential. Normalized conductance and selected inactivation curves were fit with the single Boltzmann function,
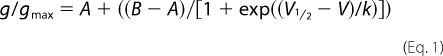 |
where g/gmax is the normalized conductance or current, V½ is the voltage of half-maximal activation or inactivation, k is the slope factor, V is the test pulse or conditioning pulse potential, and A and B are the minimum and maximum normalized conductance values.
Where appropriate, channel availability was described by the sum of two Boltzmann functions,
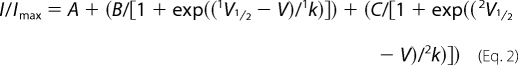 |
where B and C relate to the amplitudes of each Boltzmann function. After fitting curves, Boltzmann functions were arranged from most negative V½ to most positive V½ in the order 1V½, 1k and 2V½, 2k.
The time courses of current decay were described with two exponentials using ClampFit,
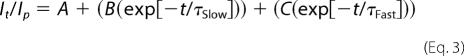 |
where Ip is the peak current, It is the current at time t, A, B, and C are the magnitudes of the persistent, slow, and fast components, respectively, τSlow and τFast are the time constants of the slow and fast components, respectively, and t is time in ms.
To examine inactivation of the fast and slower components separately, the test pulse current decay from the 1-s inactivation protocol was fit with the two exponential equation. The amplitudes of each component were normalized to the total test pulse current amplitude or in the case of the fast component, the maximum amplitude of the fast component, and plotted against conditioning potential.
All experimental and calculated data were viewed in the Spotfire Decision Site (TIBCO software Inc.) to rule out any trends between the calculated parameters and properties of the patched cell such as whole cell capacitance, series resistance, and peak current. Data comparisons were subjected to a one-way analysis of variance test using GraphPad Prism Version 3.02 for windows (GraphPad software, San Diego, CA). Probability (p) values were adjusted using the Bonferroni post hoc tests to determine significance of differences. Samples were considered significantly different at p < 0.05. All means quoted are ±S.E.
RESULTS
The β3-Subunit Increases the Time to Reach Peak Current and the Proportion of Slower Inactivating Channels
The expression of endogenous β1- or β3-subunit mRNAs in the HEK293-Nav1.3 cell line was negligible by TaqMan analysis (data not shown). HEK293-Nav1.3 cells were transiently transfected with GFP alone (Nav1.3/no β3) or transiently transfected with GFP and wild-type β3 (Nav1.3/β3-WT). Sodium currents were elicited by 20-ms depolarizations to varying potentials in 5-mV increments from a holding potential of −90 mV (“Experimental Procedures”). A family of traces from representative cells of each type is shown in Fig. 1A. A substantial slowly inactivating component of current decay was observed in Nav1.3/β3-WT cells, and the time to peak was also increased relative to Nav1.3/no β3 cells (Table 1). Current decay was described by a double exponential equation. Relative to Nav1.3/no β3 cells, co-expression of β3-WT significantly increased τSlow at the voltage that elicited the peak current and significantly increased the proportion of channels that inactivated with the slower time constant (Table 1).
FIGURE 1.

Co-expression of β3-WT with Nav1.3 slows the rate of inactivation and destabilizes the voltage dependence of activation in HEK293 cells. Whole cell sodium currents were elicited as described under “Experimental Procedures.” All mean data points are presented ±S.E. A, a family of current traces from representative Nav1.3/no β3 and Nav1.3/β3-WT cells is shown. Peak current amplitudes were 2.6 nA (Nav1.3/no β3) and 2.7 nA (Nav1.3/β3-WT). Traces are shown every 10 mV from −90 to +30 mV. Co-expression of β3-WT slows the rate of current decay. B, shown is the mean normalized conductance/voltage relationship for Nav1.3/no β3 cells or Nav1.3/β3-WT cells. Means (±S.E.) were generated from the following sample numbers: Nav1.3/no β3 n = 27; Nav1.3/β3-WT n = 24. Conductance was calculated from conditioning pulse currents using the measured reversal potential for each cell and normalized, and the means ± S.E. were plotted against voltage. The data from each cell were fit with a single Boltzmann function to generate the V½ and slope (k) values presented in Table 2.
TABLE 1.
Time to peak and kinetics of inactivation for Nav1.3 expressed alone or with β3-subunits
Co-expression of β3-WT with Nav1.3 increases the time to reach peak current and slows the rate of inactivation using a family of 20-ms depolarizations (“Experimental Procedures”). All β3-subunits significantly increased the mean time to peak, increased the proportion of channels that decay with a slower time constant, reduced the proportion of channels that decay with the fast time constant, and increased the time constant for the slow component of current decay (τslow). Means (±S.E.) were generated from the sample numbers shown (n). Significant differences from Nav1.3/no β3 are indicated in the footnotes.
| β3-Subunit | Time to peak at peak I | Time to peak at V½ | Current decay |
n | ||||
|---|---|---|---|---|---|---|---|---|
| Amplitude of slow | τSlow | Amplitude of fast | τFast | Amplitude of persistent | ||||
| ms | ms | % | ms | % | ms | % | ||
| No β3 | 0.61 ± 0.01 | 0.98 ± 0.03 | 16.08 ± 1.51 | 4.49 ± 0.43 | 79.35 ± 1.94 | 0.70 ± 0.02 | 4.57 ± 0.60 | 27 |
| β3-WT | 0.82 ± 0.03a | 1.25 ± 0.05a | 36.80 ± 4.01a | 7.65 ± 0.48a | 56.58 ± 4.62a | 0.75 ± 0.04 | 6.62 ± 0.78 | 24 |
| β3-AP | 0.85 ± 0.05a | 1.34 ± 0.06a | 36.64 ± 6.29b | 7.22 ± 0.68c | 54.35 ± 7.51b | 0.76 ± 0.06 | 9.00 ± 1.86 | 14 |
| β3-ΔSE | 0.81 ± 0.03a | 1.34 ± 0.07a | 38.05 ± 3.88b | 8.44 ± 1.21a | 52.39 ± 5.83b | 0.84 ± 0.11 | 9.56 ± 2.93 | 12 |
a p < 0.001.
b p < 0.01.
c p < 0.05.
The β3-Subunit Destabilizes the Voltage Dependence of Activation and Induces Biphasic Inactivation
The voltage dependence of activation for Nav1.3/no β3 cells and Nav1.3/β3-WT cells was determined from the amplitudes of the conditioning pulse currents elicited by a family of 20-ms depolarizing pulses to various potentials (“Experimental Procedures”). The conductance/voltage relationship was described by a single Boltzmann function (Fig. 1B). Co-expression of β3-WT induced a significant positive shift in the V½ of activation relative to Nav1.3/no β3 cells and significantly increased the slope factor (Fig. 1B, Table 2).
TABLE 2.
Boltzmann parameters for activation of Nav1.3 expressed alone or with β3-subunits
Activation Boltzmann parameters for Nav1.3 co-expressed with β3-WT and mutant β3 subunits is shown. To determine the voltage dependence of activation, whole cell sodium conductances at various potentials were described by a single Boltzmann function as described under “Experimental Procedures.” Mean V½ and slope (k) (± S.E.) were generated from individual fits of the total sample number (n) shown. Significant differences from Nav1.3/no β3 are indicated by the footnotes.
| β3-Subunit | V½ | k | n |
|---|---|---|---|
| mV | mV | ||
| No β3 | −24.1 ± 0.9 | 7.8 ± 0.1 | 27 |
| β3-WT | −17.2 ± 1.2a | 9.3 ± 0.2b | 24 |
| β3-AP | −15.9 ± 1.8b | 9.1 ± 0.3a | 24 |
| β3-ΔS.E. | −14.1 ± 1.7b | 9.4 ± 0.4b | 14 |
a p < 0.01.
b p < 0.001.
The voltage dependence of inactivation was determined using a 1-s conditioning pulse as described under “Experimental Procedures.” The 1-s protocol was chosen to generate steady-state inactivation, as extended pulses (up to 60 s) produced no further hyperpolarizing shifts in the inactivation curve (data not shown). Normalized test pulse currents from Nav1.3/no β3 cells plotted against conditioning potential were best described by a single Boltzmann function (supplemental Fig. S1). In contrast, Nav1.3/β3-WT cells exhibited more complex behavior. About half (data not shown) of the Nav1.3/β3-WT cells generated multiphasic inactivation curves (Fig. 2A) that were best fitted to a biphasic plot (supplemental Fig. S1). The remaining curves were best fitted to a monophasic plot. The V½ and slope (k) parameters generated from the single Boltzmann curve fits (sV½, sk) were close in value to the 1V½ and 1k parameters derived from the biphasic curve fits. Therefore, these parameters were combined to generate the mean values shown in Table 3. The β3-WT significantly reduced the mean 1k and sk relative to Nav1.3/no β3 cells (Table 3). This together with the biphasic component of β3-WT inactivation generated a distinctive mean channel availability plot for Nav1.3/β3-WT cells depolarized relative to Nav1.3/no β3 cells. The influence of the second phase was particularly clear between potentials −55 and −30 mV (Fig. 2B).
FIGURE 2.

Channel availability using a 1-s conditioning pulse is monophasic for Nav1.3/no β3 but biphasic and destabilized upon co-expression of β3-WT. A, shown are channel availability for three examples of Nav1.3/no β3 cells and three examples of Nav1.3/β3-WT cells. The Nav1.3/no β3 examples were best described by a single Boltzmann function, whereas the Nav1.3/β3-WT examples were best described by the sum of two Boltzmann functions (see also supplemental Fig. S1). B, mean channel availability plots for Nav1.3 cells/no β3 and Nav1.3 cells/β3-WT are shown. Means (±S.E.) were generated from the following sample numbers: Nav1.3/no β3, n = 26; Nav1.3/β3-WT, n = 15. C, the β3-WT subunit modulates the proportion of fast and slower inactivating channels. Test pulse current decay was described by a double exponential function to determine the amplitudes of the fast, slow, and persistent components as shown. The persistent component is estimated by extrapolating the curve beyond 20 ms. D, β3-WT increases channel availability by increasing the proportion of channels that inactivate with a slower time constant. Mean amplitudes are shown for Nav1.3/no β3 and Nav1.3/β3-WT cells at each conditioning potential. Amplitudes are expressed as a fraction of the total test pulse amplitude.
TABLE 3.
Boltzmann parameters for inactivation of Nav1.3 expressed alone or with β3-subunits using the 1-s conditioning pulse
Inactivation parameters using the 1-s conditioning pulse are shown. Test pulse current amplitudes were plotted against conditioning potential and fit with a single or the sum of two Boltzmann functions as described under “Experimental Procedures.” Means (±S.E.) were generated from the individual fits of the total sample numbers shown (n). Parameters derived from all data that were best described by the sum of two Boltzmann functions (phases 1 and 2) are shown as well as the sum of the most negative component of the two-component fits (phase 1) combined with parameters derived from data described by a single Boltzmann function (monophasic). Significant differences from Nav1.3/no β3 are indicated by footnotes a and c. Significant differences from Nav1.3/β3-WT are indicated by footnotes b and d.
| β3-Subunit | Boltzmann parameter | Phase 1 | Phase 2 | Phase 1 and monophasic |
|---|---|---|---|---|
| No β3 | V½ (mV) | −71.9 ± 1.0 | ||
| k (mV) | 7.4 ± 0.3 | |||
| Amplitude (%) | ||||
| n | 0 | 0 | 26 | |
| β3-WT | V½ (mV) | −69.7 ± 1.7 | −41.3 ± 2.4 | −70.1 ± 1.1 |
| k (mV) | 5.0 ± 0.5 | 5.7 ± 0.7 | 5.6 ± 0.4a | |
| Amplitude (%) | 68 ± 9 | 32 ± 9 | ||
| n (mV) | 8 | 8 | 15 | |
| β3-AP | V½ (mV) | −66.7 ± 0.9 | −60.7 ± 1.4b | −64.0 ± 1.5b,c |
| k (mV) | 2.1 ± 0.5d | 10.5 ± 0.8b | 4.9 ± 0.7c | |
| Amplitude (%) | 34 ± 4 | 65 ± 5 | ||
| n | 3 | 3 | 11 | |
| β3-ΔSE | V½ (mV) | −62.5 ± 1.8 | −39.2 ± 3.6 | −62.6 ± 1.0c,d |
| k (mV) | 3.9 ± 0.4 | 4.9 ± 1.1 | 5.0 ± 0.4c | |
| Amplitude (%) | 68 ± 8 | 30 ± 9 | ||
| n | 5 | 5 | 10 |
a p < 0.01.
b p < 0.05.
c p < 0.001.
d p < 0.01.
Test-pulse traces indicated that current decay occurred with a combination of both fast and slower time constants (Fig. 2C). Double exponential functions were used to describe these traces and determine amplitudes of the fast and slower components and the proportion of each component at increasing conditioning potentials. The proportion of channels that inactivated with the slower time constant was significantly increased by β3-WT (Fig. 2D). In particular, channels operating in the fast mode were completely inactivated at conditioning potentials positive to −55 mV (Fig. 2D). Hence, the β3-induced slower component was responsible for the second phase of the mean channel availability plot (Fig. 2B).
The β3 Intracellular Domain Contains Structurally Distinct Regions
Does β3 influence these experimentally distinguishable gating modes via localized domains within its structure? In our initial work we focused on the β3 intracellular domain because that small, self-contained region nevertheless remains relatively uncharacterized from both a structural and functional perspective.
Based on secondary structure predictions, it has previously been suggested that a region within the β3 intracellular domain, approximately bounded by Ser161 and Tyr174 may adopt a short amphipathic α-helix (23). The Ser161 residue lies within a consensus protein kinase A recognition site that can be phosphorylated in vivo (23). The amphipathic nature of the putative helix within this region, its sequence conservation between distantly related species (24), and the potential for post-translational modification of surrounding amino acids suggests the helical propensity may have functional implications. On the other hand, programs designed to detect local regions of protein disorder, for example DisEMBL (25) and PONDR (26), imply that much of the intracellular domain may be unstructured (data not shown). To gain greater insight into these disparate features, we examined the structure of peptides corresponding to the wild type and modified β3 intracellular domain using CD and NMR spectroscopy both in aqueous media and in the presence of 30% (v/v) TFE. The solvent TFE has been extensively used to enhance the stability of short secondary structural elements in peptides to mimic the structure adopted by short sequences in assembled proteins (27–29). The β3 peptides examined were (Fig. 3A) (i) the wild-type sequence (pep-WT) and (ii) A mutant sequence in which the Ala166 equivalent residue was replaced by proline to inhibit any potential α-helical propensity (pep-AP).
FIGURE 3.

The intracellular domain of β3 is conformationally dynamic. A, shown are sequences of pep-WT and pep-AP corresponding to β3 intracellular domain sequences. The location of the Ala to Pro mutation in pep-AP is underlined. B, α-helix and disorder predictions for β3 peptides in aqueous media and aqueous media with 30% TFE were determined by CD spectroscopy. C, chemical shift differences Δδ1Hα between the measured 1Hα chemical shifts of the peptides compared with the random coil shifts corrected for neighboring effects (30). Numbering refers to peptide residue position. D, shown is a helix wheel representation of putative helical region within the β3 intracellular domain. Numbering refers to the mature β3 protein.
Detailed CD spectra for each peptide in aqueous buffer, pH 7.2, and in buffer supplemented with 30% (v/v) TFE are shown in supplemental Fig. S2, and the summarized estimated proportions of secondary structure elements are shown in Fig. 3B. The α-helical composition of the peptides was negligible in aqueous buffer alone. However, the addition of 30% (v/v) TFE resulted in a significant increase in the α-helical content. For pep-WT this amounts to 20% of the sequence or approximately 2 turns of a standard α-helix. This is closely mirrored by a proportionate decrease in disorder (Fig. 3B) and an increase in the magnitude of the negative Cotton effect at 222 nm (supplemental Fig. S2). In contrast, the α-helical content of pep-AP in 30% (v/v) TFE was significantly lower and disorder correspondingly higher relative to the other peptides (Fig. 3B), indicating a reduced α-helical potential, as expected for a proline introduced into this region.
NMR chemical shifts are very sensitive to the local environment and are indicative of the secondary structure of a protein or peptide when compared with the expected random coil chemical shifts in the unstructured state. To this purpose, the peptides were investigated using homonuclear 1H NMR methods. In aqueous buffer, attempts to assign backbone and side-chain protons of the peptides based on two-dimensional NOESY, TOCSY, and DQF COSY spectra failed due to the low chemical shift dispersion of the peptide signals. This suggests that in aqueous buffer the peptides were predominantly unstructured, a result that is consistent with the CD data. However, in 30% (v/v) TFE, there was a significant increase in the observed chemical shift dispersion for the peptides. This allowed the sequential assignment of the peptides and, in agreement with the CD data, confirmed a higher secondary structure content.
The 1Hα chemical shifts of the peptides were compared with the random coil shifts of the unstructured peptides. To improve the diagnostic power of the chemical shift data, the random coil chemical shifts were corrected for neighboring residue effects (30). The difference Δδ between the experimentally determined 1Hα chemical shifts and the calculated 1Hα random coil chemical shifts plotted against the primary sequence is shown in Fig. 3C, with detailed shift assignments for each peptide presented in supplemental Table S1. It is noticeable that for residues 13–34 (equivalent to amino acid residues 170–191 of the complete β3 sequence) all peptides showed very similar behavior, where the Δδ fluctuated between negative and positive values. With the exception of peptide residues 20 and 30, which precede a proline residue (thus, leading to difficulties with the secondary structure prediction), the remaining Δδ values deviated only slightly from zero as would be expected for an unstructured region. This suggests that the C-terminal halves of the peptides remained disordered. However, for peptides residues 5–13 (i.e. residues 162–170 of the β3 protein), the Δδ values of the peptides were consistently negative. The assembly of several sequential residues with negative Δδ1Hα values indicates an α-helical region. Significantly, the α-helical content of this region was noticeably reduced for pep-AP. The 8 residues are sufficient to form 2 turns of an α-helix and add up to 24% helical character, very similar to the prediction from CD. Taken together, the CD and NMR data suggest that the β3 intracellular domain has a propensity to adopt a structure containing two contrasting elements, a short but amphipathic α-helix within the region previously identified on the basis of secondary structure prediction (23) together with a disordered region that extends for most of the remaining sequence (Fig. 3, C and D).
Mutations in the Intracellular Domain Selectively Destabilize the Fast Component of Inactivation
To investigate how these structural features influence Nav1.3 channel gating, we generated the following intracellular domain mutants. First, we replaced Ala166 with proline (hereafter referred to as β3-AP) to reduce any helical tendency in this region. Second, we deleted the extreme C-terminal residues from amino acid Ser179 to Glu191 corresponding to the non-helical region implied by two-dimensional NMR data (β3-ΔSE) (Fig. 4A). The mutant β3 constructs were transiently transfected into HEK293-Nav1.3 cells, and their electrophysiological effects were examined in comparison to β3-WT.
FIGURE 4.

Mutations in the β3 intracellular domain destabilize Nav1.3 inactivation. A, shown is a summary of the β3 intracellular domain mutants used in the electrophysiological analysis. Shown are mean channel availability plots (B) and difference curves for Nav1.3 cells/no β3, Nav1.3 cells/β3-WT, Nav1.3 cells/β3-AP, and Nav1.3 cells/β3-ΔSE using data from all cells (C). Means (± S.E.) were generated from the following sample numbers: Nav1.3/no β3, n = 26; Nav1.3/β3-WT, n = 15; Nav1.3/β3-AP, n = 13; Nav1.3/β3-ΔSE, n = 12.
As with β3-WT, co-expression of the β3-subunit mutants significantly increased the proportion of channels inactivating with the slower kinetics and increased τSlow at the voltage that elicited peak current relative to Nav1.3/no β3 cells. However, the mutants showed no significant differences from β3-WT in these parameters (Table 1). Both mutants induced a significant positive shift in the V½ of activation relative to Nav1.3/no β3 cells, but again, this shift was not significantly different from β3-WT (Table 2).
Both mutants reduced 1k and sk values for inactivation relative to Nav1.3/no β3 cells, but these were not significantly different from Nav1.3/β3-WT cells (Table 3). However, relative to both Nav1.3/no β3 and Nav1.3/β3-WT cells, the mutants significantly shifted the 1V½ and sV½ values for inactivation in the positive direction (Table 3; Fig. 4B). We also examined the percentage of inactivation at different potentials (supplemental Table S2) and plotted the data as difference curves (% inactivation for Nav1.3/no β3 cells − % inactivation for Nav1.3/β3-WT or β3 mutants, at each potential) (Fig. 4C). This approach emphasized the range of conditioning potentials maximally affected by β3 mutants and further confirmed that both mutants demonstrated an enhanced destabilizing effect relative to β3-WT.
All β3-subunits increased the proportion of channels inactivating with the slower time constant (Fig. 5A). To determine the voltage dependence of fast inactivation, the amplitudes of the fast components at each conditioning potential (estimated from the test pulse decay traces, as described above) were normalized to the maximum amplitude of the fast component for each cell. The mean values indicated that the mutants depolarized the voltage sensitivity of the slower component to the same extent as β3-WT. However, both mutants depolarized the fast inactivation curve relative to β3-WT, and in the case of β3-ΔSE, the shape of the curve was also substantially altered (Fig. 5B). Hence, for cells expressing the intracellular domain mutants, the enhanced positive shifts in the total channel availability plots in Fig. 4B were due to the destabilization of fast inactivation around potentials that are typical for neuronal cells.
FIGURE 5.

Co-expression of mutant β3 but not β3-WT destabilizes the fast component of inactivation. A, all β3-subunits increased the proportion of channels inactivating with a slower time constant relative to Nav1.3/no β3 cells. The increase was significant for Nav1.3/β3-WT and Nav1.3/β3-ΔSE, but Nav1.3/β3-AP was not significantly different from Nav1.3/no β3 or Nav1.3/β3-WT. Sample numbers for the fast and slower components were reduced at more positive conditioning potentials where test pulse current amplitudes were too small to fit. B, shown is a comparison of the voltage sensitivity of the fast gating channels. Means (±S.E.) were generated from the following sample numbers: Nav1.3/no β3, n = 20; Nav1.3/β3-WT, n = 20; Nav1.3/β3-AP, n = 15; Nav1.3/β3-ΔSE, n = 13. Conditioning potentials where the amplitude of the fast component was significantly greater (p < 0.05) for the mutant β3-subunits relative to Nav1.3/β3-WT were −60 mV (Nav1.3/β3-AP and Nav1.3/β3-ΔSE) and −75 mV (Nav1.3/β3-ΔSE).
DISCUSSION
Here we show that in HEK293 cells, β3 depolarizes the voltage sensitivity of Nav1.3 activation and inactivation and induces biphasic components of inactivation. The β3-WT subunit slowed the time to peak current and the rate of inactivation of Nav1.3. The slower time to peak could indicate an increased dwell time in the closed states before opening, a decreased rate of inactivation onset from the open state, or an increase in the return rate to the open state from the inactivated state. The β3-subunit increased the proportion of channels that inactivated with slower kinetics and increased the time constant for the slower component of inactivation. This generated the biphasic channel availability curves. To analyze these curves in more detail, we determined the percentage of inactivation at each conditioning potential. Separation of the fast and slower components of the test pulse currents clarified the nature of the different phases, enabled each phase to be studied individually without one contaminating the other, and provided detailed information on the voltage dependence of each component. We suggest that this approach could allow further mutational dissection of β3 domains even where the underlying gating behavior is not straightforward and the effects are subtle. Previous work in Xenopus oocytes has revealed similar inactivation effects (31). However, as far as we are aware, the ability of β3 reciprocally to modulate the proportion of channels operating with fast and slower inactivation kinetics has not been reported in mammalian cells. Our data are consistent with two possibilities. Either β3 substantially increases the time constant for fast inactivation in a proportion of channels or it reduces the probability that channels will follow this fast pathway.
The β3-induced slower current is probably distinct from the previously described inherent Nav1.3 persistent current with its greater time constant of >150 ms (5). Although we present a small (5–10%) theoretical persistent component by describing current decay with a double exponential function, current decay traces only spanned a 20-ms duration, which limits the accuracy of identifying a true late current. In common with most Nav channel studies in HEK293 cells (31), we used a CsF-based internal solution. It has been shown previously that the use of CsF can destabilize the persistent current over time (5). We were unable to detect a substantial persistent current using a 1-s conditioning pulse of the inactivation protocol. However, this was applied after the activation protocol, and it is possible that any persistent component had mostly disappeared by this time. Cummins et al. (31) previously reported that β3 slowed macroscopic current decay of Nav1.3 in HEK293 cells over potentials ranging from −40 to −10 mV. However, the current decay was described by a single exponential function, and channel availability curves were monophasic. This suggests that the biphasic components of the inactivation curves described here represent a previously unrecognized feature of Nav1.3 gating behavior. Cummins et al. (31) used a more negative holding potential and a different external buffer than we used here. Furthermore, unlike Cummins et al. (31), we included ATP and GTP in the internal buffer (experimental procedure). It is possible that this difference could influence the phosphorylation status of Nav1.3 in our experiments.
The depolarizing shifts observed with β3 in HEK293 cells are in the opposite direction to those shown by β3 and Nav1.3 when co-expressed in CHO cells (32). Such cell-dependent differences have been reported for several sodium channel α- and β-subunit pairs (33, 34), but the explanation is unclear. The HEK293 cell line is a widely used and convenient expression system to study the electrophysiolgical properties of Nav and other ion channels (35). Immunological and microarray analysis suggest that the HEK293 cell-line is neuronally derived (36) and may, therefore, be the more physiologically relevant model. If the influence of β3 on Nav1.3 in HEK293 cells is also apparent in a primary neuronal cell, it would delay repolarization, amplify the response to presynaptic signals, and increase the excitability of neurons in vivo. Hence the parallel up-regulation of Nav1.3 and β3 in rat dorsal root ganglion sensory neurons after peripheral nerve injury (10) could contribute to pain sensation. The recently described β3 knock-out mouse (37) will be an excellent model organism with which to address these questions in further detail.
Because β3-WT and both mutants similarly increased the fraction of slowly inactivating current, the region on β3 that is responsible for these effects probably lies outside the intracellular domain elements investigated here. In contrast, our data indicate that fast inactivation is selectively sensitive to mutations within the β3 intracellular domain. Surprisingly, β3-WT did not significantly affect the voltage dependence of fast inactivation relative to Nav1.3 alone, yet both mutants clearly destabilized this specific parameter. It seems unlikely that both mutants have independently created a new binding site on the α-subunit capable of destabilizing fast inactivation. Rather we suggest that the intracellular domain normally stabilizes fast inactivation, whereas the extracellular and/or transmembrane domains destabilize, resulting in no net detectable effect on fast inactivation for β3-WT. If the stabilizing effect of the intracellular domain is compromised by mutation, the destabilizing effects of the other regions will then predominate.
How might the β3 intracellular domain normally stabilize fast inactivation? During fast inactivation a short cytoplasmic loop between domain DIII and IV of the α-subunit acts as a hinged lid to block the inner mouth of the ion-conducting pore (38). Recent work indicates that an α-helix at the α-subunit C terminus interacts with the DIII-IV linker and helps to stabilize fast inactivation (39). Interestingly, an adjacent region of the α-subunit C terminus (the EF hand) binds the intracellular domain of β1 and β3 (40). We suggest that this interaction may promote the association of the α-subunit C terminus with the DIII-IV linker, perhaps by holding the C terminus in the optimal alignment for linker binding. It will be important now to test this hypothesis by a combination of structural and biochemical methods.
Our work provides the first structural analysis of any Nav β-subunit intracellular domain. Both the CD and NMR data indicate the β3 intracellular domain adopts a disordered conformation for the case of the free unassembled β3-subunit. However, the increase in α-helical content shown by intracellular domain peptides in the presence of 30% TFE suggests that the β3-intracellular domain also contains a motif that can undergo a selective disorder to order transition depending on the local microenvironment and in so doing generates a potential binding site. Such regions have been called molecular recognition features (MoRFs) and can play important roles in initiating protein-protein interactions (41). The short amphipathic α-helix within the β3 intracellular domain may represent another example of this behavior. Because β3-AP and β3-ΔSE mutants both destabilized fast inactivation, our data suggest that the interaction site encompasses both structural regions and is, therefore, likely to extend along most of the β3 intracellular domain.
In summary, we show that the β3-subunit can induce complex gating behavior in Nav1.3 by modulating the proportion of fast and slower inactivating channels. We further show that the β3 intracellular domain specifically influences fast inactivation with an unexpected subtlety that raises new questions concerning the regulation of sodium channel gating and its pathophysiological implications.
Supplementary Material
Acknowledgements
We thank Manoj Patel and Eddy Stevens for helpful comments on the manuscript.

The on-line version of this article (available at http://www.jbc.org) contains supplemental Table S1 and Figs. S1 and S2.
- TFE
- trifluoro-ethanol
- DQF COSY
- double-quantum filtered correlation spectroscopy
- TOCSY
- total correlation spectroscopy.
REFERENCES
- 1.Cusdin F. S., Clare J. J., Jackson A. P. (2008) Traffic 9, 17–26 [DOI] [PubMed] [Google Scholar]
- 2.Goldin A. L. (2001) Annu. Rev. Physiol. 63, 871–894 [DOI] [PubMed] [Google Scholar]
- 3.Isom L. L. (2001) Neuroscientist 7, 42–54 [DOI] [PubMed] [Google Scholar]
- 4.Yu F. H., Catterall W. A. (2003) Genome Biol. 4, 207. [DOI] [PMC free article] [PubMed] [Google Scholar]
- 5.Chen Y. H., Dale T. J., Romanos M. A., Whitaker W. R., Xie X. M., Clare J. J. (2000) Eur. J. Neurosci. 12, 4281–4289 [PubMed] [Google Scholar]
- 6.Morgan K., Stevens E. B., Shah B., Cox P. J., Dixon A. K., Lee K., Pinnock R. D., Hughes J., Richardson P. J., Mizuguchi K., Jackson A. P. (2000) Proc. Natl. Acad. Sci. U.S.A. 97, 2308–2313 [DOI] [PMC free article] [PubMed] [Google Scholar]
- 7.Shah B. S., Stevens E. B., Pinnock R. D., Dixon A. K., Lee K. (2001) J. Physiol. 534, 763–776 [DOI] [PMC free article] [PubMed] [Google Scholar]
- 8.Patton D. E., Isom L. L., Catterall W. A., Goldin A. L. (1994) J. Biol. Chem. 269, 17649–17655 [PubMed] [Google Scholar]
- 9.Beckh S., Noda M., Lübbert H., Numa S. (1989) EMBO J. 8, 3611–3616 [DOI] [PMC free article] [PubMed] [Google Scholar]
- 10.Shah B. S., Stevens E. B., Gonzalez M. I., Bramwell S., Pinnock R. D., Lee K., Dixon A. K. (2000) Eur. J. Neurosci. 12, 3985–3990 [DOI] [PubMed] [Google Scholar]
- 11.Black J. A., Cummins T. R., Plumpton C., Chen Y. H., Hormuzdiar W., Clare J. J., Waxman S. G. (1999) J. Neurophysiol. 82, 2776–2785 [DOI] [PubMed] [Google Scholar]
- 12.Dib-Hajj S. D., Fjell J., Cummins T. R., Zheng Z., Fried K., LaMotte R., Black J. A., Waxman S. G. (1999) Pain 83, 591–600 [DOI] [PubMed] [Google Scholar]
- 13.Takahashi N., Kikuchi S., Dai Y., Kobayashi K., Fukuoka T., Noguchi K. (2003) Neuroscience 121, 441–450 [DOI] [PubMed] [Google Scholar]
- 14.Craner M. J., Klein J. P., Renganathan M., Black J. A., Waxman S. G. (2002) Ann. Neurol. 52, 786–792 [DOI] [PubMed] [Google Scholar]
- 15.McCormick K. A., Isom L. L., Ragsdale D., Smith D., Scheuer T., Catterall W. A. (1998) J. Biol. Chem. 273, 3954–3962 [DOI] [PubMed] [Google Scholar]
- 16.Yu E. J., Ko S. H., Lenkowski P. W., Pance A., Patel M. K., Jackson A. P. (2005) Biochem. J. 392, 519–526 [DOI] [PMC free article] [PubMed] [Google Scholar]
- 17.Meadows L., Malhotra J. D., Stetzer A., Isom L. L., Ragsdale D. S. (2001) J. Neurochem. 76, 1871–1878 [DOI] [PubMed] [Google Scholar]
- 18.McCormick K. A., Srinivasan J., White K., Scheuer T., Catterall W. A. (1999) J. Biol. Chem. 274, 32638–32646 [DOI] [PubMed] [Google Scholar]
- 19.Sreerama N., Woody R. W. (2000) Anal. Biochem. 287, 252–260 [DOI] [PubMed] [Google Scholar]
- 20.Condreay J. P., Witherspoon S. M., Clay W. C., Kost T. A. (1999) Proc. Natl. Acad. Sci. U.S.A. 96, 127–132 [DOI] [PMC free article] [PubMed] [Google Scholar]
- 21.Munro S., Pelham H. R. (1986) Cell 46, 291–300 [DOI] [PubMed] [Google Scholar]
- 22.Hamill O. P., Marty A., Neher E., Sakmann B., Sigworth F. J. (1981) Pflugers Arch. 391, 85–100 [DOI] [PubMed] [Google Scholar]
- 23.Merrick E. C., Kalmar C. L., Snyder S. L., Cusdin F. S., Yu E. J., Sando J. J., Isakson B. E., Jackson A. P., Patel M. K. (2010) Pflugers Arch. 460, 743–753 [DOI] [PMC free article] [PubMed] [Google Scholar]
- 24.Chopra S. S., Watanabe H., Zhong T. P., Roden D. M. (2007) BMC. Evol. Biol. 7, 113. [DOI] [PMC free article] [PubMed] [Google Scholar]
- 25.Linding R., Jensen L. J., Diella F., Bork P., Gibson T. J., Russell R. B. (2003) Structure 11, 1453–1459 [DOI] [PubMed] [Google Scholar]
- 26.Romero P., Obradovic Z., Li X., Garner E. C., Brown C. J., Dunker A. K. (2001) Proteins 42, 38–48 [DOI] [PubMed] [Google Scholar]
- 27.Clark D. J., Hill C. S., Martin S. R., Thomas J. O. (1988) EMBO J. 7, 69–75 [DOI] [PMC free article] [PubMed] [Google Scholar]
- 28.Kim A. S., Kakalis L. T., Abdul-Manan N., Liu G. A., Rosen M. K. (2000) Nature 404, 151–158 [DOI] [PubMed] [Google Scholar]
- 29.Megy S., Bertho G., Kozin S. A., Debey P., Hoa G. H., Girault J. P. (2004) Protein Sci. 13, 3151–3160 [DOI] [PMC free article] [PubMed] [Google Scholar]
- 30.Schwarzinger S., Kroon G. J., Foss T. R., Chung J., Wright P. E., Dyson H. J. (2001) J. Am. Chem. Soc. 123, 2970–2978 [DOI] [PubMed] [Google Scholar]
- 31.Cummins T. R., Aglieco F., Renganathan M., Herzog R. I., Dib-Hajj S. D., Waxman S. G. (2001) J. Neurosci. 21, 5952–5961 [DOI] [PMC free article] [PubMed] [Google Scholar]
- 32.Meadows L. S., Chen Y. H., Powell A. J., Clare J. J., Ragsdale D. S. (2002) Neuroscience 114, 745–753 [DOI] [PubMed] [Google Scholar]
- 33.McEwen D. P., Meadows L. S., Chen C., Thyagarajan V., Isom L. L. (2004) J. Biol. Chem. 279, 16044–16049 [DOI] [PubMed] [Google Scholar]
- 34.Qu Y., Curtis R., Lawson D., Gilbride K., Ge P., DiStefano P. S., Silos-Santiago I., Catterall W. A., Scheuer T. (2001) Mol. Cell. Neurosci. 18, 570–580 [DOI] [PubMed] [Google Scholar]
- 35.Thomas P., Smart T. G. (2005) J. Pharmacol. Toxicol. Methods 51, 187–200 [DOI] [PubMed] [Google Scholar]
- 36.Shaw G., Morse S., Ararat M., Graham F. L. (2002) Faseb. J. 16, 869–871 [DOI] [PubMed] [Google Scholar]
- 37.Hakim P., Brice N., Thresher R., Lawrence J., Zhang Y., Jackson A. P., Grace A. A., Huang C. L. (2010) Acta Physiol. (Oxf). 198, 47–59 [DOI] [PMC free article] [PubMed] [Google Scholar]
- 38.West J. W., Patton D. E., Scheuer T., Wang Y., Goldin A. L., Catterall W. A. (1992) Proc. Natl. Acad. Sci. U.S.A. 89, 10910–10914 [DOI] [PMC free article] [PubMed] [Google Scholar]
- 39.Motoike H. K., Liu H., Glaaser I. W., Yang A. S., Tateyama M., Kass R. S. (2004) J. Gen. Physiol. 123, 155–165 [DOI] [PMC free article] [PubMed] [Google Scholar]
- 40.Spampanato J., Kearney J. A., de Haan G., McEwen D. P., Escayg A., Aradi I., MacDonald B. T., Levin S. I., Soltesz I., Benna P., Montalenti E., Isom L. L., Goldin A. L., Meisler M. H. (2004) J. Neurosci. 24, 10022–10034 [DOI] [PMC free article] [PubMed] [Google Scholar]
- 41.Mohan A., Oldfield C. J., Radivojac P., Vacic V., Cortese M. S., Dunker A. K., Uversky V. N. (2006) J. Mol. Biol. 362, 1043–1059 [DOI] [PubMed] [Google Scholar]
Associated Data
This section collects any data citations, data availability statements, or supplementary materials included in this article.