Abstract
Sterol regulatory element-binding protein-1 (SREBP-1) plays a central role in transcriptional regulation of genes for hepatic lipid synthesis that utilizes diet-derived nutrients such as carbohydrates and amino acids, and expression of SREBP-1 exhibits daily rhythms with a peak in the nocturnal feeding period under standard housing conditions of mice. Here, we report that the Srebp-1 expression rhythm shows time cue-independent and Clock mutation-sensitive circadian nature, and is synchronized with varied photoperiods apparently through entrainment of locomotor activity and food intake. Fasting caused diminution of Srebp-1 expression, while diabetic db/db and ob/ob mice showed constantly high expression with loss of rhythmicity. Time-restricted feedings during mid-light and mid-dark periods exhibited differential effects, the latter causing more severe damping of the oscillation. Therefore, “when to eat in a day (the light/dark cycle),” rather than “whenever to eat in a day,” is a critical determinant to shape the daily rhythm of Srebp-1 expression. We further found that a high-carbohydrate diet and a high-protein diet, as well as a high-fat diet, cause phase shifts of the oscillation peak into the light period, underlining the importance of “what to eat.” Daily rhythms of SREBP-1 protein levels and Akt phosphorylation levels also exhibited nutrient-responsive changes. Taken together, these findings provide a model for mechanisms by which time of day and nutrients in feeding shape daily rhythms of the Srebp-1 expression and possibly a number of other physiological functions with interindividual and interdaily differences in human beings and wild animals subjected to day-by-day changes in dietary timing and nutrients.
Keywords: Fatty Acid Synthase, Gene Regulation, Lipid Synthesis, Lipogenesis, Transcription Regulation, Triglyceride, Biological Clock, Circadian Rhythm, Nutrient
Introduction
The circadian timekeeping system for physiology and behavior in mammals consists of a whole-body network of cell-intrinsic oscillators that rely on activation/repression-alternating feedback loops of clock gene expression (1, 2). Daily expression rhythms of clock genes as oscillation generators are synchronized (entrained) to the light/dark cycle in the central pacemaker localized to the suprachiasmatic nucleus (SCN)3 of the hypothalamus, whereas they are predominantly entrained to the feeding/fasting cycle in other brain regions and peripheral organs (3–5). On the other hand, it is poorly understood how daily rhythms of a large number of physiological functions as oscillation outputs are shaped and coordinated with each other.
As a typical example of daily rhythms of liver functions exhibiting a wide spectrum of variety, we (6, 7) previously studied regulatory mechanisms for daily expression rhythms of the gene encoding Spot14 (8, 9) a regulatory protein stimulating lipid biosynthesis that is one of the most closely feeding-related functions in the liver. Because the Spot14 promoter is under the control (10) of sterol regulatory element-binding protein (SREBP)-1c (11, 12) a pivotal transcriptional regulator of genes for triglyceride synthesis, we here focused on Srebp-1 expression rhythms in the mouse liver.
The SREBP family consists of three isoforms SREBP-1a, SREBP-1c/ADD1, and SREBP-2, which are basic helix-loop-helix-leucine zipper transcription factors (12–14). SREBP-1a and SREBP-1c are products of the Srebp-1 gene with alternative usage of different 5′ exons 1a and 1c, respectively, while SREBP-2 derives from a separate gene. These isoforms preferentially activate different sets of genes: SREBP-1c, genes for triglyceride synthesis; SREBP-2, genes for cholesterol synthesis; and SREBP-1a, genes both for triglyceride and cholesterol synthesis (15). Precursor forms of SREBPs located to the endoplasmic reticulum membrane are converted to nucleus-targeted transcription factors through vesicle transport into the Golgi apparatus and succeeding two-step proteolytic cleavage, in response to sterol depletion for SREBP-1a and SREBP-2 (16), and to insulin stimulation for SREBP-1c (17).
The activity of SREBP-1c is regulated also at the transcriptional level: expression of the Srebp-1c gene is up-regulated by carbohydrate feeding (18), insulin (19, 20), and glucose (21) in the liver and/or cultured hepatocytes. Concordantly, Srebp-1c mRNA (22, 23) and SREBP-1 protein (23, 24) levels exhibit daily rhythms with a peak during the feeding period, i.e. the dark period in the liver of nocturnal mice fed with standard chows. Here, we at first characterized general features of daily Srebp-1 expression rhythms, which exhibited time cue-independent and Clock mutation-sensitive circadian nature, entrainability to various photoperiods, and fasting- and diabetes-labile damping. We further showed that “when to eat in a day (the light/dark cycle)” under time-restricted feeding conditions and “what to eat” with chows varied in the composition of three major nutrients are principle determinants in shaping the Srebp-1 expression rhythm and possibly a number of other physiological rhythms.
EXPERIMENTAL PROCEDURES
Animals
Male C57BL/6J, BKS.Cg-m+/+Leprdb/J (db/db) and B6.V-Lepob/J (ob/ob) mice were purchased from Clea Japan (Tokyo, Japan). Clock mutant C57BL/6J mice were purchased from Jackson Laboratory (stock No. 002923; Bar Harbor, ME) and interbred in Waseda University. Mice were maintained on a 12-h light/12-h dark cycle (12:12LD) at a room temperature of 23 ± 1 °C and given food and water ad libitum, otherwise noted. Lights-on time was assigned Zeitgeber time (ZT) 0. After entrainment under this condition at least for 2 weeks, constant darkness (DD) experiments were carried out, and the date of transferring mice into DD was defined as Day 1, the beginning of which was assigned circadian time (CT) 0. To assess effects of varied photoperiod lengths and restricted feeding, mice were entrained to the shifted conditions at least for 10 days. For varied nutrient conditions, mice were maintained on altered diets for 7 days. The diets contained three major nutrients in following approximate weight ratios: standard diet, 63% carbohydrate, 5% fat, and 32% protein (CE-2, Clea Japan); high carbohydrate diet, 93% carbohydrate (starch and sugar), 7% lipid, and 0% protein (prepared by Oriental Yeast, Tokyo, Japan); high fat diet, 34% carbohydrate, 37% fat, and 29% protein (High Fat Diet 32, Clea Japan); and high protein diet, 24% carbohydrate, 7% lipid, and 69% protein (casein) (prepared by Clea Japan). Animal care and experiments were in accordance with the Regulations for Animal Experimentation at Chiba University, and under the permission of the Experimental Animal Welfare Committee of Waseda University.
Northern Blot Analysis
Total RNA was isolated from the liver of mice by the acid-guanidine thiocyanate-phenol/chloroform extraction procedure (25) or with TRIzol reagent (Invitrogen, Carlsbad, CA). RNAs were electrophoresed in denaturing formaldehyde-agarose (1%) gels. After visualizing 28 S and 18 S rRNAs by ethidium bromide staining to check the integrity of RNA samples and equal loading, the RNA was blotted onto Nytran N membranes (Whatman, Sanford, ME). Digoxigenin-labeled RNA probes were synthesized using a transcription kit (Roche Diagnostics, Mannheim, Germany) from DNA sequences for Srebp-1 (accession NT_096135.5 nt. 25,518,299-25,528,799 without introns), Dbp (accession NM_012543 nt. 368–1348), and Rev-erbα (GenBankTM accession NT_165773.2 nt. 10,170,543–10,171,393). Hybridization, washing, and chemiluminescence detection were done as recommended by Roche Diagnostics. Direct quantification of digitally recorded images or densitometric quantification following detection on x-ray films was performed by using CS Analyzer version 3.0 (Atto, Tokyo, Japan).
Western Blot Analysis
Rabbit polyclonal anti-mouse SREBP-1 antibody was raised against the mixture of peptides NH2-C+INNQDSDFPGLFDA-COOH and NH2-C+AQSRGEKRTAHNAI-COOH. Antibodies anti-phospho-Akt (Ser-473) (sc-7985-R), anti-Akt (sc-1619), and anti-GAPDH (sc-25778) were purchased from Santa Cruz Biotechnology (Santa Cruz, CA). Frozen liver tissue (∼0.3 g) was homogenized by sonication in 1 ml of RIPA buffer (Santa Cruz Biotechnology), which was supplemented with phosphatase inhibitors (PhosSTOP, Roche Diagnostics) for detection of phosphorylated proteins. Aliquots of the homogenates were mixed with the same amount of sample buffer (10% glycerol, 1.8% β-mercaptoethanol, 4.0% SDS, 125 mm Tris-HCl (pH 6.7), 0.006% bromphenol blue), and boiled at 100 °C for 3 min. After an electrophoretic run in 9.5% polyacrylamide/SDS gels, proteins were electroblotted on nitrocellulose membranes (Advantec, Tokyo, Japan). The membrane was pretreated in 5% blocking reagent (Roche Diagnostics), incubated with primary antibody, and further incubated with peroxidase-conjugated secondary antibody. Chemiluminescent signals were visualized with ImmunoStar reagent (Wako, Osaka, Japan), and quantification of signal intensities was performed by using CS Analyzer version 3.0. Quantified results were normalized to GAPDH levels.
Quantitative RT-PCR
100 ng of total RNA was reverse-transcribed with High Capacity cDNA Reverse Transcription kit (Applied Biosystems). Specific primer pairs were designed as follows: SREBP-1a forward (104 bp product), 5′-CGGCTCTGGAACAGACACTG-3′; SREBP-1c forward (103 bp product), 5′-ATCGGCGCGGAAGCTGTCGG-3′; SREBP-1 reverse for both SREBP-1a and -1c, 5′-GAAGTCACTGTCTTGGTTGTTG-3′ (11). Real-time quantitative PCR analysis was performed with Mx3000P CYBR green system and MxPro software (Stratagene, La Jolla, CA). PCR was performed under the following conditions: 1st step of 95 °C for 5 min, and 2nd step of 95 °C for 5 s and 61 °C for 30 s (42 cycles).
Assessment of Locomotor Activity and Food Intake Rhythms
A mouse was housed individually in a transparent plastic cage (10 × 20 × 18.5 cm) equipped with a thermal-radiation motion detector (NeuroSience, Tokyo, Japan) located above the cage, and with a feeding box harboring a scale with an undertray for collecting spillage (FDM-300s, Melquest, Toyama, Japan). Locomotor activity was continuously recorded every 1 min on a computer, and analyzed using ClockLab software (Actimetrics, Evanston, IL). Food intake was continuously recorded every 15 min on a computer, and analyzed using FDMWIN software (Melquest).
Statistical Analysis
The values were expressed as mean ± S.E. Rhythmicity was tested by 1-way analysis of variance (ANOVA), and p values 0.05 or less were considered statistically significant.
RESULTS
Daily Rhythms of Srebp-1c Expression in the Mouse Liver
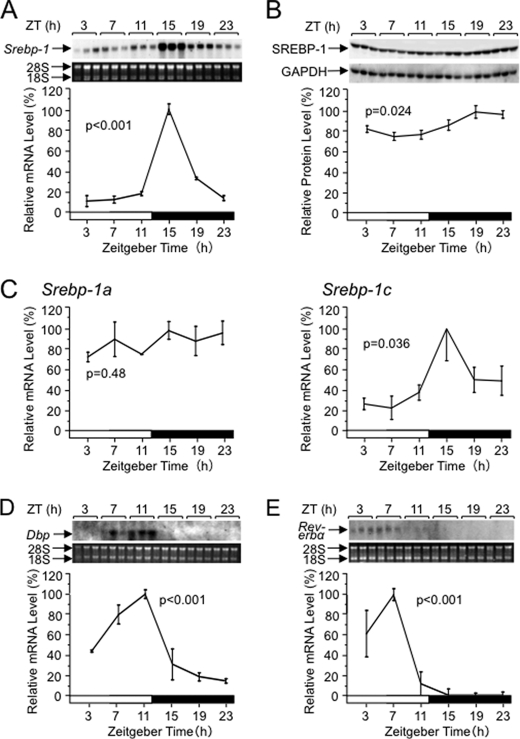
As shown in Fig. 1A, male wild-type C57BL/6 mice, which were kept under a 12-h light/12-h dark cycle (12:12LD, working as “Zeitgeber”) with free access to chow, exhibited a daily rhythm of Srebp-1 mRNA levels with a peak at Zeitgeber time (ZT) 15, an early dark period when mice start feeding. SREBP-1 mature protein levels also showed the rhythmicity with a peak at ZT19 (Fig. 1B). Because the Srebp-1 probe for the Northern analysis and the SREBP-1 antibody for the Western analysis could not discriminate between products of Srebp-1a and Srebp-1c genes having different 5′ exons 1a and 1c, respectively, that are spliced to the common exon 2 (11, 12), we performed real-time RT-PCR analysis using specific primers distinguishing them (Fig. 1C). Whereas Srebp-1a mRNA levels did not, Srebp-1c mRNA levels did show the daily rhythm, which resembles that detected by the Northern analysis (Fig. 1A). Combined with the previous observation that Srebp-1c mRNA is about 9-fold abundant compared with Srebp-1a mRNA in the mouse liver (11), we concluded that the daily rhythm of Srebp-1(a+c) mRNA levels (Fig. 1A) is mainly attributable to that of Srebp-1c mRNA. mRNA levels of clock-related genes Dbp (Fig. 1D) and Rev-erbα (Fig. 1E) showed daily rhythms comparable with those in previous reports (26, 27), confirming appropriately-controlled clocks in these mice. Because the standard error in the Northern analysis (Fig. 1A) is smaller than that in the real-time RT-PCR analysis (Fig. 1C, right panel), we mainly carried out the Northern analysis to examine the rhythmicity of Srebp-1 mRNA levels in the following experiments. Daily rhythms of SREBP-1 protein (23, 24) and Srebp-1c mRNA (22, 23) levels have been reported in previous works, and their profiles are apparently concordant with the present results.
FIGURE 1.
Daily rhythms of Srebp-1 mRNA (A) and protein (B) levels, differential Srebp-1a and Srebp-1c mRNA levels (C), and mRNA levels of clock-related genes Dbp (D) and Rev-erbα (E) in the mouse liver. Male wild-type C57BL/6 mice were housed in a 12-h light/12-h dark cycle (12:12LD, light/dark periods are represented by open/solid boxes) with feeding ad libitum for at least 2 weeks. Livers were excised at 4-h intervals from 3 mice at each time point and subjected to preparation of total RNA and whole tissue extracts. A, D, and E, Northern blot analysis of total RNA for detection of mRNAs of Srebp-1, Dbp (reproduced partly from Ref. 6), and Rev-erbα, respectively. A chemiluminogram for detection of each mRNA is shown along with ethidium bromide staining for 28 S and 18 S rRNAs. Below, quantified results for each mRNA level are presented. B, Western blot analysis of liver extracts. Chemiluminograms for detection of SREBP-1 and GAPDH are shown. Below, quantified results for SREBP-1 levels (normalized to GAPDH levels) are represented. C, quantitative reverse transcription PCR analysis. Srebp-1a and Srebp-1c mRNA levels were differentially measured using forward primers each specific to alternative first exons as described under “Experimental Procedures.” All quantified mRNA or protein levels relative to the maximum value (100%) are represented as mean ± S.E. p values for rhythmicity were assessed by 1-way ANOVA test.
Circadian Profiles of Srebp-1 Expression in Constant Darkness
To examine if the Srebp-1 expression shows a circadian rhythm independent of environmental cues, we examined the rhythmicity in constant darkness. Under the ad libitum feeding condition (Fig. 2A), Srebp-1 mRNA levels showed a rhythm with a peak at circadian time (CT) 15, in accordance with the peak at ZT15 in the 12:12LD cycle (Fig. 1A). Under the fasting condition (Fig. 2B), overall levels of Srebp-1 mRNA were dramatically lowered (down to ∼2% in the peak level compared with ad libitum feeding). This made it difficult to examine the rhythmicity quantitatively. Seemingly, however, the peak phase was forward-shifted to CT7-11 by the fasting, concordant with previous reports for general phase advance of rhythmic gene expression by the fasting (6, 28). Taken together, persistence of the circadian rhythm of Srebp-1 mRNA levels in constant darkness suggested involvement of the biological clock in regulation of Srebp-1 expression, while robust rhythmicity of the expression required food intake.
FIGURE 2.
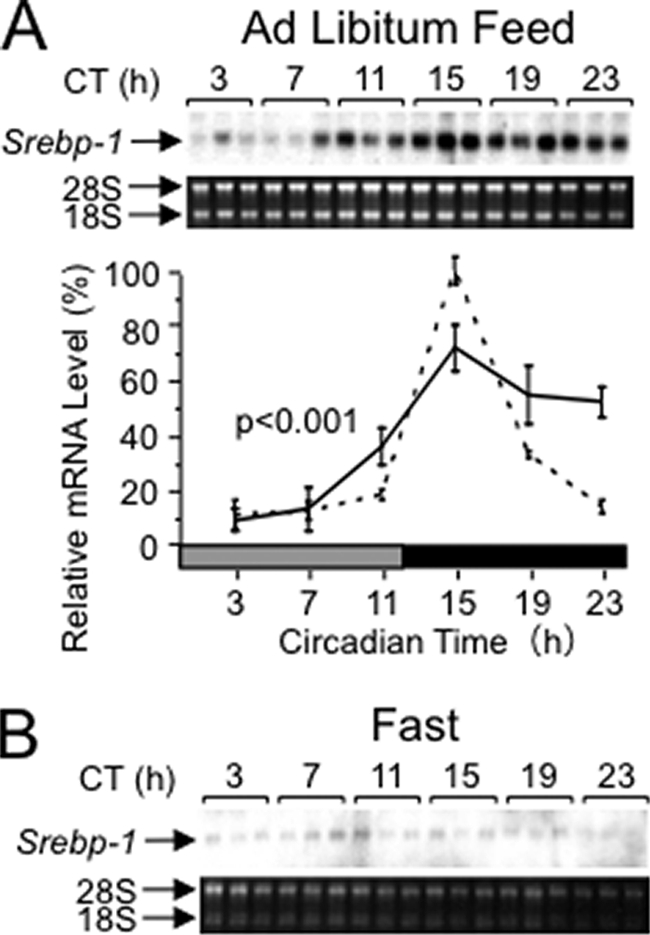
Circadian rhythms of Srebp-1 mRNA levels in constant darkness under the conditions of ad libitum feeding (A) and fasting (B). Male wild-type C57BL/6 mice were housed in 12:12LD with feeding ad libitum for at least 2 weeks and transferred to constant darkness on Day 1 (the subjective day is represented by the hatched box). For fasting, mice were food-depleted at CT11 of Day 1. Total RNA was prepared from the liver of mice at 4-h intervals on Day 2, and subjected to Northern analysis for measuring Srebp-1 mRNA levels, as described in the legend of Fig. 1. The broken line represents the 12:12LD/ad libitum feeding results reproduced from Fig. 1A, for comparison.
Disorder of the Daily Rhythm of Srebp-1 Expression in Clock Mutant Mice
Involvement of the clock gene in Srebp-1 expression was examined with mice harboring Clock mutation that yields a splice variant for a dominant-negative form of CLOCK protein (29). Clock mutant mice showed no apparent daily rhythm of Srebp-1 mRNA levels (Fig. 3A). On the fasting condition (Fig. 3B), Srebp-1 mRNA levels were under the detectable level. Therefore, the intact Clock gene is required for the rhythmic expression of the Srebp-1 gene in the ad libitum feeding, and apparently even for the basal-level expression in the fasting. It remains to be clarified whether clock proteins directly interact with Srebp-1c regulatory regions in hepatocytes, while a ∼13-kb-upstream Srebp-1a regulatory region was reported to be directly bound by the CLOCK dimerization partner BMAL1 in adipocytes (30).
FIGURE 3.
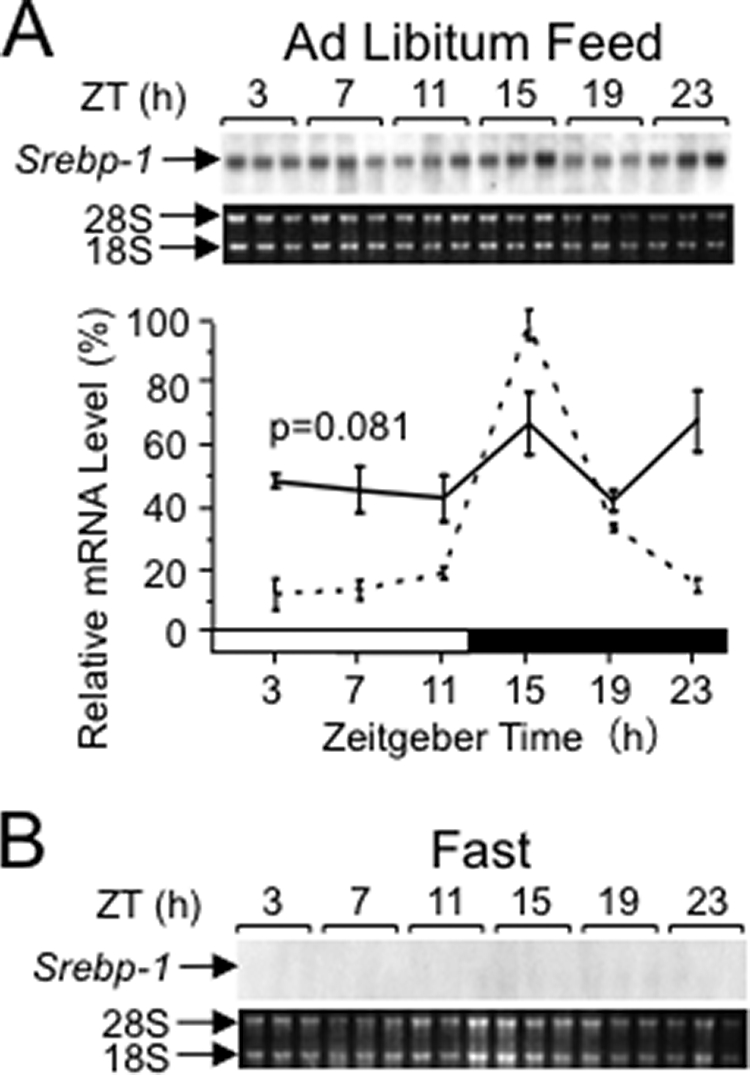
Loss of daily rhythms of Srebp-1 expression in Clock mutant mice under the conditions of ad libitum feeding (A) and fasting (B). Male Clock mutant (mutation-homozygous) mice were housed in a 12:12LD with feeding ad libitum for at least 2 weeks. For fasting, mice were food-depleted at ZT9 (Day 0). Total RNA was prepared from the liver of mice at 4-h intervals on Day 2, and subjected to Northern analysis for measuring Srebp-1 mRNA levels, as described in the legend of Fig. 1. The broken line represents the wild-type 12:12LD/ad libitum results reproduced from Fig. 1A, for comparison.
Effects of Varied Photoperiods on Srebp-1 Expression
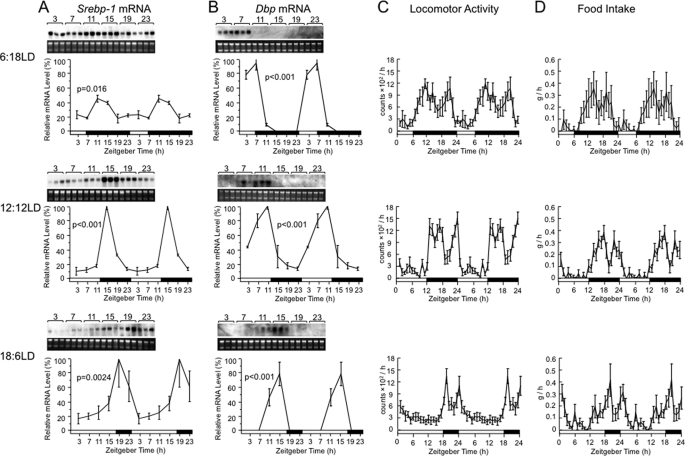
We examined if Srebp-1 expression is entrained to two varied photoperiods, the 6-h light/18-h dark cycle (6:18LD) and 18-h light/6-h dark cycle (18:6LD) (Fig. 4). In 6:18LD, the Srebp-1 expression rhythm was phase-advanced compared with that in 12:12LD with apparent reduction in its magnitude and amplitude (Fig. 4A). On the other hand, in 18:6LD, the Srebp-1 expression rhythm was phase-delayed. Therefore, Srebp-1 expression is entrained to the varied photoperiods. To gain an insight into mechanism of the light entrainment of Srebp-1 expression, we examined rhythmicity of several parameters (Fig. 4, B–D). As we reported previously (6) and reproduced here, expression rhythm of the clock-related gene Dbp showed phase shifts toward the same directions as those of the Srebp-1 expression rhythm (Fig. 4B). We also examined rhythms of locomotor activity (Fig. 4C) and food intake (Fig. 4D), both of which showed apparent phase advance and delay, respectively, in 6:18LD and 18:6LD, compared with those in 12:12LD. These results are concordant with the notion that the varied photoperiods entrain locomotor activity and then food intake, which in turn entrains clock gene expression in the liver. Resultant in-phase food-derived nutrients and clock proteins are likely to drive cooperatively phase shifts of the Srebp-1 expression rhythm. On the other hand, damping of amplitude of the Srebp-1 expression rhythm in 6:18LD may be attributable to prolonged feeding in the longer dark period.
FIGURE 4.
Effects of varied photoperiods on rhythms of Srebp-1 expression and behavior. Male wild-type C57BL/6 mice were housed in 6:18LD (upper panels), 12:12LD (middle panels), or 18:6LD (lower panels) with feeding ad libitum. Rhythms of Srebp-1 (A) and Dbp (B) mRNA levels in a day were examined by Northern analysis, as described in the legend of Fig. 1, for total RNA prepared from the liver of mice housed in each photoperiod for at least 10 days. Quantified data for 1 day were plotted twice to cover a 2-day span. Data for 12:12LD in (A) and (B) are reproduced from Fig. 1, A and D, respectively. Daily rhythms of locomotor activity (C) and food intake (D) were examined, as described under “Experimental Procedures,” on Days 14 and 18 after the photoperiod shift on Day 1. Data are expressed as mean ± S.E. (6 animals, n = 12), and plotted twice.
Disorder in the Daily Rhythm of Srebp-1 Expression in db/db and ob/ob Mice
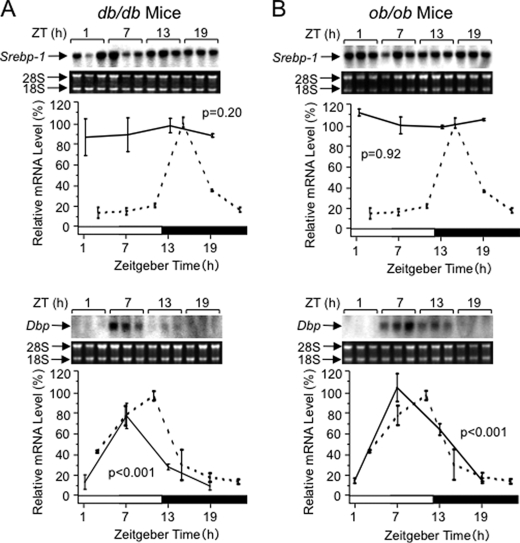
Nutrients exhibit profound effects on Srebp-1c expression in a direct and/or hormone-mediated manner (18–21). Concordantly, fasting severely affected magnitude of Srebp-1 expression, and apparently also its rhythmicity (Fig. 2B). Here we examined the rhythmicity in ob/ob and db/db mice (Fig. 5), which lack the functional leptin (31) and its receptor (32, 33), respectively, and which exhibit a similar phenotype, i.e. hyperglycemia-associated hyperinsulinemia. In livers of both db/db (Fig. 5A, upper panel) and ob/ob mice (Fig. 5B, upper panel), the Srebp-1 mRNA levels were constantly high at any time point, and the daily rhythms were lost. On the other hand, rhythmicity of Dbp expression was saved relatively well in both strains (Fig. 5, A and B, lower panels). These results are concordant with the notion that strong activation of the Srebp-1 gene by glucose and insulin (19–21) specifically obscured the rhythmicity of Srebp-1 expression.
FIGURE 5.
Loss of daily rhythms of Srebp-1 expression in db/db (A) and ob/ob mice (B). Total RNA was prepared at 6-h intervals from the liver of male mice housed in 12:12LD under ad libitum feeding condition for at least 2 weeks, and subjected to Northern analysis for measuring Srebp-1 and Dbp mRNA levels, as described in the legend of Fig. 1. The broken lines for comparison represent the results reproduced from Fig. 1.
Differential Effects of the Feeding Period and the Light/Dark Cycle on Srebp-1 Expression
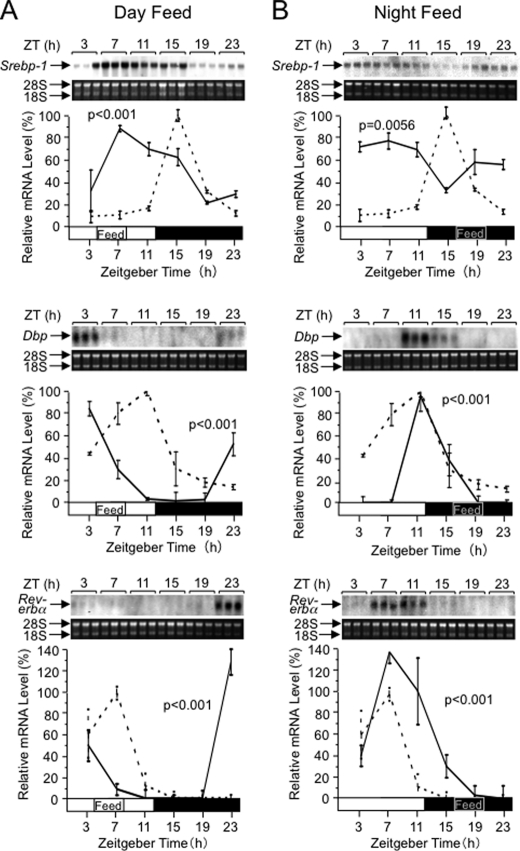
To examine effects of the feeding period separately from those of the light/dark cycle, we carried out time-restricted feeding experiments. When we provided mice with chow only during the central 4 h (ZT4–8) of the light period, the Srebp-1 expression rhythm was phase-advanced and showed a peak at ZT7 with an prolonged shoulder (Fig. 6A, upper panel) compared with the sharp peak at ZT15 under ad libitum feeding (Fig. 1A). Interestingly, under the restricted feeding during the central 4 h (ZT16–20) of the dark period (Fig. 6B, upper panel), the Srebp-1 expression rhythm exhibited an unexpected profile, i.e. damping of the rhythmicity with a short trough at ZT15. As for the clock-related genes Dbp and Rev-erbα, their expression rhythms exhibited remarkable phase advance and slight phase delay in the midday- and midnight-fed mice, respectively (Fig. 6, middle and lower panels), concordant with previous reports for predominant entraining effects, especially, of daytime-restricted feeding on expression rhythms of clock genes in the liver (3–5). The more prominent effect of the midday-restricted feeding than the midnight-restricted feeding on phase shift of the Dbp and Rev-erbα expression rhythms can be accounted for by more distant shift of feeding onset under the midday-restricted feeding (8 h) than the midnight-restricted feeding (4 h) from the darkness onset (ZT12)-triggered feeding start point in ad libitum feeding. On the other hand, the substantial effect of the midnight-restricted feeding on the Srebp-1 expression (Fig. 6B, upper panel) indicates that mechanisms governing daily expression rhythms of the metabolically responsive gene Srebp-1 are different from those of clock-related genes. Furthermore, the marked difference in profiles of Srebp-1 expression rhythms between midday- and midnight-restricted feeding shows that when to take foods in a day (the light/dark cycle) profoundly affects the rhythm profile, and suggests that light/dark cycle-entrained SCN-driven signals, as well as feeding-driven signals, substantially affects the daily Srebp-1 expression rhythm in the liver. Remarkably, previous studies (6, 24) noted damping of expression rhythms of candidate SREBP-1 target genes in midnight-restricted feeding, while quantitative analysis for related Srebp-1 expression rhythms has remained to be performed.
FIGURE 6.
Effects of time-restricted feeding in the middle of the light or dark period on Srebp-1 expression. Male wild-type C57BL/6 mice were housed under 12:12LD with feeding restricted to 4 h in the middle of light (A) or dark (B) period for at least 10 days. Daily rhythms of hepatic Srebp-1 (upper panels), Dbp (middle panels), and Rev-erbα (lower panels) mRNA levels were examined by Northern analysis, as described in the legend of Fig. 1. The broken lines for comparison represent the results reproduced from Fig. 1.
Effects of Nutrient Variations on Srebp-1 Expression
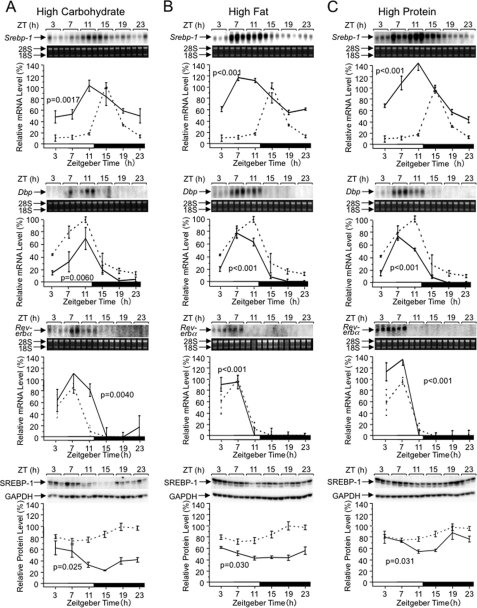
We examined if the Srebp-1 expression rhythm is affected by various diets (Fig. 7) enriched in one of three major nutrients, i.e. carbohydrate (Fig. 7A), fat (Fig. 7B), and protein (Fig. 7C). Concordant with the previous study (22), the high fat diet caused phase advance of the Srebp-1 expression rhythm (Fig. 7B, top panel). Interestingly, the high carbohydrate (Fig. 7A, top panel) and high protein (Fig. 7C, top panel) diets also caused phase advances of the Srebp-1 expression rhythm with a shifted peak in the light period. On the other hand, effects of varied diets on Dbp and Rev-erbα expression rhythms are limited (Fig. 7, second and third panels from the top): marginal phase advances of Dbp expression rhythms are observed with high fat and high protein diets. Therefore, nutrient variations affect the expression rhythm of Srebp-1 more prominently than that of the clock-related genes. While a recent work (23) showed aberration of the Srebp-1c expression rhythm in the liver of Rev-erbα-disrupted mice, roles of Rev-erbα seems limited in the nutrient variation-responsive phase shifts of the Srebp-1 expression rhythm, possibly reflecting characteristic features of Rev-erbα as a core clock component (26) and as a time keeper of bile acid synthesis (23, 34) that should be tightly linked to major feeding onset timing irrespective of nutritional variations.
FIGURE 7.
Effects of varied nutrient compositions on Srebp-1 expression. Male wild-type C57BL/6 mice were fed ad libitum with a standard chow in 12:12LD for at least 2 weeks, and then fed with various chows enriched in carbohydrate (A), fat (B), and protein (C) for 7 days. Daily rhythms of hepatic Srebp-1 (top panels), Dbp (second panels from the top) and Rev-erbα (third panels from the top) mRNA levels were examined by Northern analysis, and those of SREBP-1 protein levels (bottom panels) by Western analysis, as described in the legend of Fig. 1. The broken lines for comparison represent the results reproduced from Fig. 1.
We also examined effects of varied nutrients on the rhythmicity of SREBP-1 protein levels (Fig. 7, bottom panels). The high carbohydrate diet, high fat diet, and high protein diet brought about elevation of the SREBP-1 protein levels at ZT3–7, ZT23–3, and ZT19–3, respectively. These results could not de expected from corresponding rhythms of Srebp-1 mRNA levels (Fig. 7, top panels), since changes in protein levels typically follow those in mRNA levels with time-lag of several hours. However, the results were not necessarily surprising, referring to previous observations that protein levels of SREBPs are regulated also at steps of proteolytic maturation (15, 35) and ubiquitination-dependent degradation (36–38) in response to nutritional and hormonal changes. It is also noteworthy that SREBP-1c binds and activates its own Srebp-1c promoter (39, 40), and then daily rhythms of Srebp-1c mRNA and protein levels may affect each other in a complicated manner.
Because SREBP-1c is activated predominantly by insulin through the phosphoinositide 3-kinase and Akt/protein kinase B pathway at the step of transcription of the Srebp-1c gene (41–43) as well as the step of proteolytic processing of the SREBP-1c precursor protein (44), we investigated possible relevance of this pathway in nutrient-responsive changes in the rhythmicity of Srebp-1 mRNA and protein levels, by examining the active phosphorylated form of Akt (Fig. 8). With the standard diet, levels of phospho-Ser473-Akt (pAkt) showed no significant daily rhythm, but tendency for elevation during the early dark period. The high carbohydrate diet and high fat diet brought about daily rhythms with a peak at ZT3, and the high protein diet with a peak at ZT19–23. These peak periods largely coincided with those of SREBP-1 protein rhythms (Fig. 7, bottom panels) and preceded those of Srebp-1 mRNA levels (Fig. 7, top panels). Assuming that maturation of SREBP-1 in response to pAkt is rapid, and that Srebp-1 mRNA accumulation following transcriptional activation by pAkt requires a lag of several hours, these results are concordant with the notion that pAkt can be involved in the regulation of Srebp-1 mRNA and protein levels in response to nutrient variation. However, much work remains to be performed to test this possibility. In our preliminary observations (data not shown), the high-fat diet, but not high-carbohydrate and high-protein diets, increased calorie intake, and the high-carbohydrate and high-fat diets, but not high-protein diet, raised light-period/dark-period ratio of food intake, compared with the standard diet. All taken together, mechanisms for varied diet-induced phase shifts of the Srebp-1 expression rhythms may be different from one another, and wait to be further investigated.
FIGURE 8.
Effects of varied nutrient compositions on phospho-Ser473-Akt (pAkt) levels. Male wild-type C57BL/6 mice were fed with each chow as described in the legend of Fig. 7. Daily rhythms of hepatic pAkt and total Akt levels were examined by Western analysis, as described in the legend of Fig. 1. When appropriate, blotted filters were reprobed with other antibodies, and then GAPDH data were shared in some of the experiments from Figs. 7 and 8.
DISCUSSION
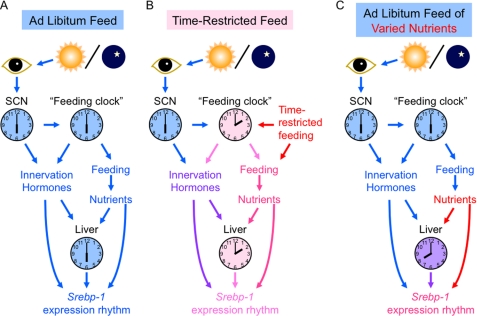
Results of this work led us to hypothesize about mechanisms of daily regulation of Srebp-1 expression, as illustrated in Fig. 9. The schema for ad libitum feeding of the standard diet (Fig. 9A) was drawn from the observations that the Srebp-1 expression rhythm showed circadian nature (Fig. 2) susceptible to Clock mutation (Fig. 3), and that varied photoperiods entrained the Srebp-1 expression rhythm as well as daily rhythms of locomotor activity, food intake and the clock-related gene expression in the liver (Fig. 4). In Fig. 9A, the light-entrainable central clock, which is located in the SCN and adjusted everyday by light/dark cues conveyed from the eye (45), synchronizes phases of a number of other clocks including the putative “feeding clock” responsible for feeding behavior and physiology (3–5). Feeding-associated factors such as nutrients entrain the circadian clock of the liver, in phase with neuronal and hormonal factors under the control of the SCN and the “feeding clock.” All together, nutrients, the liver clock oscillator, and neuronal/hormonal factors in phase cooperate to bring about robustly rhythmic expression of the Srebp-1 gene.
FIGURE 9.
Schematically represented hypothesis for regulatory mechanisms of daily rhythms of Srebp-1 expression. A, coordination of multiple factors for the Srebp-1 expression under ad libitum feeding of the standard diet. Light/dark cues are conveyed from the eye to the SCN, and therein adjust the light-entrainable oscillator, which in turn synchronizes phases of a number of other clocks including the putative “feeding clock.” Feeding-derived nutrients entrain the circadian clock in the liver, in phase with neuronal and hormonal factors. Thus, all of these in-phase nutrients, liver clock oscillator, and neuronal/hormonal factors regulate the Srebp-1 expression in a coordinated manner. B, “when to eat in a day (the light/dark cycle)” as a major determinant of Srebp-1 expression rhythms under time-restricted feeding. Food intake, when separated from the SCN-governed feeding command, plays a predominant role in entraining the feeding clock as well as the liver clock. The Srebp-1 expression is regulated cooperatively by nutrients and the almost in-phase liver clock oscillator, but is also affected by out-of-phase neuronal and hormonal factors under the control of the light-entrained SCN. Therefore, timing for feeding in the light/dark cycle, namely, “when to eat in a day” is crucial for the Srebp-1 expression rhythm. C, “what to eat” as a substantial regulator of the Srebp-1 expression rhythm. Diets varied in compositions of three major nutrients, i.e. carbohydrate, fat, and protein, exhibit moderate effects on clock gene expression in the liver, and more profound effects on expression rhythms of metabolism-regulating genes such as Srebp-1. Effects of varied nutrients on the SCN clock and the feeding clock can be different from one another, but at any rate seem limited. Therefore, neuronal and hormonal factors under the control of these systemic clocks affect the Srebp-1 expression rhythm apparently in conflict with the nutrients.
Under time-restricted feeding (Fig. 9B), food intake entrains clocks of most peripheral tissues and even of most brain regions besides the SCN more strongly than the light/dark cues do (3–5). A typical example of the brain food-entrainable oscillator constituting at least a part of the “feeding clock” is located in the dorsomedial hypothalamic nucleus, which is responsible for food-anticipatory behavior under the restricted feeding (46, 47) though controversial (48). Food intake also entrains clocks of peripheral organs including the liver. These food-entrained clocks are desynchronized from the light-entrained clock of the SCN (3–5). The food-entrained clock in the liver regulates Srebp-1 expression in cooperation with almost in-phase factors such as nutrients. On the other hand, SCN-governed relatively out-of-phase factors likely affect also the Srebp-1 expression, as typically remarked under 4-h restricted feeding in the dark period compared with that in the light period (Fig. 6B). Namely, daytime and nighttime feeding differentially affect food-entrainable rhythmicity of Srebp-1 expression. Thus, “when to eat in a day (the light/dark cycle),” rather than “whenever to eat in a day,” is an essential determinant of daily rhythms of Srebp-1 expression. Constantly high-level Srebp-1 expression lacking apparent rhythmicity in db/db and ob/ob mice (Fig. 5) may reflect attenuated feeding rhythmicity accompanied by arrhythmic locomotion (49), though this view remains to be verified.
As for diets with varied nutritional compositions (Fig. 9C), their effects on the systemic daily rhythms such for locomotor activity and feeding may be different from one another, but in any way seem limited (Refs. 22, 50 for a high-fat diet).4 In accordance, their effects on daily expression rhythms of clock-related genes in the liver are marginal (Fig. 7, second and third panels from the top, and Refs. 22, 50), but those on the Srebp-1 expression rhythm were dramatic (Fig. 7, top panels). Concordant with the previous report (22), the high-fat diet caused phase advance of the Srebp-1 mRNA rhythm. Furthermore, we found that the high-carbohydrate and high-protein diets also caused phase advance of the Srebp-1 mRNA rhythm with a shifted peak in the light period. Aberrations in daily rhythms of SREBP-1 protein levels were also observed (Fig. 7, bottom panels). Therefore, “what to eat” affects the daily rhythm of Srebp-1 expression profoundly, while its effect on clock-related gene expression is modest. Plausible explanation for these differential effects of varied nutrients is as follows: daily oscillation of clock gene expression in the liver is relatively resistant to nutrient changes, in order to keep time for feeding behavior-associated liver functions that must be entrained to the feeding period; on the other hand, the daily expression rhythm of Srebp-1, one of the most pivotal genes in metabolic regulation, likely requires to be modulated sensitively in response to nutrient variations. Taken together, views in Fig. 9, B and C, provide a model for mechanisms by which time of day and nutrients in feeding shape daily rhythms of a number of physiological functions with interindividual and interdaily differences in human beings and wild animals subjected to day-by-day changes in dietary timing and nutrients.
Interestingly, all three nonstandard diets used in this study caused phase shift of the Srebp-1 expression rhythm. Because SREBP-1 is an activator of genes involved in fatty acid biosynthesis utilizing diet-derived nutrients such as carbohydrates and carbon skeletons of amino acids, the Srebp-1 expression profile with rapid increase in the early dark (feeding) period on the standard diet appears reasonable or “normal,” compared with “abnormal” profiles on the varied diets. We can rationalize that the “standard” diet has been empirically selected referring to animal health conditions such as growth rate, fertility, and longevity. It is tempting to speculate that “standard” diet-driven “normal” daily expression rhythms of metabolism-regulating genes such as Srebp-1 are prerequisite for animal health. On the other hand, further investigation into formation mechanisms and biological meanings of the varied diet-driven “abnormal” profiles will give insights into mechanisms for adaptation of lipogenesis to nutritional changes.
Acknowledgments
We thank H. Sugiyama and Y. Tamura for advice in statistical analysis, A. Oohira for help in sequence analysis, and members of our laboratories for suggestions, help, and discussions.
This work was supported in part by Grant-in-Aid (18300228) for Scientific Research from the Ministry of Education, Culture, Science, Sports and Technology (MEXT) of Japan, and Grant from Fuji Foundation for Protein Research.
E. Matsumoto, A. Ishihara, S. Tamai, A. Nemoto, K. Iwase, T. Hiwasa, S. Shibata, and M. Takiguchi, unpublished data.
- SCN
- suprachiasmatic nucleus
- SREBP
- sterol regulatory element-binding protein
- LD
- light/dark
- ZT
- Zeitgeber time
- CT
- circadian time
- pAkt
- phospho-Ser473-Akt.
REFERENCES
- 1.Green C. B., Takahashi J. S., Bass J. (2008) Cell 134, 728–742 [DOI] [PMC free article] [PubMed] [Google Scholar]
- 2.Reppert S. M., Weaver D. R. (2002) Nature 418, 935–941 [DOI] [PubMed] [Google Scholar]
- 3.Damiola F., Le Minh N., Preitner N., Kornmann B., Fleury-Olela F., Schibler U. (2000) Genes Dev. 14, 2950–2961 [DOI] [PMC free article] [PubMed] [Google Scholar]
- 4.Hara R., Wan K., Wakamatsu H., Aida R., Moriya T., Akiyama M., Shibata S. (2001) Genes Cells 6, 269–278 [DOI] [PubMed] [Google Scholar]
- 5.Stokkan K. A., Yamazaki S., Tei H., Sakaki Y., Menaker M. (2001) Science 291, 490–493 [DOI] [PubMed] [Google Scholar]
- 6.Ishihara A., Matsumoto E., Horikawa K., Kudo T., Sakao E., Nemoto A., Iwase K., Sugiyama H., Tamura Y., Shibata S., Takiguchi M. (2007) J. Biol. Rhythms 22, 324–334 [DOI] [PubMed] [Google Scholar]
- 7.Sakao E., Ishihara A., Horikawa K., Akiyama M., Arai M., Kato M., Seki N., Fukunaga K., Shimizu-Yabe A., Iwase K., Ohtsuka S., Sato T., Kohno Y., Shibata S., Takiguchi M. (2003) J. Biol. Chem. 278, 30450–30457 [DOI] [PubMed] [Google Scholar]
- 8.Cunningham B. A., Moncur J. T., Huntington J. T., Kinlaw W. B. (1998) Thyroid 8, 815–825 [DOI] [PubMed] [Google Scholar]
- 9.LaFave L. T., Augustin L. B., Mariash C. N. (2006) Endocrinology 147, 4044–4047 [DOI] [PubMed] [Google Scholar]
- 10.Mater M. K., Thelen A. P., Pan D. A., Jump D. B. (1999) J. Biol. Chem. 274, 32725–32732 [DOI] [PubMed] [Google Scholar]
- 11.Shimomura I., Shimano H., Horton J. D., Goldstein J. L., Brown M. S. (1997) J. Clin. Invest. 99, 838–845 [DOI] [PMC free article] [PubMed] [Google Scholar]
- 12.Yokoyama C., Wang X., Briggs M. R., Admon A., Wu J., Hua X., Goldstein J. L., Brown M. S. (1993) Cell 75, 187–197 [PubMed] [Google Scholar]
- 13.Hua X., Yokoyama C., Wu J., Briggs M. R., Brown M. S., Goldstein J. L., Wang X. (1993) Proc. Natl. Acad. Sci. U.S.A. 90, 11603–11607 [DOI] [PMC free article] [PubMed] [Google Scholar]
- 14.Tontonoz P., Kim J. B., Graves R. A., Spiegelman B. M. (1993) Mol. Cell. Biol. 13, 4753–4759 [DOI] [PMC free article] [PubMed] [Google Scholar]
- 15.Horton J. D., Goldstein J. L., Brown M. S. (2002) J. Clin. Invest. 109, 1125–1131 [DOI] [PMC free article] [PubMed] [Google Scholar]
- 16.Goldstein J. L., DeBose-Boyd R. A., Brown M. S. (2006) Cell 124, 35–46 [DOI] [PubMed] [Google Scholar]
- 17.Yellaturu C. R., Deng X., Park E. A., Raghow R., Elam M. B. (2009) J. Biol. Chem. 284, 31726–31734 [DOI] [PMC free article] [PubMed] [Google Scholar]
- 18.Horton J. D., Bashmakov Y., Shimomura I., Shimano H. (1998) Proc. Natl. Acad. Sci. U.S.A. 95, 5987–5992 [DOI] [PMC free article] [PubMed] [Google Scholar]
- 19.Foretz M., Pacot C., Dugail I., Lemarchand P., Guichard C., Le Lièpvre X., Berthelier-Lubrano C., Spiegelman B., Kim J. B., Ferré P., Foufelle F. (1999) Mol. Cell. Biol. 19, 3760–3768 [DOI] [PMC free article] [PubMed] [Google Scholar]
- 20.Shimomura I., Bashmakov Y., Ikemoto S., Horton J. D., Brown M. S., Goldstein J. L. (1999) Proc. Natl. Acad. Sci. U.S.A. 96, 13656–13661 [DOI] [PMC free article] [PubMed] [Google Scholar]
- 21.Hasty A. H., Shimano H., Yahagi N., Amemiya-Kudo M., Perrey S., Yoshikawa T., Osuga J., Okazaki H., Tamura Y., Iizuka Y., Shionoiri F., Ohashi K., Harada K., Gotoda T., Nagai R., Ishibashi S., Yamada N. (2000) J. Biol. Chem. 275, 31069–31077 [DOI] [PubMed] [Google Scholar]
- 22.Kohsaka A., Laposky A. D., Ramsey K. M., Estrada C., Joshu C., Kobayashi Y., Turek F. W., Bass J. (2007) Cell Metab. 6, 414–421 [DOI] [PubMed] [Google Scholar]
- 23.Le Martelot G., Claudel T., Gatfield D., Schaad O., Kornmann B., Sasso G. L., Moschetta A., Schibler U. (2009) PLoS Biology 7, e1000181. [DOI] [PMC free article] [PubMed] [Google Scholar]
- 24.Brewer M., Lange D., Baler R., Anzulovich A. (2005) J. Biol. Rhythms. 20, 195–205 [DOI] [PubMed] [Google Scholar]
- 25.Chomczynski P., Sacchi N. (1987) Anal. Biochem. 162, 156–159 [DOI] [PubMed] [Google Scholar]
- 26.Preitner N., Damiola F., Lopez-Molina L., Zakany J., Duboule D., Albrecht U., Schibler U. (2002) Cell 110, 251–260 [DOI] [PubMed] [Google Scholar]
- 27.Ripperger J. A., Shearman L. P., Reppert S. M., Schibler U. (2000) Genes Dev. 14, 679–689 [PMC free article] [PubMed] [Google Scholar]
- 28.Hirao A., Tahara Y., Kimura I., Shibata S. (2009) PLoS ONE 4, e6909. [DOI] [PMC free article] [PubMed] [Google Scholar]
- 29.King D. P., Zhao Y., Sangoram A. M., Wilsbacher L. D., Tanaka M., Antoch M. P., Steeves T. D., Vitaterna M. H., Kornhauser J. M., Lowrey P. L., Turek F. W., Takahashi J. S. (1997) Cell 89, 641–653 [DOI] [PMC free article] [PubMed] [Google Scholar]
- 30.Shimba S., Ishii N., Ohta Y., Ohno T., Watabe Y., Hayashi M., Wada T., Aoyagi T., Tezuka M. (2005) Proc. Natl. Acad. Sci. U.S.A. 102, 12071–12076 [DOI] [PMC free article] [PubMed] [Google Scholar]
- 31.Zhang Y., Proenca R., Maffei M., Barone M., Leopold L., Friedman J. M. (1994) Nature 372, 425–432 [DOI] [PubMed] [Google Scholar]
- 32.Chen H., Charlat O., Tartaglia L. A., Woolf E. A., Weng X., Ellis S. J., Lakey N. D., Culpepper J., Moore K. J., Breitbart R. E., Duyk G. M., Tepper R. I., Morgenstern J. P. (1996) Cell 84, 491–495 [DOI] [PubMed] [Google Scholar]
- 33.Lee G. H., Proenca R., Montez J. M., Carroll K. M., Darvishzadeh J. G., Lee J. I., Friedman J. M. (1996) Nature 379, 632–635 [DOI] [PubMed] [Google Scholar]
- 34.Duez H., van der Veen J. N., Duhem C., Pourcet B., Touvier T., Fontaine C., Derudas B., Baugé E., Havinga R., Bloks V. W., Wolters H., van der Sluijs F. H., Vennström B., Kuipers F., Staels B. (2008) Gastroenterology 135, 689–698 [DOI] [PubMed] [Google Scholar]
- 35.Osborne T. F., Espenshade P. J. (2009) Genes Dev. 23, 2578–2591 [DOI] [PMC free article] [PubMed] [Google Scholar]
- 36.Hirano Y., Yoshida M., Shimizu M., Sato R. (2001) J. Biol. Chem. 276, 36431–36437 [DOI] [PubMed] [Google Scholar]
- 37.Sundqvist A., Bengoechea-Alonso M. T., Ye X., Lukiyanchuk V., Jin J., Harper J. W., Ericsson J. (2005) Cell Metab. 1, 379–391 [DOI] [PubMed] [Google Scholar]
- 38.Walker A. K., Yang F., Jiang K., Ji J. Y., Watts J. L., Purushotham A., Boss O., Hirsch M. L., Ribich S., Smith J. J., Israelian K., Westphal C. H., Rodgers J. T., Shioda T., Elson S. L., Mulligan P., Najafi-Shoushtari H., Black J. C., Thakur J. K., Kadyk L. C., Whetstine J. R., Mostoslavsky R., Puigserver P., Li X., Dyson N. J., Hart A. C., Näär A. M. (2010) Genes Dev. 24, 1403–1417 [DOI] [PMC free article] [PubMed] [Google Scholar]
- 39.Amemiya-Kudo M., Shimano H., Yoshikawa T., Yahagi N., Hasty A. H., Okazaki H., Tamura Y., Shionoiri F., Iizuka Y., Ohashi K., Osuga J., Harada K., Gotoda T., Sato R., Kimura S., Ishibashi S., Yamada N. (2000) J. Biol. Chem. 275, 31078–31085 [DOI] [PubMed] [Google Scholar]
- 40.Deng X., Yellaturu C., Cagen L., Wilcox H. G., Park E. A., Raghow R., Elam M. B. (2007) J. Biol. Chem. 282, 17517–17529 [DOI] [PubMed] [Google Scholar]
- 41.Fleischmann M., Iynedjian P. B. (2000) Biochem. J. 349, 13–17 [DOI] [PMC free article] [PubMed] [Google Scholar]
- 42.Li S., Brown M. S., Goldstein J. L. (2010) Proc. Natl. Acad. Sci. U.S.A. 107, 3441–3446 [DOI] [PMC free article] [PubMed] [Google Scholar]
- 43.Porstmann T., Griffiths B., Chung Y. L., Delpuech O., Griffiths J. R., Downward J., Schulze A. (2005) Oncogene 24, 6465–6481 [DOI] [PubMed] [Google Scholar]
- 44.Yellaturu C. R., Deng X., Cagen L. M., Wilcox H. G., Mansbach C. M., 2nd, Siddiqi S. A., Park E. A., Raghow R., Elam M. B. (2009) J. Biol. Chem. 284, 7518–7532 [DOI] [PMC free article] [PubMed] [Google Scholar]
- 45.Berson D. M., Dunn F. A., Takao M. (2002) Science 295, 1070–1073 [DOI] [PubMed] [Google Scholar]
- 46.Gooley J. J., Schomer A., Saper C. B. (2006) Nat. Neurosci. 9, 398–407 [DOI] [PubMed] [Google Scholar]
- 47.Mieda M., Williams S. C., Richardson J. A., Tanaka K., Yanagisawa M. (2006) Proc. Natl. Acad. Sci. U.S.A. 103, 12150–12155 [DOI] [PMC free article] [PubMed] [Google Scholar]
- 48.Landry G. J., Simon M. M., Webb I. C., Mistlberger R. E. (2006) Am. J. Physiol. 290, R1527–R1534 [DOI] [PubMed] [Google Scholar]
- 49.Kudo T., Akiyama M., Kuriyama K., Sudo M., Moriya T., Shibata S. (2004) Diabetologia 47, 1425–1436 [DOI] [PubMed] [Google Scholar]
- 50.Yanagihara H., Ando H., Hayashi Y., Obi Y., Fujimura A. (2006) Chronobiol. Int. 23, 905–914 [DOI] [PubMed] [Google Scholar]


