Abstract
Hypoxia in adipose tissue has been postulated as a possible contributor to obesity-related chronic inflammation, insulin resistance, and metabolic dysfunction. HIF1α (hypoxia-inducible factor 1α), a master signal mediator of hypoxia response, is elevated in obese adipose tissue. However, the role of HIF1α in obesity-related pathologies remains to be determined. Here we show that transgenic mice with adipose tissue-selective expression of a dominant negative version of HIF1α developed more severe obesity and were more susceptible to high fat diet-induced glucose intolerance and insulin resistance compared with their wild type littermates. Obesity in the transgenic mice was attributed to impaired energy expenditure and reduced thermogenesis. Histological examination of interscapular brown adipose tissue (BAT) in the transgenic mice demonstrated a markedly increased size of lipid droplets and decreased mitochondrial density in adipocytes, a phenotype similar to that in white adipose tissue. These changes in BAT of the transgenic mice were accompanied by decreased mitochondrial biogenesis and reduced expression of key thermogenic genes. In the transgenic mice, angiogenesis in BAT was decreased but was little affected in white adipose tissue. These findings support an indispensable role of HIF1α in maintaining the thermogenic functions of BAT, possibly through promoting angiogenesis and mitochondrial biogenesis in this tissue.
Keywords: Hypoxia, Insulin resistance, Metabolic diseases, Mitochondria, Obesity, Adipose Tissue Biology, Brown Adipose Tissue, Energy Expenditure and Obesity, Thermogenesis
Introduction
Adipose tissue is a central regulator of energy metabolism and vascular homeostasis, by secreting a diverse range of adipokines, such as proinflammatory mediators, leptin, and adiponectin (1). Excessive expansion of white adipose tissue (WAT),3 the hallmark of obesity, is a potent risk factor for type II diabetes and cardiovascular diseases (2). Inflammation in WAT, characterized by macrophage infiltration and elevated production of proinflammatory adipokines, plays a key role in linking obesity with insulin resistance and metabolic dysfunction (3, 4).
Hypoxia has recently been proposed as a possible initiator instigating macrophage infiltration and inflammation in obese WAT (5–7). The expansion of WAT is critically dependent on the microvasculature and angiogenesis in this tissue (8, 9). It has been suggested that the enlargement of adipocyte size in obesity exceeds the normal oxygen diffusion distance and compromises the effective oxygen supply from the vasculature, leading to localized hypoxia (10). Indeed, hypoxia in WAT has been observed in both genetic and dietary obese animals as well as in obese individuals (7, 11, 12). In vitro studies have demonstrated the profound effects of hypoxia on adipocyte functions, such as inhibiting adipogenesis, stimulating the secretion of leptin and VEGF, inducing proinflammatory responses and insulin resistance, and suppressing the production of adiponectin etc. (13, 14). However, the physiological role of hypoxia in the development of obesity-related metabolic disorders remains to be determined.
Whereas WAT is causally associated with obesity-related pathologies, brown adipose tissue (BAT) counteracts obesity through dissipation of excessive energy (15). The protective effect of BAT against obesity in animals is supported by the finding that mice lacking BAT are obese and exhibit reduced energy expenditure and insulin resistance (16, 17). By contrast, transgenic overexpression of BMP7 (bone morphogenic factor 7) or PRDM16 increases energy expenditure and prevents obesity by promoting BAT formation (18, 19). In line with these animal studies, recent clinical data suggest that individuals with low levels of BAT are more susceptible to obesity, insulin resistance, and cardio-metabolic diseases, whereas those with higher BAT contents maintain lower body weights and exhibit superior health as they age (20–22). BAT exerts its thermogenic activity by uncoupling mitochondrial oxidative phosphorylation from ATP production as a result of transmembrane proton leak mediated by UCP-1 (uncoupling protein 1) (15). The high thermogenic activity of BAT depends critically on a high rate of blood flow to supply oxygen and free fatty acids as well as to export heat (23). Due to this functional requirement, BAT contains an extremely developed vascular network.
HIF1 (hypoxia-inducible factor 1), a heterodimeric transcriptional factor consisting of α and β subunits, is the principal regulator mediating the cellular responses to hypoxia (24). The β subunit is constitutively present in the nuclei, whereas the α subunit is oxygen-labile and is rapidly degraded by the proteasome pathway following prolyl-hydroxylation and ubiquitination under normoxic conditions (25). Hypoxia induces stabilization, nuclear translocation, and activation of this transcription factor by reducing prolyl hydroxylation. HIF1α is expressed in both WAT and BAT, and its protein abundance in adipose tissues is elevated in several types of obese animal models as well as obese individuals (7, 11, 26). Weight loss, on the other hand, down-regulates the expression of HIF1α in obese adipose tissue (27). A recent gain-of-function study demonstrates that constitutive activation of HIF1α induces fibrosis and insulin resistance in WAT (26). However, the precise role of HIF1α in regulating adipose tissue functions remains poorly characterized.
To investigate whether elevated HIF1α in obese adipose tissue mediates the adverse metabolic consequences of obesity, we generated a transgenic mouse model expressing a dominant negative version of HIF1α under the transcriptional control of the aP2 gene promoter. To our surprise, the transgenic mice with selective inactivation of HIF1α exhibited an obese phenotype with reduced energy expenditure and impaired BAT functions, suggesting that HIF1α might be indispensable for maintaining the thermogenic properties of BAT.
EXPERIMENTAL PROCEDURES
Additional methodological details are provided in the supplemental material.
Generation of Transgenic Mice
The 1.3-kb FLAG-tagged cDNA fragment encoding a deletion mutant of human HIF1α lacking the DNA-binding domain (from amino acid 30 to 389) was subcloned under control of the 5.4-kb aP2 promoter and microinjected into the pronucleus of fertilized eggs of C57BL/6×CBA mice. Transgenic founders were identified by PCR using an upstream primer specific to the aP2 promoter and a downstream primer specific to the human dominant negative (dn) Hif1α gene. The detailed method for construction of the transgenic vector is described in the supplemental material.
Animal Maintenance and Metabolic Studies
The transgenic mice and wild type littermates were maintained on 12-h light and dark cycles under controlled environmental settings (23 ± 1 °C), with free access to water. At the age of 4 weeks old, mice were fed either a standard chow (catalog no. 5053, LabDiet, 13% of calories from fat) or high fat diet (HFD) (catalog no. D12451, Research Diets, Inc., 45% of calories from fat) for another 28 weeks. Glucose tolerance and insulin tolerance tests were conducted as we described previously (28). Blood glucose levels were determined using the Ascensia Elite XL blood glucose meter (Bayer Health Care). Serum levels of insulin were quantified using an ELISA kit from Mercodia AB (Uppsala, Sweden).
Indirect Calorimetry
Prior to the metabolic chamber study, mice were implanted with a Respironics Mini Mitter (Mini Mitter Co., Inc.) under ketamine/xylazine anesthesia for measurement of core body temperature and allowed 4 days for recovery. Mice were individually housed in metabolic chambers maintained at 20–22 °C on a 12-h light/12-h dark cycle with lights on at 7 a.m., and the metabolic parameters (whole-body oxygen consumption rates (VO2), respiration exchange rates (VCO2/VO2), locomotor activity, and core temperature) were measured continuously using a computer-controlled open circuit indirect calorimetry system (Oxymax, Columbus Instruments) with an air flow of 0.6 liters/min and sample flow of 0.5l/min. Data were collected over at least 4 days following at least 2 days of adaptation to the metabolic cages. Mice had free access to water and standard chow or HFD during the study.
Isolation of Mitochondria from BAT and Measurement of Mitochondrial Respiratory Chain Activities
Mice were sacrificed under deep anesthesia, and interscapular BAT was collected for mitochondrial isolation and measurement of the activities of the mitochondrial respiratory chain complexes, as detailed in supplemental material.
HIF DNA Binding Assay
The DNA binding levels of this transcription factor in BAT and WAT were measured with an HIF filter plate assay according to the protocol recommended by the manufacturer (Signosis Inc., Sunnyvale, CA). In brief, the nuclei were isolated from snap-frozen interscapular BAT and epididymal WAT using the nuclear extraction kit (Signosis Inc.). 10 μg of nuclear extract protein from each sample was incubated with the biotin-labeled DNA binding sequence to form HIF-DNA complexes, which were subsequently retained by a filter plate. The bound biotin-labeled DNA probe was eluted from the filter and was then captured by hybridizing to the corresponding well of the hybridization plate. The quantity of the bound DNA probe was determined by incubation with streptavidin-HRP and luminescence substrate and was reported as relative light units on a microplate luminometer.
Statistical Analysis
Experiments were performed routinely with 5–9 animals in each group. Results are expressed as the means ± S.E. Statistical significance was determined by one-way ANOVA or Student's t test. In all statistical comparisons, error bars are ±S.E., and a p value of <0.05 was used to indicate a significant difference.
RESULTS
Generation of Transgenic Mice with Adipose Tissue-specific Expression of a dn Version of HIF1α
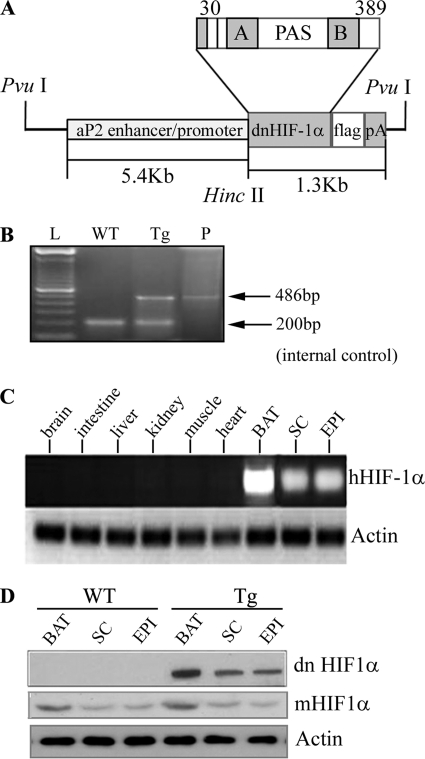
A deletion mutant of human HIF1α lacking the DNA-binding domain has previously been shown to act in a dn manner by suppressing the dimerization between functional HIF1α and HIF1β (29). In order to achieve the selective suppression of HIF1α in adipose tissue, we generated transgenic mice that overexpress a dn version of human HIF1α under the transcriptional control of a 5.4-kb aP2 (adipocyte fatty acid-binding protein) promoter, which has been widely used to drive transgene expression in adipose tissue (Fig. 1A). The transgenic founders were identified by genotyping (Fig. 1B). RT-PCR analysis using a pair of primers highly specific to human HIF1α cDNA detected the mRNA expression of the transgene in several types of adipose tissues at different anatomical locations, but not in other non-adipose tissues examined (Fig. 1C). Noticeably, both mRNA and protein expression levels of dn human Hif1α transgene in BAT were much higher than in WAT (Fig. 1D), a phenomenon that has been reported in several previous transgenic studies using the aP2 promoter (30–32). In both transgenic mice and wild type littermates, the protein level of endogenous HIF1α in BAT was also higher than that in WAT. The transgenic expression of dn HIF1α did not affect the expression of endogenous HIF1α in either BAT or WAT.
FIGURE 1.
Generation of transgenic mice with adipose tissue-selective expression of dominant negative HIF1α. A, schematic representation of the transgenic construct. Shown is cDNA encoding a dn version of human HIF1α driven by a 5.4-kb aP2 promoter/enhancer. PAS, Per-ARNT-Sim. A and B, PAS-A and PAS-B domains. B, confirmation of the presence of the dn Hif1α transgene by PCR analysis in transgenic mice. A 486-bp DNA fragment spanning from the aP2 promoter to dn HIF1α gene was amplified by PCR. WT, wild type littermate; Tg, transgene-positive; P, plasmid DNA-positive control. C, RT-PCR analysis to confirm adipose tissue-selective expression of dn HIF1α in transgenic mice. Total RNA was extracted from various tissues of the transgenic mice (10 weeks old). Mouse actin was used as an internal control. SC, subcutaneous fat; EPI, epididymal fat. D, Western blot analysis to measure the protein abundance of dn HIF1α using anti-FLAG antibody and mouse endogenous HIF1α (mHIF1α) using anti-HIF1α monoclonal antibody. 40 μg of protein was loaded in each lane.
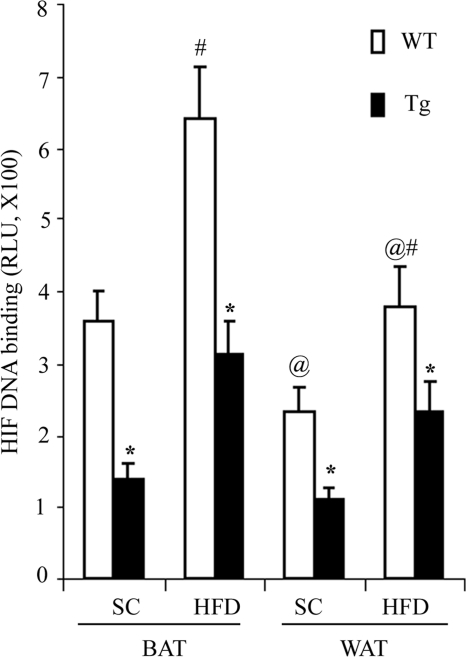
We next determined whether transgenic expression of dn HIF1α suppressed the endogenous activity of this transcription factor using an HIF filter plate assay. Consistent with the protein expression levels of endogenous HIF1α (Fig. 1D), its DNA binding activity levels in BAT were significantly higher than that in WAT (Fig. 2). In both BAT and WAT, the DNA binding activity levels in HFD-induced obese mice were significantly elevated compared with lean littermates. In HFD-induced obese mice, the DNA binding activity levels of this transcription factor in BAT and WAT of the transgenic mice were reduced by 51.5 and 42.2%, respectively, compared with those in wild type controls (Fig. 2). A similar trend of change was also observed in mice fed a standard chow.
FIGURE 2.
Transgenic expression of dn HIF1α inhibits the DNA binding activity levels of the transcription factor in both BAT and WAT. The aP2/dn HIF1α transgenic mice and wild type littermates fed a standard chow (SC) and HFD for 8 weeks. Nuclear extract proteins isolated from interscapular BAT and epididymal WAT were subjected to an HIF filter plate assay to determine the DNA binding activity levels to the hypoxia response element as described under “Experimental Procedures.” RLU, relative light units. *, p < 0.05 versus wild type littermates; #, p < 0.05 versus the corresponding SC group; @, p < 0.05 versus the BAT group, n = 5 in each group. Error bars, S.E.
Increased Fat Mass and Body Weight Gains in aP2/dn Hif1α Transgenic Mice
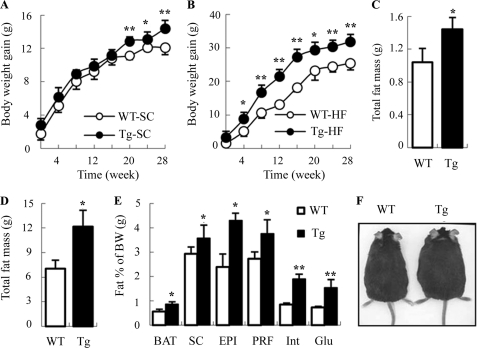
We next monitored food intake and body weight changes in aP2/dn HIF1α transgenic mice and wild type littermates on a weekly basis for a period of 28 weeks. There was no significant difference in food intake between the two groups of the mice fed either standard chow or HFD throughout the observation period (supplemental Fig. S1). When mice were fed a standard chow, a modest but significant higher body weight gain in the transgenic group was observed at 20 weeks after birth (Fig. 3A). At the age of 28 weeks, the body weight of the transgenic mice was ∼2.3 g heavier than the wild type littermates. On the other hand, a significantly elevated body weight gain in the transgenic mice was detected as early as 4 weeks after feeding an HFD (Fig. 3B). The difference in body weight became more obvious when the mice grew older. When the mice were sacrificed at 32 weeks after birth, the average body weight in the HFD-fed transgenic group was ∼6 g heavier than the wild type littermates. In the transgenic mice fed either standard chow or HFD, the increased body weight was largely due to the significant elevation in total fat mass (Fig. 3, C and D). Further detailed analysis showed that the mass of BAT and WAT at different anatomical locations in transgenic mice was significantly higher than that in wild type littermates (Fig. 3E). By contrast, there was no obvious difference in the weight of other major organs (heart, brain, kidney, lung, and spleen) between the two groups of the mice, except that the liver in the transgenic mice was marginally heavier than that in wild type littermates (data not shown). A representative example of two male siblings, one with and the other one without the transgene, is shown in Fig. 3F.
FIGURE 3.
Transgenic mice with adipose tissue-selective expression of dn HIF1α display increased body weight and expanded fat mass. Age-dependent changes in body weight gain in aP2/dn HIF1α transgenic mice and wild type littermates fed a standard chow (A) and HFD (B) were monitored on a weekly basis. Total fat mass of the mice fed a standard chow (C) and high fat diet (D) was analyzed at the time of dissection (32 weeks after birth). E, percentage of BAT and WAT at various anatomical locations over total body weight in the transgenic mice and wild type littermates fed an HFD. SC, subcutaneous fat; EPI, epididymal fat; PRF, peri-renal fat; Int, interscapular white fat; Glu, gluteal fat. F, representative transgenic mouse and a wild type littermate fed an HFD for 28 weeks. *, p < 0.05; **, p < 0.01 versus WT littermates (n = 5–9). A and B were analyzed by analysis of variance. C–E were analyzed by Student's t test. Error bars, S.E.
Impaired Glucose Homeostasis and Decreased Insulin Sensitivity in aP2/dn Hif1α Transgenic Mice
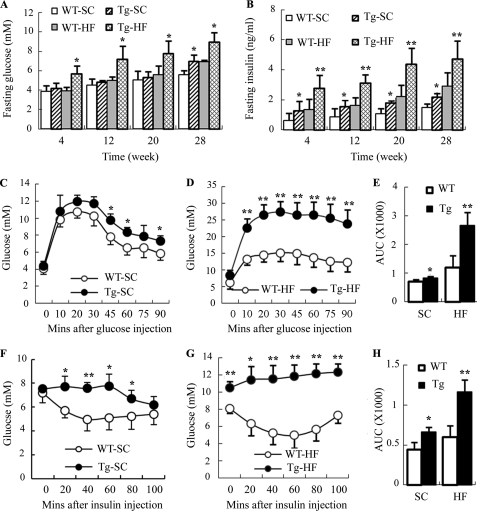
To investigate the metabolic effects of the transgenic expression of dn HIF1α in adipose tissue, we measured fasting levels of blood glucose and serum insulin in transgenic mice and wild type littermates over a period of 28 weeks (Fig. 4, A and B). When fed a standard chow, there was no significant difference in fasting glucose levels between the two groups of mice. The fasting level of serum insulin was significantly elevated in transgenic mice at the early phase (at 8 weeks after birth), and this elevation remained afterward. On the other hand, a significant increase in both fasting blood glucose and serum insulin in aP2/dn Hif1α transgenic mice was detected as early as 4 weeks after HFD feeding, and this elevation became more obvious when the mice grew older.
FIGURE 4.
Transgenic expression of dn HIF1α in adipose tissue aggravates HFD-induced hyperglycemia and hyperinsulinemia and impairs glucose tolerance and insulin sensitivity in mice. Fasting levels of blood glucose (A) and serum insulin (B) were measured every 4 weeks in aP2/dn HIF1α transgenic mice and wild type littermates on either a standard chow or HFD. An intraperitoneal glucose tolerance test (C–E) and insulin tolerance test (F–H) were conducted at 28 weeks after feeding standard chow or HFD, respectively. WT-SC, wild type mice fed standard chow; Tg-SC, transgenic mice fed standard chow; WT-HF, wild type mice fed HFD; Tg-HF, transgenic mice fed a high fat diet. *, p < 0.05; **, p < 0.01 versus wild type littermates (n = 5–9). Error bars, S.E.
An intraperitoneal glucose tolerance test showed that glucose clearance in the aP2/dn HIF1α transgenic mice was significantly impaired in response to glucose challenge (Fig. 4, C–E), and this impairment became more obvious when the mice were fed an HFD. Insulin sensitivity, as measured by an insulin tolerance test, was also reduced in aP2/dn Hif1α transgenic mice, in particular on HFD feeding (Fig. 4, F–H). Insulin-stimulated glucose uptake in primary epididymal adipocytes isolated from the aP2/dn Hif1α transgenic mice fed HFD for 16 weeks was significantly lower than that in the wild type littermates (supplemental Fig. S2A). In addition, the expression of PEPCK and G6Pase, the two key enzymes involved in hepatic glucose production, was increased in HFD-fed aP2/dn Hif1α transgenic mice (supplemental Fig. S2B).
Reduced Energy Expenditure and Decreased Core Body Temperature in aP2/dn Hif1α Transgenic Mice
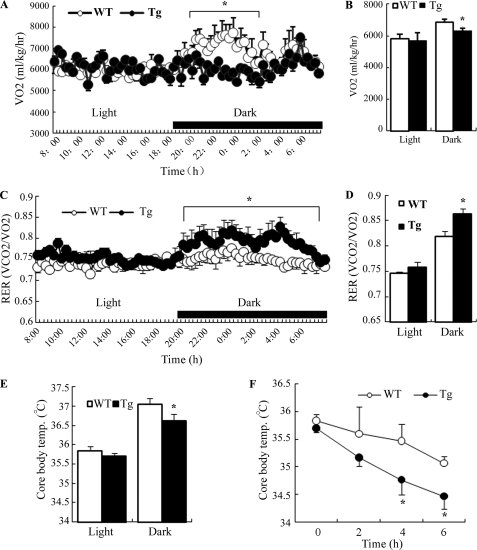
To further evaluate the metabolic changes caused by transgenic expression of dn HIF1α in adipose tissue, we measured energy expenditure and core body temperature in aP2/dn Hif1α transgenic mice and wild type littermates by indirect calorimetry. The rate of oxygen consumption (VO2) was significantly reduced in aP2/dn Hif1α transgenic mice, particularly during the dark cycle (Fig. 5, A and B). The respiration exchange rate (RER; VCO2/VO2) in aP2/dn Hif1α transgenic mice was significantly higher than in their wild type littermates (Fig. 5, C and D), indicating an impaired lipid utilization. The core body temperature in the transgenic mice was much lower than that in wild type littermates (Fig. 5E). Furthermore, in response to cold exposure, the decrease in core body temperature in transgenic mice was much faster than that in wild littermates (Fig. 5F), suggesting that the transgenic expression of dn HIF1α in adipose tissue may impair the thermogenic activity. The decreased energy expenditure, core body temperature, and increased respiration exchange rate were also observed in the transgenic mice on the HFD (data not shown).
FIGURE 5.
Transgenic expression of dn HIF1α in adipose tissue reduces energy expenditure, lipid utilization, and thermogenesis in mice. Indirect calorimetry was performed by housing 28-week-old aP2/dn HIF1α transgenic mice and wild type littermates under a high fat diet in a six-chamber Oxymax Lab Animal Monitoring System. A, VO2 during a 24-h light and dark cycle. B, oxygen consumption expressed as area under curve. C, RER (VCO2/VO2) during the 24-h light and dark cycle. D, RER expressed as area under curve. E, average core body temperature measured during 24-h light and dark cycle. F, changes in core body temperature when exposed to cold temperature. *, p < 0.05 versus WT littermates by Student's t test (n = 5–6). Error bars, S.E.
Morphologic Changes in Adipose Tissue of aP2/dn Hif1α Transgenic Mice
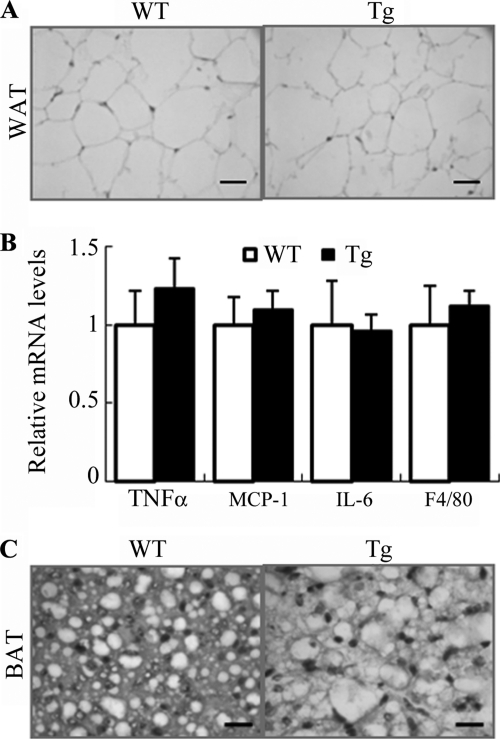
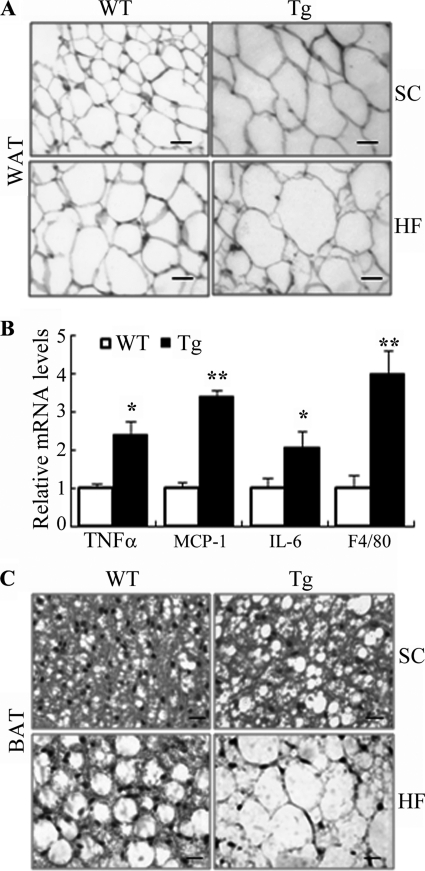
Histological analysis of epididymal WAT showed no obvious difference in adipocyte size or expression of proinflammatory cytokines between the transgenic mice and wild type littermates at 4 weeks old (Fig. 6, A and B). However, at the age of 32 weeks, the size of adipocytes in epididymal WAT of the transgenic mice was obviously enlarged compared with that in wild type controls on both standard chow and HFD (Fig. 7A). The expression levels of the macrophage marker F4/80 and several proinflammatory cytokines (TNFα, IL-6, and MCP-1) in epididymal WAT of the transgenic mice under high fat diet were significantly elevated (Fig. 7B), suggesting an increased macrophage infiltration in this tissue.
FIGURE 6.
Changes in adipocyte size and expression of proinflammation markers in adipose tissue of 4-week-old aP2/dn Hif1α transgenic mice. A, representative microscopic images for histological sections of epididymal fat pads from 4-week-old transgenic mice and wild type controls. Scale bar, 10 μm. B, relative mRNA abundance of several inflammation markers in epididylmal fat as determined by real time PCR (n = 5). C, representative macroscopic photos for histological sections of BAT from 4-week-old transgenic mice and wild type controls. Scale bar, 10 μm. Error bars, S.E.
FIGURE 7.
Increased adipocyte sizes and elevated inflammation in adipose tissue of 32-week-old aP2/dn Hif1α transgenic mice on standard chow. A, representative microscopic images from histological sections of epididymal fat pads stained with hematoxylin and eosin. SC, standard chow; HF, high fat diet. Scale bar, 10 μm. B, real time PCR analysis to quantify the mRNA expression levels for several proinflammatory markers in epididymal fat pads under high fat diet. The relative abundance of each gene was normalized against 18 S RNA and expressed as -fold over wild type littermates (n = 5–9). *, p < 0.05; **, p < 0.01 versus WT controls. C, typical microscopic photos from histological sections of BAT. Scale bar, 10 μm. Error bars, S.E.
Upon dissection of the mice, it was quite apparent that the interscapular BAT of the transgenic mice was much more whitish than those of their littermates. Histological analysis showed that BAT from wild type littermates was mainly composed of small polygonal mitochondria-enriched adipocytes with eosinophilic staining (Fig. 7C). By contrast, adipocytes from BAT of the transgenic mice lost the typical morphology and resembled more those in WAT. The cytoplasm of the cells was occupied by a large lipid droplet, pushing the nucleus to the cell periphery. Notably, these morphological changes in BAT were observed as early as 4 weeks after birth (Fig. 6C), prior to the development of obesity and any histological alterations in WAT.
Impaired Mitochondrial Biogenesis in BAT of aP2/dn Hif1α Transgenic Mice
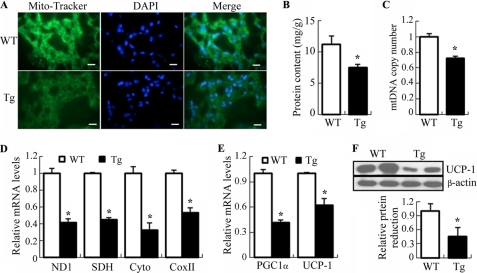
Consistent with the changes in thermogenesis and histology, mitochondrial density in BAT, as determined by staining with Mito Tracker (a mitochondria-specific fluorescent dye), was decreased in BAT of 32-week-old aP2/dn Hif1α mice (Fig. 8A). The mitochondrial protein content relative to total protein in BAT of the transgenic mice was decreased significantly by 34% under standard chow diet (Fig. 8B) and by 47% under HFD (supplemental Fig. S3A) compared with those of age-matched wild type littermates.
FIGURE 8.
Decreased mitochondrial contents and reduced mitochondrial biogenesis in BAT of 32-week-old aP2/dn Hif1α transgenic mice. A, frozen sections of BAT stained with Mito-Tracker (green) and DAPI (blue). Tg, aP2/dn HIF1α transgenic mice; WT, wild type littermates. Scale bar, 10 μm. B, mitochondrial protein contents expressed as mg of the isolated mitochondria/g of BAT. C, mtDNA copy number expressed as -fold over wild type littermates after normalization against the nuclear gene T-cell receptor. D, real-time PCR analysis to quantify the relative mRNA abundance of several genes involved in mitochondrial biogenesis in BAT. ND1, NADH dehydrogenase subunit 1; SDH, succinate dehydrogenase; Cyto, cytochrome b; COX II, cytochrome c oxidase subunit 1. E, relative mRNA abundance of Pgc1α and Ucp-1 as determined by real time PCR. F, Western blot analysis to determine the protein levels of UCP-1. 30 μg of protein from total BAT lysates were loaded in each lane. *, p < 0.05; **, p < 0.01 versus wild type littermates (n = 5–9). Error bars, S.E.
To investigate whether the decreased mitochondria density in the transgenic mice was accompanied by an impaired mitochondrial biogenesis, the mitochondrial DNA (mtDNA) copy number and the expression of several key genes involved in energy dissipation in BAT were quantified by real time PCR (Fig. 8, C and D, and supplemental Fig. S3, B and C). This analysis demonstrated that the transgenic mice had a much lower mtDNA copy number than wild type littermates under both standard chow and HFD. The mRNA expression levels for a number of mitochondria-related genes, including NADH dehydrogenase subunit 1, SDH (succinate dehydrogenase), cytochrome b, and cytochrome c oxidase subunit 1, were reduced significantly in the transgenic mice. Furthermore, both mRNA and protein expression of PGC1α and UCP-1, the two key genes controlling the thermogenic functions of BAT, were also decreased following the transgenic expression of dn HIF1α in adipose tissue (Fig. 8, E and F, and supplemental Fig. S3, D and E). On the other hand, there was no obvious difference in mitochondrial density or in expression of the mitochondria-related genes in white adipose tissue between the transgenic mice and wild type controls (data not shown).
Consistent with the changes in mitochondrial biogenesis, the oxygen consumption in adipocytes isolated from BAT of the transgenic mice was significantly lower than that in wild type littermates (supplemental Fig. S4). On the other hand, the oxygen consumption in adipocytes derived from epididymal WAT was comparable between the two groups.
Decreased Energy Expenditure and Impaired BAT Function in aP2/dn Hif1α Transgenic Mice Occur at the Early Stage
To evaluate whether BAT dysfunction contributes to the obese phenotype in aP2/dn HIF1α transgenic mice, we further analyzed the mitochondrial biogenesis of BAT and thermogenic activity of the mice at 4 weeks old, before the onset of obesity. As shown in supplemental Fig. S5, the mitochondrial protein content, mitochondrial density (as determined by staining with Mito Tracker), mtDNA copy number, and expression of Pgc1α, Ucp-1, and several other mitochondrial genes were all reduced in 4-week-old transgenic mice compared with age-matched wild type littermates. These changes in the transgenic mice were accompanied by significantly decreased activities of mitochondrial respiratory complex I, complex II-III, and complex IV (supplemental Fig. S6).
In line with the changes in the mitochondrial biogenesis of BAT, the core body temperature of 4-week-old dn HIF1α transgenic mice was lower than wild type controls, especially during the dark cycle or in response to cold exposure (supplemental Fig. S7, A and B). Energy expenditure in the transgenic mice, as measured by the rate of oxygen consumption (VO2), was also reduced (supplemental Fig. S7, C and D). The RER (VCO2/VO2) in aP2/dn Hif1α transgenic mice was significantly higher than in their wild type littermates, suggesting that an impaired lipid utilization occurs before the development of obesity (supplemental Fig. S7, E and F).
Differential Changes in Angiogenesis between BAT and WAT in aP2/dn Hif1α Transgenic Mice
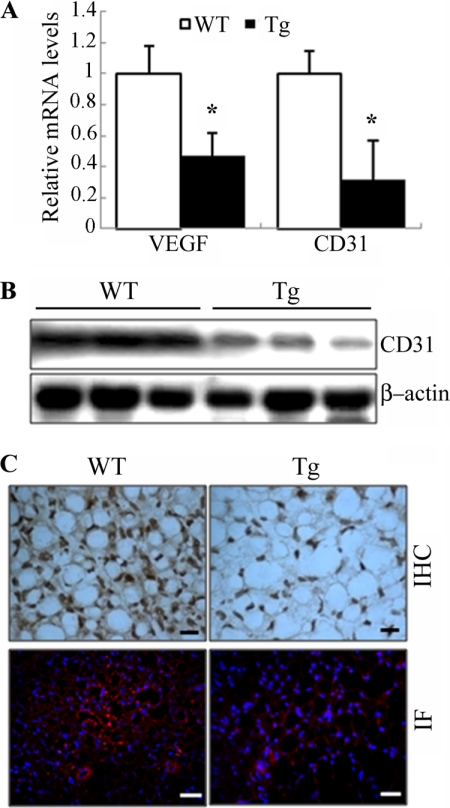
HIF1α is a principal regulator of vascularization, by inducing the expression of a panel of genes involved in angiogenesis (33). Angiogenesis and adipogenesis are spatially and temporally linked during the development (8). Therefore, we next investigated the impact of the transgenic expression of dn HIF1α on vascularization in both BAT and WAT of the mice. At the age of 4 weeks, the expression of VEGF, a well known angiogenic factor under the control of HIF1α, was reduced by ∼60% in BAT of the transgenic mice (Fig. 9A). This change in the transgenic mice was accompanied by decreased mRNA and protein levels of CD31, a well established marker for neovascularization (Fig. 9, A and B). Accordingly, immunostaining with anti-CD31 showed that the density of blood vessels in BAT of the transgenic mice was much lower than wild type controls (Fig. 9C). By contrast, no obvious difference in expression of VEGF and CD31 or in the density of blood vessels was observed in epididymal fat pads or WAT at several other locations between the two groups of mice at the age of 4 weeks (data not shown).
FIGURE 9.
Decreased angiogenesis in BAT of 4-week-old aP2/dn Hif1α transgenic mice. A, relative mRNA levels of VEGF and CD31 in BAT of the transgenic mice and their wild type littermates as determined by quantitative RT-PCR (n = 5–6). B, Western blot analysis to determine the protein levels of CD31 in BAT. 50 μg of protein from total cell lysates was loaded in each lane. C, representative images from histological sections of BAT stained with the endothelial marker CD31. The nuclei in the lower panel were stained with DAPI (blue). Scale bar, 10 μm. IHC, immunohistochemistry; IF, immunofluorescence. Error bars, S.E.
Real-time PCR analysis showed that the expressions of Pdk (pyruvate dehydrogenase kinase) and Glut-1 (glucose transporter-1), both of which are the target genes of HIF1α, were decreased to a comparable level in interscapular BAT and epididymal WAT (supplemental Fig. S8). These findings exclude the possibility that the lack of changes in angiogenesis in WAT of the transgenic mice is due to the relatively lower level of the dn HIF1α transgene expression in this tissue.
DISCUSSION
The presence of local hypoxia in adipose tissue has been observed by several independent groups in both genetic and dietary obese mice as well as in obese individuals (7, 11, 12). As a major hypoxia-responsive gene, the protein abundance of HIF1α and its transcriptional activity in adipose tissue are elevated in obese adipose tissue (7, 11, 26). It has been postulated that local hypoxia instigates macrophage infiltration and inflammation in obese adipose tissue through activation of HIF1α (34). Indeed, a recent report from Scherer and colleagues (26) demonstrates that transgenic expression of a constitutively active form of HIF1α induces fibrosis and inflammation in WAT, leading to impaired glucose tolerance in mice. In light of these findings, our initial hypothesis was that selective blockage of HIF1α in adipose tissue should be able to alleviate obesity-related pathologies. Unexpectedly, the results from the present study show that suppression of endogenous HIF1α activity in adipose tissue by transgenic expression of its dominant negative form leads to obesity and aggravates insulin resistance and hyperglycemia induced by both HFD and aging. These phenotypic changes are attributed to reduced energy expenditure and impaired thermogenic activity of BAT. This conclusion is supported by the finding that BAT dysfunction and impaired mitochondrial biogenesis in this tissue occur at the very early stage in the transgenic mice, prior to the development of obesity and its metabolic disorders. Therefore, the present study uncovers an indispensable role of HIF1α in regulating the biogenesis and thermogenic functions of BAT.
Recent studies suggest that BAT is more abundant than previously recognized (20–22). Nuclear imaging has identified several BAT depots in adults. The unique feature of BAT is its extremely high density of vasculature, which enables a high rate of blood perfusion to supply oxygen and free fatty acids and to facilitate heat dissipation (23). The vascularization of BAT is increased in response to cold exposure through a mechanism involving stimulation of angiogenesis by activation of a sympathetic nerve system (35). VEGF is believed to mediate angiogenesis in BAT (36). Blockage of the VEGF receptor-2 abolishes cold-induced angiogenesis in BAT and impairs nonshivering thermogenesis in mice (37). However, the precise mechanism by which the neovascularization of BAT is regulated remains poorly understood.
The present study demonstrates that HIF1α is a key regulator of angiogenesis in BAT, as evidenced by the fact that the transgenic mice with endogenous HIF1α activity being suppressed by its dominant negative form exhibit reduced VEGF expression and decreased vascularization in this tissue. Noticeably, the impaired angiogenesis in BAT of the transgenic mice is accompanied by the conversion of brown adipocytes to a WAT-like phenotype, in which the mitochondrial density is reduced, whereas the size of lipid droplets is obviously enlarged. At the molecular level, the transgenic mice display significantly decreased expression of a panel of genes involved in mitochondrial biogenesis and thermogenesis in BAT. Taken in conjunction, these data suggest that vascularization is also required for BAT formation during the postnatal growth. In line with this conclusion, mice deficient in placental growth factor, an angiogenic factor that binds with high affinity to the VEGF receptors, also display reduced adipose vascularization, less BAT, impaired thermogenesis, and white adipocyte hypertrophy (38).
A growing body of evidence suggests that BAT and WAT are derived from distinct precursor populations during embryonic development (18, 19). Brown adipocytes share a common precursor with skeletal muscle cells, whereas white adipocytes arise from a distinct cell lineage (18, 19). The current study provides evidence that vascularization of BAT and WAT might also be differentially regulated. This conclusion is supported by our finding that transgenic expression of dominant negative HIF1α impairs angiogenesis in BAT but not in WAT, suggesting that angiogenesis in the latter tissue is not dependent on HIF1α. Consistent with our findings, VEGF expression in WAT was found to be paradoxically reduced or unchanged despite increased accumulation of HIF1α protein in this tissue under dietary or genetic obesity (7, 11, 12). Furthermore, it has been found that adipose-specific transgenic expression of constitutively active HIF1α fails to initiate the angiogenic response in WAT (26). The expression of neither VEGF nor a panel of vascular markers (CD31, KDR, and Tie2) is altered among several WAT depots being examined in the transgenic mice. Instead, HIF1α activation induces the expression of a cluster of extracellular matrix components and triggers fibrosis in WAT, leading to local inflammation and systemic insulin resistance (26). Based on the findings from this study, in conjunction with those from previous reports, it is conceivable that HIF1α might play a dual role in the development of obesity-related metabolic changes, through its distinct actions in BAT and WAT. In WAT, elevated accumulation of HIF1α contributes to obesity-associated metabolic dysfunction by inducing fibrosis and inflammation. By contrast, hypoxia-induced activation of HIF1α in obese BAT might represent an adaptive response, by promoting the thermogenic functions of this tissue to facilitate energy expenditure in the times of overnutrition.
In summary, the present study identifies HIF1α as an important player in maintaining the thermogenic functions of BAT, possibly by promoting angiogenesis to ensure the high rate of blood perfusion. The findings further highlight the crucial role of vascularization in regulating adipogenesis and energy expenditure and also suggest that HIF1α might be involved in controlling the balance and interconversion between BAT and WAT. Interestingly, recent studies have demonstrated an unexpected role of HIF1α in regulating longevity in Caenorhabditis elegans (39). Therefore, whether modulation of HIF1α activity can represent a viable therapeutic strategy for treating both obesity- and age-related diseases warrants further investigation.
Acknowledgment
We thank James Lau for help with the microinjection work.
This work was supported by Research Grants Council of Hong Kong General Research Fund Grant HKU 7645/06M and Collaborative Research Fund Grant HKU 2/07C, Natural Science Foundation of China Grant 30600300, and an Outstanding Young Researcher Award from the University of Hong Kong (to A. X.).

The on-line version of this article (available at http://www.jbc.org) contains supplemental Figs. S1–S8.
- WAT
- white adipose tissue
- BAT
- brown adipose tissue
- HFD
- high fat diet
- VO2
- oxygen consumption
- RER
- respiration exchange rate
- mtDNA
- mitochondrial DNA
- dn
- dominant negative.
REFERENCES
- 1.Rajala M. W., Scherer P. E. (2003) Endocrinology 144, 3765–3773 [DOI] [PubMed] [Google Scholar]
- 2.Wellen K. E., Hotamisligil G. S. (2005) J. Clin. Invest. 115, 1111–1119 [DOI] [PMC free article] [PubMed] [Google Scholar]
- 3.Weisberg S. P., McCann D., Desai M., Rosenbaum M., Leibel R. L., Ferrante A. W., Jr. (2003) J. Clin. Invest. 112, 1796–1808 [DOI] [PMC free article] [PubMed] [Google Scholar]
- 4.Xu H., Barnes G. T., Yang Q., Tan G., Yang D., Chou C. J., Sole J., Nichols A., Ross J. S., Tartaglia L. A., Chen H. (2003) J. Clin. Invest. 112, 1821–1830 [DOI] [PMC free article] [PubMed] [Google Scholar]
- 5.Trayhurn P., Wang B., Wood I. S. (2008) Br. J. Nutr. 100, 227–235 [DOI] [PubMed] [Google Scholar]
- 6.Ye J. (2009) Int. J. Obes. 33, 54–66 [DOI] [PMC free article] [PubMed] [Google Scholar]
- 7.Ye J., Gao Z., Yin J., He Q. (2007) Am. J. Physiol. Endocrinol. Metab. 293, E1118–E1128 [DOI] [PubMed] [Google Scholar]
- 8.Cao Y. (2007) J. Clin. Invest. 117, 2362–2368 [DOI] [PMC free article] [PubMed] [Google Scholar]
- 9.Christiaens V., Lijnen H. R. (2010) Mol. Cell. Endocrinol. 318, 2–9 [DOI] [PubMed] [Google Scholar]
- 10.Trayhurn P., Wood I. S. (2004) Br. J. Nutr. 92, 347–355 [DOI] [PubMed] [Google Scholar]
- 11.Hosogai N., Fukuhara A., Oshima K., Miyata Y., Tanaka S., Segawa K., Furukawa S., Tochino Y., Komuro R., Matsuda M., Shimomura I. (2007) Diabetes 56, 901–911 [DOI] [PubMed] [Google Scholar]
- 12.Pasarica M., Sereda O. R., Redman L. M., Albarado D. C., Hymel D. T., Roan L. E., Rood J. C., Burk D. H., Smith S. R. (2009) Diabetes 58, 718–725 [DOI] [PMC free article] [PubMed] [Google Scholar]
- 13.Chen B., Lam K. S., Wang Y., Wu D., Lam M. C., Shen J., Wong L., Hoo R. L., Zhang J., Xu A. (2006) Biochem. Biophys. Res. Commun. 341, 549–556 [DOI] [PubMed] [Google Scholar]
- 14.Regazzetti C., Peraldi P., Grémeaux T., Najem-Lendom R., Ben-Sahra I., Cormont M., Bost F., Le Marchand-Brustel Y., Tanti J. F., Giorgetti-Peraldi S. (2009) Diabetes 58, 95–103 [DOI] [PMC free article] [PubMed] [Google Scholar]
- 15.Lowell B. B., Spiegelman B. M. (2000) Nature 404, 652–660 [DOI] [PubMed] [Google Scholar]
- 16.Hamann A., Flier J. S., Lowell B. B. (1996) Endocrinology 137, 21–29 [DOI] [PubMed] [Google Scholar]
- 17.Lowell B. B., S-Susulic V., Hamann A., Lawitts J. A., Himms-Hagen J., Boyer B. B., Kozak L. P., Flier J. S. (1993) Nature 366, 740–742 [DOI] [PubMed] [Google Scholar]
- 18.Seale P., Bjork B., Yang W., Kajimura S., Chin S., Kuang S., Scimè A., Devarakonda S., Conroe H. M., Erdjument-Bromage H., Tempst P., Rudnicki M. A., Beier D. R., Spiegelman B. M. (2008) Nature 454, 961–967 [DOI] [PMC free article] [PubMed] [Google Scholar]
- 19.Tseng Y. H., Kokkotou E., Schulz T. J., Huang T. L., Winnay J. N., Taniguchi C. M., Tran T. T., Suzuki R., Espinoza D. O., Yamamoto Y., Ahrens M. J., Dudley A. T., Norris A. W., Kulkarni R. N., Kahn C. R. (2008) Nature 454, 1000–1004 [DOI] [PMC free article] [PubMed] [Google Scholar]
- 20.Cypess A. M., Lehman S., Williams G., Tal I., Rodman D., Goldfine A. B., Kuo F. C., Palmer E. L., Tseng Y. H., Doria A., Kolodny G. M., Kahn C. R. (2009) N. Engl. J. Med. 360, 1509–1517 [DOI] [PMC free article] [PubMed] [Google Scholar]
- 21.van Marken Lichtenbelt W. D., Vanhommerig J. W., Smulders N. M., Drossaerts J. M., Kemerink G. J., Bouvy N. D., Schrauwen P., Teule G. J. (2009) N. Engl. J. Med. 360, 1500–1508 [DOI] [PubMed] [Google Scholar]
- 22.Virtanen K. A., Lidell M. E., Orava J., Heglind M., Westergren R., Niemi T., Taittonen M., Laine J., Savisto N. J., Enerbäck S., Nuutila P. (2009) N. Engl. J. Med. 360, 1518–1525 [DOI] [PubMed] [Google Scholar]
- 23.Bukowiecki L., Lupien J., Follea N., Paradis A., Richard D., LeBlanc J. (1980) Am. J. Physiol. 239, E422–E429 [DOI] [PubMed] [Google Scholar]
- 24.Giaccia A. J., Simon M. C., Johnson R. (2004) Genes Dev. 18, 2183–2194 [DOI] [PMC free article] [PubMed] [Google Scholar]
- 25.Ke Q., Costa M. (2006) Mol. Pharmacol. 70, 1469–1480 [DOI] [PubMed] [Google Scholar]
- 26.Halberg N., Khan T., Trujillo M. E., Wernstedt-Asterholm I., Attie A. D., Sherwani S., Wang Z. V., Landskroner-Eiger S., Dineen S., Magalang U. J., Brekken R. A., Scherer P. E. (2009) Mol. Cell. Biol. 29, 4467–4483 [DOI] [PMC free article] [PubMed] [Google Scholar]
- 27.Cancello R., Henegar C., Viguerie N., Taleb S., Poitou C., Rouault C., Coupaye M., Pelloux V., Hugol D., Bouillot J. L., Bouloumié A., Barbatelli G., Cinti S., Svensson P. A., Barsh G. S., Zucker J. D., Basdevant A., Langin D., Clément K. (2005) Diabetes 54, 2277–2286 [DOI] [PubMed] [Google Scholar]
- 28.Xu A., Lam M. C., Chan K. W., Wang Y., Zhang J., Hoo R. L., Xu J. Y., Chen B., Chow W. S., Tso A. W., Lam K. S. (2005) Proc. Natl. Acad. Sci. U.S.A. 102, 6086–6091 [DOI] [PMC free article] [PubMed] [Google Scholar]
- 29.Chen J., Zhao S., Nakada K., Kuge Y., Tamaki N., Okada F., Wang J., Shindo M., Higashino F., Takeda K., Asaka M., Katoh H., Sugiyama T., Hosokawa M., Kobayashi M. (2003) Am. J. Pathol. 162, 1283–1291 [DOI] [PMC free article] [PubMed] [Google Scholar]
- 30.Hensley L. L., Ranganathan G., Wagner E. M., Wells B. D., Daniel J. C., Vu D., Semenkovich C. F., Zechner R., Kern P. A. (2003) J. Biol. Chem. 278, 32702–32709 [DOI] [PubMed] [Google Scholar]
- 31.Kamei N., Tobe K., Suzuki R., Ohsugi M., Watanabe T., Kubota N., Ohtsuka-Kowatari N., Kumagai K., Sakamoto K., Kobayashi M., Yamauchi T., Ueki K., Oishi Y., Nishimura S., Manabe I., Hashimoto H., Ohnishi Y., Ogata H., Tokuyama K., Tsunoda M., Ide T., Murakami K., Nagai R., Kadowaki T. (2006) J. Biol. Chem. 281, 26602–26614 [DOI] [PubMed] [Google Scholar]
- 32.Valet P., Grujic D., Wade J., Ito M., Zingaretti M. C., Soloveva V., Ross S. R., Graves R. A., Cinti S., Lafontan M., Lowell B. B. (2000) J. Biol. Chem. 275, 34797–34802 [DOI] [PubMed] [Google Scholar]
- 33.Pugh C. W., Ratcliffe P. J. (2003) Nat. Med. 9, 677–684 [DOI] [PubMed] [Google Scholar]
- 34.Pang C., Gao Z., Yin J., Zhang J., Jia W., Ye J. (2008) Am. J. Physiol. Endocrinol. Metab. 295, E313–E322 [DOI] [PMC free article] [PubMed] [Google Scholar]
- 35.Asano A., Morimatsu M., Nikami H., Yoshida T., Saito M. (1997) Biochem. J. 328, 179–183 [DOI] [PMC free article] [PubMed] [Google Scholar]
- 36.Fredriksson J. M., Lindquist J. M., Bronnikov G. E., Nedergaard J. (2000) J. Biol. Chem. 275, 13802–13811 [DOI] [PubMed] [Google Scholar]
- 37.Xue Y., Petrovic N., Cao R., Larsson O., Lim S., Chen S., Feldmann H. M., Liang Z., Zhu Z., Nedergaard J., Cannon B., Cao Y. (2009) Cell Metab. 9, 99–109 [DOI] [PubMed] [Google Scholar]
- 38.Hemmeryckx B., van Bree R., Van Hoef B., Vercruysse L., Lijnen H. R., Verhaeghe J. (2008) Endocrinology 149, 2176–2183 [DOI] [PubMed] [Google Scholar]
- 39.Mehta R., Steinkraus K. A., Sutphin G. L., Ramos F. J., Shamieh L. S., Huh A., Davis C., Chandler-Brown D., Kaeberlein M. (2009) Science 324, 1196–1198 [DOI] [PMC free article] [PubMed] [Google Scholar]


