Abstract
Dynamic changes in neuronal morphology and transcriptional regulation play crucial roles in the neuronal network and function. Accumulating evidence suggests that the megakaryoblastic leukemia (MKL) family members, which function not only as actin-binding proteins but also as serum response factor (SRF) transcriptional coactivators, regulate neuronal morphology. However, the extracellular ligands and signaling pathways, which activate MKL-mediated morphological changes in neurons, remain unresolved. Here, we demonstrate that in addition to MKL1, MKL2, highly enriched in the forebrain, strongly contributes to the dendritic complexity, and this process is triggered by stimulation with activin, a member of the transforming growth factor β (TGF-β) superfamily. Activin promoted dendritic complexity in a SRF- and MKL-dependent manner without drastically affecting MKL localization and protein levels. In contrast, activin promoted the nuclear export of suppressor of cancer cell invasion (SCAI), which is a corepressor for SRF and MKL. Furthermore, overexpression of SCAI blocked activin-induced SRF transcriptional responses and dendritic complexity. Collectively, these results strongly suggest that activin-SCAI-MKL signaling is a novel pathway that regulates the dendritic morphology of rat cortical neurons by excluding SCAI from the nucleus and activating MKL/SRF-mediated gene expression.
Keywords: Gene Expression, Neurobiology, Neuroscience, siRNA, Transcription Coactivators, Transcription Factors, Transforming Growth Factor β (TGF-β), Activin, Dendritic Morphology, Serum Response Factor
Introduction
Serum response factor (SRF)4 is a transcription factor that binds to a consensus sequence CC(A/T)6GG (called the CArG box), which is present in the promoters of several immediate-early or cytoskeletal genes (1). Several studies have demonstrated that deletion mutants of SRF in the mouse brain result in the attenuation of activity-dependent expression of immediate-early genes, impair synaptic plasticity and learning (2, 3), reduce neurite outgrowth, and show abnormality of pathfindings and neuronal migration (4, 5). These findings strongly suggest that SRF plays an important role in neuronal development and plasticity (6). SRF-dependent transcription is controlled by at least two different types of coactivators. One comprises the ternary complex factors, which mainly regulate the immediate-early genes such as c-fos (7). The other type of coactivator comprises megakaryoblastic leukemia (MKL) family members. The MKL family consists of megakaryocytic acute leukemia/megakaryoblastic leukemia 1/myocardin-related transcription factor-A/basic SAP, and coiled-coil domain (MAL/MKL1/MRTF-A/BSAC) and MKL2/MRTF-B (8–13). In nonneuronal cells, MKL1 is primarily activated by actin rearrangement stimulated with the activation of Rho GTPases; that is, release of MKL1 from G-actin enables MKL1 to translocate to the nucleus where it binds to and activates SRF (14). MKL2, in addition to MKL1, regulates a set of cytoskeletal genes (11, 12). Furthermore, suppressor of cancer cell invasion (SCAI) has recently been identified as an MKL-interacting cofactor that inhibits cancer cell invasion (15). Therefore, SRF-driven transcriptional regulation appears to be more complicated because of the presence of novel MKL-interacting cofactors. However, it remains unclear as to whether MKL1, MKL2, and SCAI play different roles in several biological processes through the regulation of their own target genes in neurons.
The transforming growth factor β (TGF-β) superfamily plays important roles in various cellular processes associated with cell growth, differentiation, and development (16–18). To regulate such a wide variety of cellular functions, TGF-β binds to specific receptors and activates a multitude of signals, including the canonical pathway that promotes phosphorylation and nuclear translocation of Smad2 and Smad3 (19) and the noncanonical pathway that activates ERK, p38 MAP kinases, or Rho GTPases (20). Several lines of evidence suggest that TGF-β signaling also regulates SRF (21, 22). Recently, a study showed that TGF-β1, a member of the TGF-β superfamily, activates SRF-dependent cytoskeletal genes or Smad3-dependent genes via nuclear translocation of MKL. This process may be involved in epithelial-mesenchymal transition, which occurs during embryonic development and tumor progression (22). However, it is unknown whether MKL family members mediate TGF-β signaling in the brain.
In neurons, MKL1 regulates SRF-mediated transcription through the RhoA or brain-derived neurotrophic factor (BDNF)-induced ERK1/2 signaling pathway (23, 24). In addition, MKL1 is highly expressed in the forebrain and regulates the neuronal morphology of cortical or hippocampal neurons (5, 25). MKL1 may also be involved in nerve growth factor (NGF)-induced axonal growth of sensory neurons (26). These observations imply that MKL family members participate in the regulation of neuronal morphology through regulating actin-based morphological changes or by controlling the expression of SRF-targeted cytoskeletal genes. In contrast to several reports on the function of MKL1, the expression and function of MKL2 in the brain remain unresolved. Furthermore, there is little information describing the kinds of extracellular ligands that potentially act upstream of the MKL family to regulate dendritic morphology. In the present study, we first investigated the pattern of MKL2 expression in the developing and adult brain and assessed whether MKL2 regulates SRF transcription and the morphology of rat cortical neurons. Furthermore, we found that activin, a member of the TGF-β superfamily, promoted dendritic complexity through nuclear export of SCAI and removing SCAI repressor function for MKL/SRF gene expression.
EXPERIMENTAL PROCEDURES
Animals, Reagents, Plasmids, and Antibodies
These materials are described in the supplemental Experimental Procedures.
Cell Culture
Cultures of NIH3T3 cells and rat cortical neurons were prepared according to methods described previously (25, 27) with minor modifications. More information is provided in the supplemental Experimental Procedures.
In Situ Hybridization
In situ hybridization was performed as described previously (28). The antisense oligonucleotide probe was complementary to the mouse MKL2 gene (GenBank accession number BC131644; nucleotide positions 1395–1439). The sequence used was: 5′-TCAACATGGGGCACACTGCTGGTTGCAGGAAGTGCCAAGTCTGCC-3′. Cryostat sections (25 μm) of brains harvested from 11-week (PW11)-old mice (C57BL/6J) were used. After exposing the slides to film to obtain an initial image, the slides were dipped in NTB2 nuclear emulsion (Eastman Kodak) and exposed for 1 month at 4 °C. To control for the specificity of the hybridization signal, parallel experiments were also performed in the presence of a 50-fold excess of an unlabeled oligonucleotide probe.
Quantitative Real-time PCR
Quantitative real-time PCR was performed in an ABI PRISM 7700 sequence detection system (Applied Biosystems) using the SYBR Green PCR master mix (Applied Biosystems), according to the method described previously (29, 30). RNA isolation and the PCR conditions are described in the supplemental Experimental Procedures.
Immunostaining
The procedures used to process cortical cultures for immunostaining have been described previously (31).
Transfection into NIH3T3 Cells and Cortical Neurons
Transfection of NIH3T3 cells was performed using Lipofectamine Plus reagents according to the manufacturer's instructions (Invitrogen). After cells were exposed to the transfection reagents for 4 h, the transfection medium was replaced with fresh medium. The cells were subsequently used for Western blotting at the times indicated after transfection. For cortical neurons, cells cultured for 7 days were transfected using the calcium phosphate precipitation method as described previously (25).
Reporter Assay
Transcriptional activity was monitored using either the firefly luciferase or β-galactosidase activity as described previously (25). Cortical neurons were transfected with plasmids (4 μg/well) in the following ratios: reporter vector/expression vector = 1:3; firefly luciferase/β-galactosidase = 10:1.
Morphological Analysis
To monitor the neuronal morphology of cortical neurons, cells were transfected with a GFP expression vector using the calcium phosphate precipitation method. Cells were immunostained at the times indicated and then processed by microscopy (BX50-34-FLA-1; Olympus) as described previously (25). Sholl analysis was performed for evaluating dendritic complexity. In brief, a circle with a radius of 20, 40, 60, 80, 100, 120, 140, 160, 180, or 200 μm was centered on the cell body, and the number of intersections with GFP-positive dendrites was recorded. Scion Image software (Scion) was used for the measurement of dendritic lengths. The length was measured by tracing all of the dendrites starting at the cell body. More than 20 neurons were evaluated for each construct in each of at least three independent experiments. We confirmed that GFP-positive cells used for morphological analysis were MAP2-positive neurons through this study (for example see supplemental Fig. S1).
Western Blotting
Protein extracts from NIH3T3 cells, cortical neurons, and brain tissues were prepared according to the method described previously (25). More information is provided in the supplemental Experimental Procedures. Cytoplasmic and nuclear extracts of cortical neurons were prepared as described previously (32, 33). Protease and phosphatase inhibitors (20 mm β-glycerophosphate, 10 μg/ml aprotinin, 10 μg/ml leupeptin, 1 mm sodium orthovanadate) were added to all extraction buffers. Protein detection was carried out with the enhanced chemiluminescence (ECL) protocol (GE Healthcare). For the detection of endogenous MKL protein within cortical neurons, the signal was further enhanced by Can Get Signal (Toyobo).
RNA Interference
Plasmid construction for expressing small interfering RNA (siRNA) and the assessment of the plasmids are described in the supplemental Experimental Procedures.
Statistical Analysis
The statistical significance of the differences was analyzed by Student's t test.
RESULTS
MKL2 Is Highly Enriched and Developmentally Expressed in the Forebrain
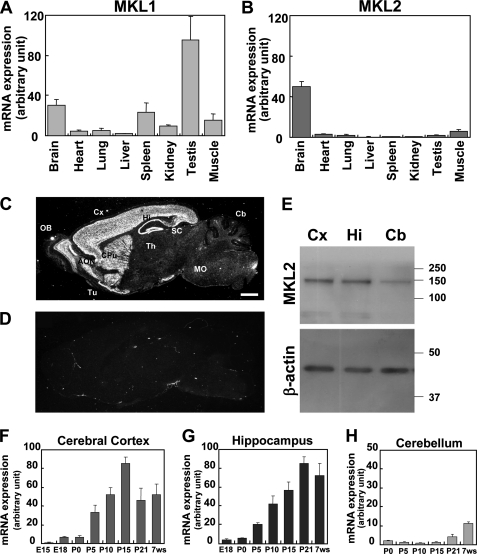
The tissue distribution of the MKL family mRNA was ascertained by performing quantitative PCR analyses with cDNA derived from several tissues. As shown in Fig. 1A, MKL1 was highly expressed in the testis. Prominent MKL1 mRNA expression was also observed in the brain and spleen. Although we detected MKL1 mRNA expression in other tissues, the level was relatively low. In contrast, MKL2 mRNA was highly expressed only in the brain (Fig. 1B). In other tissues, the expression level was relatively low.
FIGURE 1.
Tissue and brain distribution of MKL1/2 and regional expression of MKL2 mRNA in the developing mouse brain. A and B, cDNA derived from several tissues (brain, heart, lung, liver, spleen, kidney, testis, and muscle) was subjected to real-time quantitative PCR analysis with MKL1- (A) or MKL2- (B) specific primers. Data represent the means ± S.D. (error bars) from three independent experiments. C and D, regional expression of MKL2 mRNA in the brain was determined by in situ hybridization. Autoradiograms of sagittal sections from an adult mouse brain (P11W) were hybridized with a 35S-labeled oligonucleotide probe for MKL2 in the absence (C) or presence (D) of a 50-fold excess of the unlabeled probe. Note the prominent expression of MKL2 in anterior olfactory nuclei (AON), cerebral cortex (Cx), caudate putamen (CPu), hippocampal formation (Hi), olfactory bulb (OB), and olfactory tubercle (Tu); MO, medulla oblongata; SC, superior colliculus; Th, thalamus. Scale bar, 1 mm. E, MKL2 protein expression is shown. Lysates, extracted from adult mouse cerebral cortex (Cx), hippocampus (Hi), and cerebellum (Cb), were processed by Western blotting with an anti-MKL2 antibody. The results demonstrate similar levels of MKL2 present in the cerebral cortex and hippocampus with lower amounts in the cerebellum. The β-actin bands are shown as a loading control. F–H, quantitative PCR analyses of MKL2 mRNA levels in the developing mouse brain were performed. Samples were prepared from the cerebral cortex (F), hippocampus (G), and cerebellum (H). E15, embryonic day 15; E18, embryonic day 18; P0, postnatal day 0 (day of birth); P5, postnatal day 5; P10, postnatal day 10; P15, postnatal day 15; P21, postnatal day 21; 7ws, 7th week. Bar graphs represent the mean ± S.D. from three independent experiments.
In situ hybridization was performed to examine the distribution of MKL2 mRNA in the brain. We found that MKL2 mRNA expression was restricted to the telencephalon, including the cerebral cortex, hippocampus, olfactory bulb, and caudate putamen (Fig. 1C). Hybridization was completely abolished by the inclusion of a 50-fold excess of the unlabeled probe (Fig. 1D), thereby confirming the specificity of the hybridization pattern observed. We next checked MKL2 protein expression. Western blotting revealed high levels of MKL2 protein in the lysates derived from the cerebral cortex and hippocampus, with lower levels in the cerebellum (Fig. 1E).
Quantitative PCR analyses were performed to assess the developmental profile of MKL2 mRNA expression. During development, the expression level of MKL2 mRNA increased after P0 in both the cerebral cortex and the hippocampus (Fig. 1, F and G). In contrast, in the cerebellum, the expression level remained low until P15. Even after P21, a drastic increase was not observed (Fig. 1H).
Effect of MKL2 on SRF-mediated Transcription and Dendritic Morphology in Cortical Neurons
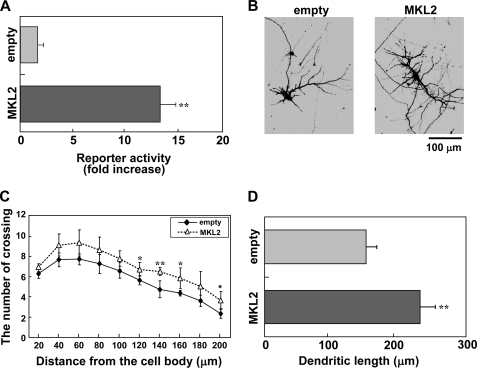
As shown in Fig. 1, the expression of MKL2 is more specific than that of MKL1 in the brain. Consequently, we focused on the function of MKL2 in neurons. Initially, we examined whether wild-type MKL2 induces SRF-mediated transcriptional activation. Overexpression of myc-tagged MKL2 resulted in an increase in the activation of a promoter carrying five copies of the SRE (SRE-Luc) in cortical neurons (Fig. 2A). In contrast, MKL2 did not activate a promoter carrying four copies of a cAMP response element (CRE-Luc) in cortical neurons (data not shown). To check the effect of MKL2 on neuronal morphology, an MKL2-expressing construct was cotransfected with a green fluorescent protein (GFP) plasmid into cortical neurons and the cultures processed by immunostaining. As shown in Fig. 2B, MKL2 promoted dendritic complexity. Double staining with anti-GFP and anti-MAP2 antibodies revealed that MKL2- and GFP-expressing cells were neurons (supplemental Fig. S1A). To quantify the effect on dendritic morphology, Sholl analysis was performed. Transfection with the wild-type MKL2 was found to affect dendritic processes (Fig. 2C). Furthermore, MKL2 also increased the total dendritic length (Fig. 2D).
FIGURE 2.
Overexpression of MKL2 resulted in SRF-mediated transcriptional activation and dendritic complexity. A, increased level of SRF-mediated transcription by the overexpression of MKL2. An empty vector (empty) or myc-tagged MKL2 expression vector (MKL2) (3 μg/well) was cotransfected with luciferase and β-galactosidase reporter vectors, SRE-Luc and RSV-βgal, respectively (1 μg/well), in cortical neurons. Luciferase or β-galactosidase activity was measured 48 h after transfection. The β-galactosidase reporter vector was used as an internal control. Bar graphs represent the mean ± S.D. from four samples. The same trends were obtained from at least two independent experiments. **, p < 0.01 versus control. B–D, MKL2 overexpression modulation of dendritic morphology. B, immunofluorescent images of cortical neurons expressing GFP (2 μg/well) and either the empty vector (empty: left panel, 2 μg/well) or the myc-tagged MKL2 construct (MKL2: right panel, 2 μg/well). Cells were fixed 48 h after transfection. Cells expressing GFP were MAP2-positive (supplemental Fig. S1A). C and D, dendritic complexity analyzed in the experimental conditions shown in B. Graphs represent the mean ± S.D. from four independent experiments. C, Sholl analysis. *, p < 0.05 versus control; **, p < 0.01 versus control. D, dendritic length. **, p < 0.01 versus control.
Activin Increases the SRF-mediated Transcriptional Response and the Dendritic Number and Length
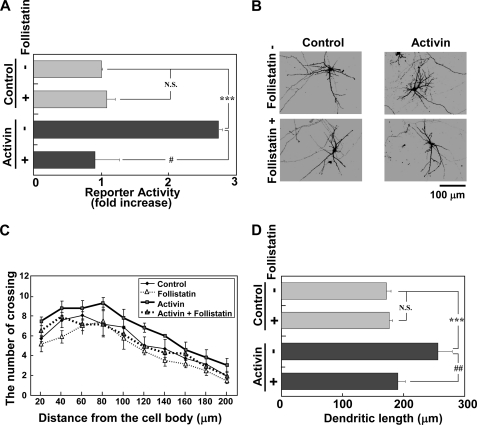
Recently, it has been reported that TGF-β1 triggers the nuclear translocation of MKL and regulates epithelial-mesenchymal transition via SRF-dependent and -independent gene induction in nonneuronal cells (22). Among the TGF-β superfamily, activin appears to be a strong modulator of neuronal function because it is expressed activity-dependently in neurons and plays a crucial role in dendritic spine morphology, neurogenesis, hippocampal development, and long-term memory (34–39). In addition, activin receptor ActRII is highly expressed in the forebrain regions (40). These findings prompted us to investigate whether activin promotes SRF-mediated transcription and regulates the morphology of cortical neurons. As expected, the treatment of cortical neurons with activin resulted in an increase of the SRF-mediated transcription (Fig. 3A). The increase of CREB-mediated transcription (CRE-Luc) was also observed following treatment with activin (supplemental Fig. S2A); however, the level was relatively low compared with the transcription level of SRE-Luc (supplemental Fig. S2B). The activation of SRF-mediated transcription did not drastically or rapidly increase, but showed a rather slow increase to 24 h and was constant 48 h after treatment with activin (supplemental Fig. S2C). Activin also promoted dendritic complexity (Fig. 3B). The dendritic complexity altered slowly and was time-dependent (supplemental Fig. S3). Sholl analysis supported this finding quantitatively (Fig. 3C and supplemental Fig. S3). Total dendritic length was also up-regulated by activin (Fig. 3D). The cells used for the measurement of dendritic number and length were MAP2-positive neurons (supplemental Fig. S1B). The effects of activin on SRF-mediated transcription and dendritic morphology were completely blocked by follistatin, an inhibitor and binding partner of activin (Fig. 3, Activin + Follistatin). However, follistatin did not affect SRF-mediated transcription and the morphology of neurons in the absence of activin (Fig. 3, Control).
FIGURE 3.
Regulation of SRF-mediated transcription and dendritic morphology by activin. Follistatin (250 ng/ml) was added to the medium 30 min before activin (100 ng/ml) stimulation. A, activation of SRF-mediated transcription by activin and its inhibition by follistatin. The reporter vectors were transfected into cortical neurons. Twenty-four hours later, the cells were stimulated without (control) or with activin (100 ng/ml) for 24 h. Bar graphs represent the mean ± S.D. from four samples. The same trends were obtained from at least two independent experiments. ***, p < 0.001; #, p < 0.05; N.S., not significant, p > 0.05. B, activin-induced dendritic complexity and its inhibition by follistatin. C and D, dendritic complexity analyzed in the experimental conditions shown in B. Graphs represent the mean ± S.D. from four independent experiments. C, Sholl analysis. Supplemental Table 1 shows the statistical significance. D, dendritic length. ***, p < 0.001; ##, p < 0.01; N.S., p > 0.05.
Requirement of de Novo RNA and Protein Synthesis for Activin-induced Dendritic Complexity
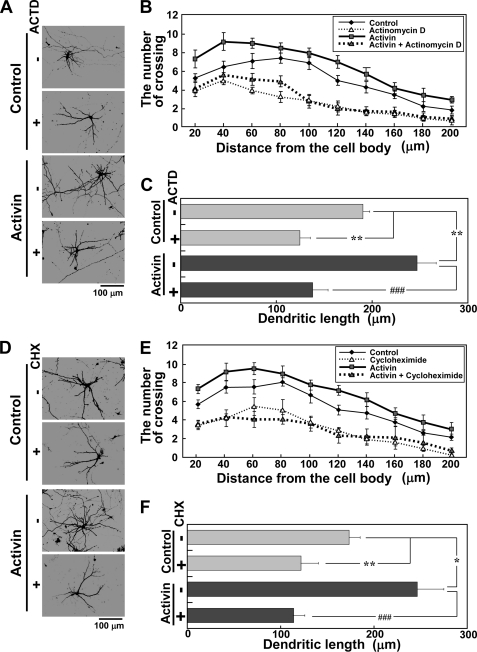
As described above, activin promoted SRF-mediated transcription and dendritic complexity, and the effect was slow and time-dependent. We next examined whether newly synthesized RNA and proteins are required for activin-mediated dendritic complexity. Activin-mediated dendritic complexity was completely blocked by actinomycin D and cycloheximide, RNA synthesis and protein synthesis inhibitors, respectively (Fig. 4). Actinomycin D and cycloheximide also reduced the dendritic complexity of neurons in the absence of activin (Fig. 4, Control). These findings suggest that dendritic complexity depends upon de novo RNA and protein synthesis.
FIGURE 4.
Effects of RNA and protein synthesis inhibitors on activin-induced dendritic complexity. The experimental procedures used are the same as presented in Fig. 3, C and D. Actinomycin D (ACTD, 1 μg/ml) (A–C) or cycloheximide (CHX, 2 μg/ml) (D–F) was added to the medium 30 min before activin (100 ng/ml) stimulation. A and D, inhibition of activin-induced dendritic complexity by actinomycin D (A) and cycloheximide (D). B–F, dendritic complexity analyzed in the experimental conditions shown in A and D. Graphs represent the mean ± S.D. from four independent experiments. B and E, Sholl analysis. Supplemental Table 1 shows the statistical significance. C and F, dendritic length. *, p < 0.05; **, p < 0.01; ###, p < 0.001.
SRF Mediates Activin-induced Dendritic Complexity
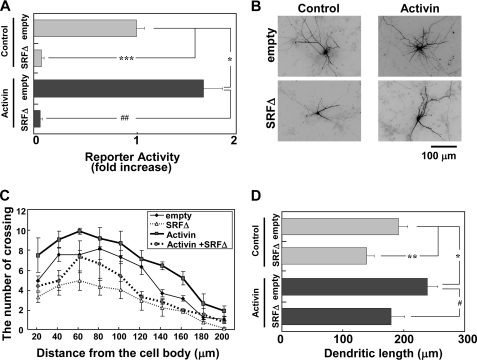
The finding that activin modulates dendritic morphology in a de novo RNA synthesis-dependent manner led us to identify what transcription factors mediate activin-induced dendritic complexity. As shown in Fig. 5A, a dominant negative SRF mutant, SRFΔ, blocked SRF transcriptional activation not only in activin-stimulated neurons but also in the control neurons without activin. Furthermore, SRFΔ inhibited the dendritic complexity of neurons with or without activin (Fig. 5, B and C). These findings suggest that SRF mediates activin-induced dendritic complexity.
FIGURE 5.
SRF mediates activin-induced dendritic complexity. Activin stimulation (100 ng/ml) was carried out for 24 h. A, effect of SRFΔ on activin-induced SRF transcriptional activation. An empty vector (empty) or SRFΔ (3 μg/well) was cotransfected with reporter vectors (1 μg/well). Activin was added 24 h after transfection. Bar graphs represent the mean ± S.D. from three samples. The same trends were obtained from at least two independent experiments. *, p < 0.01; ***, p < 0.001; ##, p < 0.01. B, attenuation of dendritic complexity by SRFΔ. Immunofluorescent images of cortical neurons expressing GFP (2 μg/well) and either the empty vector (empty, 2 μg/well) or SRFΔ (2 μg/well). Activin was added 24 h after transfection. C and D, dendritic complexity analyzed in the experimental conditions shown in B. Graphs represent the mean ± S.D. (error bars) from three independent experiments. C, Sholl analysis. Supplemental Table 1 shows the statistical significance. D, dendritic length. *, p < 0.05; **, p < 0.01; #, p < 0.05.
MKL Knockdown Reduces Activin-induced SRF Transcriptional Activation and Dendritic Complexity
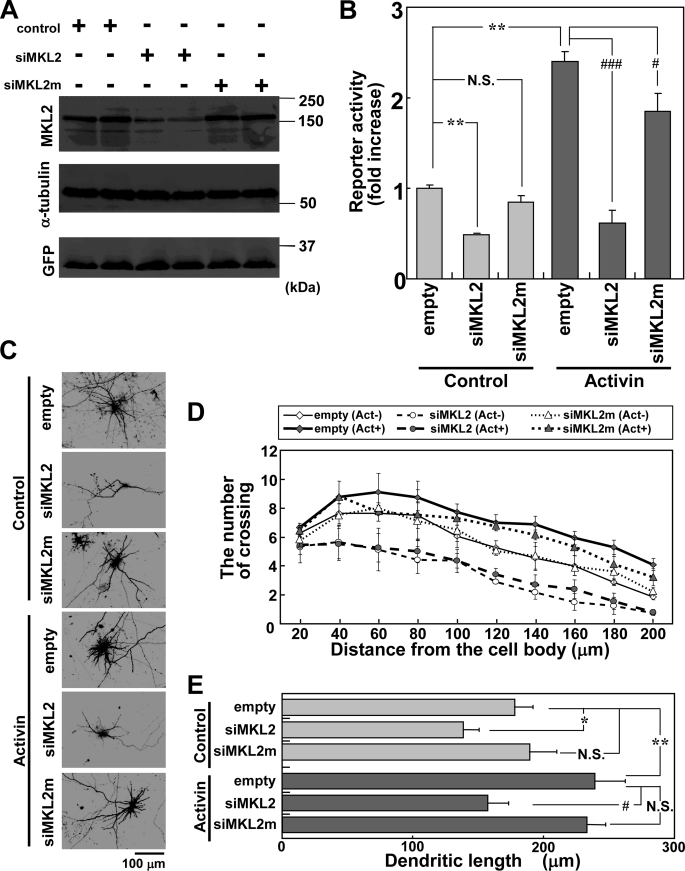
Several studies suggest that MKL/SRF promotes the expression of cytoskeletal genes involved in the alteration of cell shape (11, 12). In this study, we found that overexpression of MKL2 increased dendritic number and length. We next examined whether an RNAi-mediated knockdown of endogenous MKL2 suppresses the SRF coactivation function and/or affects activin-induced dendritic complexity. Initially, the specificity of siRNA for MKL1 and MKL2 was confirmed. The pSUPER-mrMKL1 (siMKL1) vector decreased MKL1 expression, but not MKL2 in NIH3T3 cells (supplemental Fig. S4, A and B). Conversely, pSUPER-mrMKL2 (siMKL2) decreased MKL2 expression, but not MKL1 (supplemental Fig. S4, A and B). Therefore, these findings indicate that both siMKL1 and siMKL2 are specific for their target sequences. Furthermore, a pSUPER-mrMKL2 mutant (siMKL2m) was constructed, which contains two base pair mismatches. The effect of the siMKL2m was examined. Western blotting showed that MKL2 siRNA attenuated the expression of myc-tagged MKL2 at 72 h after transfection. In contrast, the control vector and siMKL2m did not affect MKL2 expression (Fig. 6A). Using these siRNA constructs, we assessed how the loss of MKL2 affects SRF-mediated transcription and the morphology of cortical neurons. We found that siMKL2 inhibited the SRF transcriptional activity stimulated with or without activin, but siMKL2m did not (Fig. 6B). The siMKL1 had the same effect as siMKL2 (supplemental Fig. S5A). As shown in Fig. 6C, the siMKL2, but not the mutant siRNA sequence, reduced the number of dendritic processes not only in the activin-stimulated neurons, but also in the control neurons without activin. Quantification of this response by Sholl analysis is presented in Fig. 6D. The dendritic length was also reduced by expression of siMKL2, but not that of siMKL2m (Fig. 6E). We also tested the effect of the siMKL1 on the dendritic morphology and found that the effect was almost the same as observed for siMKL2 (supplemental Fig. S5, B–D). Furthermore, the effects of two types of dominant negative MKL1 mutants on SRF transcriptional responses were examined. The ΔB1B2 mutant, which interferes with nuclear import of MKL, and the C471Δ mutant, which lacks the transcriptional activation domain (supplemental Fig. S6A), were observed to inhibit the increase in dendritic number as reported previously (25). Both mutants blocked the SRF transcriptional responses stimulated with or without activin (supplemental Fig. S6B). Taken together, these findings indicate that MKL1 and MKL2 are involved in activin-induced SRF transcriptional activation and dendritic complexity.
FIGURE 6.
MKL2 siRNA reduces activin-induced SRF transcriptional activation and dendritic complexity. A, Myc-MKL2 (0.8 μg/well) cotransfected with GFP (0.4 μg/well) and pSUPER (empty, 0.8 μg/well) or pSUPER-mrMKL2 (siMKL2, 0.8 μg/well) or pSUPER-mrMKL2mut (siMKL2m, 0.8 μg/well) into NIH3T3 cells. Seventy-two hours later, the samples were subjected to Western blotting with anti-myc (top), anti-α-tubulin for constant sample applications (middle), or anti-GFP antibodies for constant transfection efficiencies (bottom). The expression of myc-MKL2 displays a clear reduction with siMKL2, but not with siMKL2m. B–E, activin (100 ng/ml) stimulation carried out for 24 h. B, effect of MKL2 siRNA on SRE-reporter activity. Reporter vectors (1 μg/well) were cotransfected with an empty vector or siMKL2 or siMKL2m (3 μg/well) into cortical neurons, and activin was added 48 h after transfection. Bar graphs present the mean ± S.D. from four samples. The same trends were obtained from at least two independent experiments. **, p < 0.01; #, p < 0.05; ###, p < 0.001; N.S., p > 0.05. C, MKL2 siRNA reduction of dendritic complexity. Empty (pSUPER), siMKL2 or siMKL2m (2 μg/well) vectors were cotransfected with a GFP construct (2 μg/well), and the neurons were stimulated with activin 48 h after transfection. After a further 24 h, the cells were fixed and subjected to immunostaining. D and E, dendritic complexity analyzed in the experimental conditions shown in C. Graphs represent the mean ± S.D. from five independent experiments. D, Sholl analysis. Supplemental Table 1 shows the statistical significance. E, dendritic length. *, p < 0.05; **, p < 0.01; #, p < 0.05; N.S., p > 0.05.
Activin Promotes Nuclear Export of the MKL-interacting Corepressor, SCAI, in Cortical Neurons
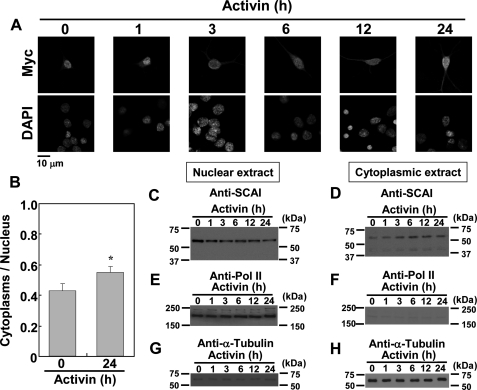
Our experiments with cytoplasmic and nuclear extracts revealed that MKL1 and MKL2 are localized to both the cytoplasm and the nucleus in cortical neurons, and a drastic change in the nuclear to cytoplasmic ratio of the total amounts of MKL was not observed even when cells were stimulated with activin (supplemental Fig. S7). In addition, activin did not drastically alter MKL1 and MKL2 mRNA and protein expression (data not shown). These findings suggest that activin stimulates MKL/SRF-dependent transcription and dendritic complexity via unknown mechanisms, but neither by modifying MKL protein localization drastically nor by changing their levels. Recent evidence suggests that SCAI is a novel protein that reduces cancer cell invasion through acting downstream of Rho GTPase and actin and through inhibiting MKL1/SRF transcriptional activation (15). Next, we focused upon the role of SCAI in neurons. In unstimulated cortical neurons, myc-tagged SCAI was localized mainly in the nucleus (Fig. 7A, 0 h). However, the localization changed in a time-dependent manner when the cells were stimulated with activin (Fig. 7, A and B); that is, activin-stimulation resulted in an increase in the retention of myc-tagged SCAI in the cytoplasm (Fig. 7A). The increase in the ratio of cytoplasmic localization of myc-SCAI was also observed by activin stimulation (Fig. 7B). SCAI protein was endogenously expressed in cortical neurons (data not shown). Furthermore, the nuclear level of endogenous SCAI decreased, and conversely, the cytoplasmic level increased after activin stimulation (Fig. 7, C and D). These findings indicate that SCAI appears to move out of the nucleus after activin stimulation.
FIGURE 7.
Activin stimulates nuclear export of SCAI in cortical neurons. A, time course of nuclear export of SCAI induced by activin. The myc-tagged SCAI vector (2 μg/well) was co-transfected with a GFP construct (2 μg/well), and the neurons were stimulated with activin (100 ng/ml) at the indicated times. Myc-SCAI and nuclei were stained by anti-myc and DAPI (upper images and lower images), respectively. B, ratio of cytoplasmic to nuclear SCAI localization in the experimental conditions shown in A at 0 or 24 h after activin stimulation. The fluorescent intensities of the cytoplasm and nucleus were measured by ImageJ software (National Institutes of Health). Graphs represent the mean ± S.D. from three independent experiments. *, p < 0.05. C–H, detection of endogenous SCAI with nuclear and cytoplasmic extracts of activin-stimulated cortical neurons. Cortical neurons at 9 days in vitro culturing were stimulated with activin for the times indicated. Subsequently, nuclear and cytoplasmic extracts were prepared and subjected to Western blotting analysis. C, E, and G, Western blotting with nuclear extracts; D, F, and H, Western blotting with cytoplasmic extracts. C and D, detection of the endogenous SCAI protein with an anti-SCAI antibody. E–H, separation of nuclear and cytoplasmic extracts confirmed with antibodies against RNA polymerase II (Pol II) (E and F) and α-tubulin (G and H), which are nuclear and cytoplasmic markers, respectively.
SCAI Inhibits Activin-induced SRF-mediated Transcriptional Activation and Dendritic Complexity
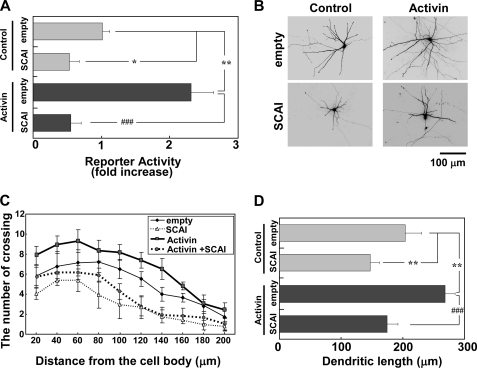
As shown in Fig. 7, nuclear export of SCAI was promoted by activin stimulation. As such, does SCAI affect dendritic morphology? To test this, SCAI function was examined by overexpressing myc-SCAI in cortical neurons. Initially, we examined whether SCAI functions as a repressor of SRF-mediated transcription. As expected, SCAI blocked SRF transcriptional activation not only in activin-stimulated neurons but also in the control neurons without activin (Fig. 8A). SCAI did not significantly reduce CREB-mediated transcription (data not shown). The effect of SCAI on dendritic morphology was also investigated. As shown in Fig. 8B, SCAI reduced the dendritic complexity induced by activin. Sholl analysis and the measurement of dendritic length support this observation (Fig. 8, C and D). Taken together, these findings indicate that the enhancement of MKL/SRF-mediated transcription and dendritic complexity by activin is due to the exclusion of SCAI from the nucleus.
FIGURE 8.
SCAI inhibits activin-induced SRF-mediated transcription and dendritic complexity. Activin stimulation (100 ng/ml) was carried out for 24 h. A, effect of SCAI on activin-induced SRF transcriptional activation. An empty vector (empty) or SCAI (3 μg/well) was cotransfected with the reporter vectors (1 μg/well). Activin was added 24 h after transfection. Bar graphs represent the mean ± S.D. from three samples. The same trends were obtained from at least two independent experiments. *, p < 0.05; **, p < 0.01; ###, p < 0.001. B, attenuation of dendritic complexity by SCAI. Immunofluorescent images of cortical neurons expressing GFP (2 μg/well) and either the empty vector (empty, 2 μg/well) or SCAI (2 μg/well) are shown. Activin was added 24 h after transfection. C and D, dendritic complexity analyzed in the experimental conditions shown in B. Graphs represent the mean ± S.D. from three independent experiments. C, Sholl analysis. Supplemental Table 1 shows the statistical significance. D, dendritic length. **, p < 0.01; ###, p < 0.001; N.S., p > 0.05.
DISCUSSION
This study examining MKL expression and function in neurons has yielded several important findings. Quantitative PCR analysis with cDNA derived from several tissues revealed that, unlike the broad distribution of MKL1 mRNA, MKL2 mRNA is enriched in the brain (Fig. 1, A and B). In addition, the in situ hybridization study showed that MKL2 is selectively expressed in several forebrain areas (Fig. 1, C and D). Characterization of the developmental profile of MKL2 mRNA showed that its expression rises during the postnatal week and is sustained into adulthood (Fig. 1, F–H). Taking our previous study into consideration, the up-regulation of MKL2 expression is similar to that of MKL1 expression during brain development (25). Although several studies including ours indicate that MKL1 and MKL2 function as the SRF coactivators and modulators of neuronal morphology (5, 23, 25, 41, and this study), MKL2 appears to be expressed in different areas of the brain and is more confined to the forebrain compared with the levels of MKL1 in the brain. As such, it is plausible that MKL1 and MKL2 play different roles in neuronal development and function. Moreover, MKL1 mutant mice display a different phenotype from MKL2, i.e. the failure to maintain a differentiated state of mammary myoepithelial cells during lactation (42, 43). A null mutation in the MKL2 gene displays an embryonic lethality phenotype, due to a spectrum of cardiovascular defects (44) or because of the cardiac outflow tract (45). To understand precisely the functional differences between MKL1 and MKL2 in the brain, further studies aimed at finding molecules that interact with the MKL family members in the brain and the assessment of the role of the MKL1/2-SRF signaling pathway on neuronal development and function in vivo, especially in conditional MKL knock-out mice, are warranted.
We have demonstrated that activin is an extracellular ligand upstream of MKL/SRF that promotes the dendritic complexity of cortical neurons (Figs. 5 and 6 and supplemental Fig. S5). Activin-induced dendritic complexity was observed to change slowly (supplemental Fig. S3) and was dependent on de novo protein and RNA synthesis (Fig. 4). In addition, MKL up-regulated the promoter of the β-actin gene, which is a cytoskeletal SRF target gene in cortical neurons (supplemental Fig. S9). In relation to dendritic spine morphology, activin increases the spine length of hippocampal neurons in a protein and RNA synthesis-independent manner (36). Therefore, our observation that activin promotes dendritic complexity may represent a late phase phenomenon that occurs after an increase in the number or strength of synaptic contacts that are made during the early phase of response to activin.
What is the mechanism by which activin can transduce the signal to MKL in regulating dendritic morphology? We found that both MKL1 and MKL2 are localized to both the cytoplasm and the nucleus in cortical neurons, and a drastic change in the nuclear/cytoplasmic ratio of the total amounts of MKL was not observed even when cells were stimulated with activin (supplemental Fig. S7). The expression levels of MKL1 and MKL2 were also not altered (data not shown). On the other hand, the cytoplasmic localization of SCAI, a repressor for MKL/SRF transcription, was observed to increase by activin-stimulated neurons (Fig. 7). Furthermore, overexpression of SCAI blocked activin-induced SRF transcriptional activation and dendritic complexity (Fig. 8). Collectively, these findings suggest that the exclusion of SCAI from the nucleus, rather than direct modulation of MKL, plays a major role in activin-induced dendritic complexity. These observations represent evidence that SCAI influences neuronal morphology and that its nucleocytoplasmic shuttling is regulated by extracellular ligands.
We found that C3 transferase, which is a Rho inhibitor, dominant negative SRF, and MKL1 or MKL2 siRNA reduced the dendritic complexity of neurons in the presence or absence of activin (Figs. 5 and 6 and supplemental Fig. S8). Conversely, follistatin, an inhibitor of activin, did not affect dendritic complexity of neurons in the absence of activin (Fig. 3). MKL is regulated by Rho and actin remodeling (14, 46). ERK1/2-mediated phosphorylation, which partially depends upon Rho, can modulate the transcriptional function of the MKL family (14, 47). Thus, these findings indicate that constitutive MKL/SRF transcription in unstimulated cortical neurons, at least in part, contributes to dendritic complexity in a Rho-dependent manner.
BDNF and NGF are the upstream signals that regulate neuronal morphology. Recent evidence suggests that BDNF and NGF also activate MKL/SRF transcriptional responses (24, 26). Although it is unknown whether BDNF and NGF affect dendritic morphology in an MKL-dependent manner, it would be interesting to examine whether such neurotrophin signals and activin signals converge on dendritic morphology via a common pathway, such as the cytoplasmic retention of SCAI, or convey distinct information spatiotemporally.
Activin is known to regulate a variety of biological processes, especially brain functions such as adult neurogenesis and anxiety-related behavior (38, 48, 49). Elucidating whether such activin-regulated neuronal function is also mediated by the MKL family is important and may shed light on elucidating the novel mechanism by which structural alteration links to gene expression for neuronal plasticity.
Supplementary Material
Acknowledgment
We thank Dr. K. Inokuchi (University of Toyama, Japan) for helpful comments on this manuscript.
This work was supported by grants-in-aid from the Ministry of Education, Culture, Sports, Science, and Technology of Japan (Projects 17790055, 19790052, 22590080 (A. T.) and 20390023 (M. T.)) and by research grants from the Hayashi Memorial Foundation for Female Natural Scientists (A. T.), Foundation of the First Bank of Toyama (A. T.), the Takeda Science Foundation (A. T.), the Narishige Neuroscience Research Foundation (A. T.), the Tokyo Biochemical Research Foundation (A. T.), the Uehara Memorial Foundation (A. T.), and by the Comprehensive Brain Science Network.

The on-line version of this article (available at http://www.jbc.org) contains supplemental Experimental Procedures and additional references, Figs. S1–S9, and Table 1.
- SRF
- serum response factor
- CRE
- cAMP response element
- CREB
- cAMP response element-binding protein
- Luc
- luciferase
- MKL
- megakaryoblastic leukemia
- SCAI
- suppressor of cancer cell invasion
- SRFΔ
- dominant negative SRF mutant.
REFERENCES
- 1.Treisman R. (1995) EMBO J. 14, 4905–4913 [DOI] [PMC free article] [PubMed] [Google Scholar]
- 2.Ramanan N., Shen Y., Sarsfield S., Lemberger T., Schütz G., Linden D. J., Ginty D. D. (2005) Nat. Neurosci. 8, 759–767 [DOI] [PubMed] [Google Scholar]
- 3.Etkin A., Alarcón J. M., Weisberg S. P., Touzani K., Huang Y. Y., Nordheim A., Kandel E. R. (2006) Neuron 50, 127–143 [DOI] [PubMed] [Google Scholar]
- 4.Alberti S., Krause S. M., Kretz O., Philippar U., Lemberger T., Casanova E., Wiebel F. F., Schwarz H., Frotscher M., Schütz G., Nordheim A. (2005) Proc. Natl. Acad. Sci. U.S.A. 102, 6148–6153 [DOI] [PMC free article] [PubMed] [Google Scholar]
- 5.Knöll B., Kretz O., Fiedler C., Alberti S., Schütz G., Frotscher M., Nordheim A. (2006) Nat. Neurosci. 9, 195–204 [DOI] [PubMed] [Google Scholar]
- 6.Knöll B., Nordheim A. (2009) Trends Neurosci. 32, 432–442 [DOI] [PubMed] [Google Scholar]
- 7.Buchwalter G., Gross C., Wasylyk B. (2004) Gene 324, 1–14 [DOI] [PubMed] [Google Scholar]
- 8.Wang D. Z., Li S., Hockemeyer D., Sutherland L., Wang Z., Schratt G., Richardson J. A., Nordheim A., Olson E. N. (2002) Proc. Natl. Acad. U.S.A. 99, 14855–14860 [DOI] [PMC free article] [PubMed] [Google Scholar]
- 9.Sasazuki T., Sawada T., Sakon S., Kitamura T., Kishi T., Okazaki T., Katano M., Tanaka M., Watanabe M., Yagita H., Okumura K., Nakano H. (2002) J. Biol. Chem. 277, 28853–28860 [DOI] [PubMed] [Google Scholar]
- 10.Cen B., Selvaraj A., Burgess R. C., Hitzler J. K., Ma Z., Morris S. W., Prywes R. (2003) Mol. Cell. Biol. 23, 6597–6608 [DOI] [PMC free article] [PubMed] [Google Scholar]
- 11.Selvaraj A., Prywes R. (2003) J. Biol. Chem. 278, 41977–41987 [DOI] [PubMed] [Google Scholar]
- 12.Cen B., Selvaraj A., Prywes R. (2004) J. Cell. Biochem. 93, 74–82 [DOI] [PubMed] [Google Scholar]
- 13.Pipes G. C., Creemers E. E., Olson E. N. (2006) Genes Dev. 20, 1545–1556 [DOI] [PubMed] [Google Scholar]
- 14.Miralles F., Posern G., Zaromytidou A. I., Treisman R. (2003) Cell 113, 329–342 [DOI] [PubMed] [Google Scholar]
- 15.Brandt D. T., Baarlink C., Kitzing T. M., Kremmer E., Ivaska J., Nollau P., Grosse R. (2009) Nat. Cell Biol. 11, 557–568 [DOI] [PubMed] [Google Scholar]
- 16.Massagué J., Blain S. W., Lo R. S. (2000) Cell 103, 295–309 [DOI] [PubMed] [Google Scholar]
- 17.Derynck R., Akhurst R. J. (2007) Nat. Cell Biol. 9, 1000–1004 [DOI] [PubMed] [Google Scholar]
- 18.Tsuchida K., Nakatani M., Hitachi K., Uezumi A., Sunada Y., Ageta H., Inokuchi K. (2009) Cell. Commun. Signal. 7, 15. [DOI] [PMC free article] [PubMed] [Google Scholar]
- 19.Xu L. (2006) Biochim. Biophys. Acta 1759, 503–513 [DOI] [PMC free article] [PubMed] [Google Scholar]
- 20.Zhang Y. E. (2009) Cell Res. 19, 128–139 [DOI] [PMC free article] [PubMed] [Google Scholar]
- 21.Qiu P., Feng X. H., Li L. (2003) J. Mol. Cell. Cardiol. 35, 1407–1420 [DOI] [PubMed] [Google Scholar]
- 22.Morita T., Mayanagi T., Sobue K. (2007) J. Cell Biol. 179, 1027–1042 [DOI] [PMC free article] [PubMed] [Google Scholar]
- 23.Tabuchi A., Estevez M., Henderson J. A., Marx R., Shiota J., Nakano H., Baraban J. M. (2005) J. Neurochem. 94, 169–180 [DOI] [PubMed] [Google Scholar]
- 24.Kalita K., Kharebava G., Zheng J. J., Hetman M. (2006) J. Neurosci. 26, 10020–10032 [DOI] [PMC free article] [PubMed] [Google Scholar]
- 25.Shiota J., Ishikawa M., Sakagami H., Tsuda M., Baraban J. M., Tabuchi A. (2006) J. Neurochem. 98, 1778–1788 [DOI] [PubMed] [Google Scholar]
- 26.Wickramasinghe S. R., Alvania R. S., Ramanan N., Wood J. N., Mandai K., Ginty D. D. (2008) Neuron 58, 532–545 [DOI] [PMC free article] [PubMed] [Google Scholar]
- 27.Tabuchi A., Nakaoka R., Amano K., Yukimine M., Andoh T., Kuraishi Y., Tsuda M. (2000) J. Biol. Chem. 275, 17269–17275 [DOI] [PubMed] [Google Scholar]
- 28.Sakagami H., Saito S., Kitani T., Okuno S., Fujisawa H., Kondo H. (1998) Mol. Brain Res. 54, 311–315 [DOI] [PubMed] [Google Scholar]
- 29.Fukuchi M., Tabuchi A., Tsuda M. (2004) J. Biol. Chem. 279, 47856–47865 [DOI] [PubMed] [Google Scholar]
- 30.Yasuda M., Fukuchi M., Tabuchi A., Kawahara M., Tsuneki H., Azuma Y., Chiba Y., Tsuda M. (2007) J. Neurochem. 103, 626–636 [DOI] [PubMed] [Google Scholar]
- 31.Ishimaru N., Tabuchi A., Hara D., Hayashi H., Sugimoto T., Yasuhara M., Shiota J., Tsuda M. (2007) J. Neurochem. 100, 520–531 [DOI] [PubMed] [Google Scholar]
- 32.Schreiber E., Matthias P., Müller M. M., Schaffner W. (1989) Nucleic Acids Res. 17, 6419. [DOI] [PMC free article] [PubMed] [Google Scholar]
- 33.Tabuchi A., Sakaya H., Kisukeda T., Fushiki H., Tsuda M. (2002) J. Biol. Chem. 277, 35920–35931 [DOI] [PubMed] [Google Scholar]
- 34.Inokuchi K., Kato A., Hiraia K., Hishinuma F., Inoue M., Ozawa F. (1996) FEBS Lett. 382, 48–52 [DOI] [PubMed] [Google Scholar]
- 35.Andreasson K., Worley P. F. (1995) Neuroscience 69, 781–796 [DOI] [PubMed] [Google Scholar]
- 36.Shoji-Kasai Y., Ageta H., Hasegawa Y., Tsuchida K., Sugino H., Inokuchi K. (2007) J. Cell Sci. 120, 3830–3837 [DOI] [PubMed] [Google Scholar]
- 37.Sekiguchi M., Hayashi F., Tsuchida K., Inokuchi K. (2009) Neurosci. Lett. 452, 232–237 [DOI] [PubMed] [Google Scholar]
- 38.Ageta H., Murayama A., Migishima R., Kida S., Tsuchida K., Yokoyama M., Inokuchi K. (2008) PLoS One 3, e1869. [DOI] [PMC free article] [PubMed] [Google Scholar]
- 39.Ageta H., Ikegami S., Miura M., Masuda M., Migishima R., Hino T., Takashima N., Murayama A., Sugino H., Setou M., Kida S., Yokoyama M., Hasegawa Y., Tsuchida K., Aosaki T., Inokuchi K. (2010) Learn. Mem. 17, 176–185 [DOI] [PubMed] [Google Scholar]
- 40.Funaba M., Murata T., Fujimura H., Murata E., Abe M., Torii K. (1997) J. Neuroendocrinol. 9, 105–111 [DOI] [PubMed] [Google Scholar]
- 41.O'Sullivan N. C., Pickering M., Di Giacomo D., Loshcer J. S., Murphy K. J. (2010) Cereb. Cortex 20, 1915–1925 [DOI] [PubMed] [Google Scholar]
- 42.Li S., Chang S., Qi X., Richardson J. A., Olson E. N. (2006) Mol. Cell. Biol. 26, 5797–5808 [DOI] [PMC free article] [PubMed] [Google Scholar]
- 43.Sun Y., Boyd K., Xu W., Ma J., Jackson C. W., Fu A., Shillingford J. M., Robinson G. W., Hennighausen L., Hitzler J. K., Ma Z., Morris S. W. (2006) Mol. Cell. Biol. 26, 5809–5826 [DOI] [PMC free article] [PubMed] [Google Scholar]
- 44.Li J., Zhu X., Chen M., Cheng L., Zhou D., Lu M. M., Du K., Epstein J. A., Parmacek M. S. (2005) Proc. Natl. Acad. Sci. U.S.A. 102, 8916–8921 [DOI] [PMC free article] [PubMed] [Google Scholar]
- 45.Oh J., Richardson J. A., Olson E. N. (2005) Proc. Natl. Acad. Sci. U.S.A. 102, 15122–15127 [DOI] [PMC free article] [PubMed] [Google Scholar]
- 46.Stern S., Debre E., Stritt C., Berger J., Posern G., Knöll B. (2009) J. Neurosci. 29, 4512–4518 [DOI] [PMC free article] [PubMed] [Google Scholar]
- 47.Muehlich S., Wang R., Lee S. M., Lewis T. C., Dai C., Prywes R. (2008) Mol. Cell. Biol. 28, 6302–6313 [DOI] [PMC free article] [PubMed] [Google Scholar]
- 48.Zheng F., Adelsberger H., Müller M. R., Fritschy J. M., Werner S., Alzheimer C. (2009) Mol. Psychiatry 14, 332–346 [DOI] [PubMed] [Google Scholar]
- 49.Kitamura T., Saitoh Y., Takashima N., Murayama A., Niibori Y., Ageta H., Sekiguchi M., Sugiyama H., Inokuchi K. (2009) Cell 139, 814–827 [DOI] [PubMed] [Google Scholar]
Associated Data
This section collects any data citations, data availability statements, or supplementary materials included in this article.


