

Abstract
We have studied the mechanism of activation of native cardiac thin filaments by calcium and rigor myosin. The acceleration of the rate of 2′-deoxy-3′-O-(N-methylanthraniloyl)ADP (mdADP) dissociation from cardiac myosin-S1-mdADP-Pi and cardiac myosin-S1-mdADP by native cardiac muscle thin filaments was measured using double mixing stopped-flow fluorescence. Relative to inhibited thin filaments (no bound calcium or rigor S1), fully activated thin filaments (with both calcium and rigor-S1 bound) increase the rate of product dissociation from the physiologically important pre-power stroke myosin-mdADP-Pi by a factor of ∼75. This can be compared with only an ∼6-fold increase in the rate of nucleotide diphosphate dissociation from nonphysiological myosin-mdADP by the fully activated thin filaments relative to the fully inhibited thin filaments. These results show that physiological levels of regulation are not only dependent on the state of the thin filament but also on the conformation of the myosin. Less than 2-fold regulation is due to a change in affinity of myosin-ADP-Pi for thin filaments such as would be expected by a simple “steric blocking” of the myosin-binding site of the thin filament by tropomyosin. Although maximal activation requires both calcium and rigor myosin-S1 bound to the cardiac filament, association with a single ligand produces ∼70% maximal activation. This can be contrasted with skeletal thin filaments in which calcium alone only activated the rate of product dissociation ∼20% of maximum, and rigor myosin produces ∼30% maximal activation.
Keywords: Actin, ATPases, Calcium, Cardiac Muscle, Myosin, Calcium Regulation, Troponin
Introduction
In striated muscle, contractility is regulated by the thin filament, a protein complex containing F-actin, tropomyosin, and troponin (Tn).3 The core of the thin filament is a double-stranded helix of actin. Tropomyosin fits into the grooves of this helix, each molecule spanning seven actin monomers and interacting end-to-end with its neighbor. One molecule of troponin, itself a complex of three subunits I, C, and T, associates with one actotropomyosin unit (1). Although there is no atomic structure for the entire thin filament, the broad architectural detail has been worked out. Troponin is composed of a globular core consisting of the I and C subunits along with the carboxyl-terminal one-third of the T subunit (Tn-T2) and an extended tail that arises from the remainder of troponin-T (Tn-T1) (2–5). Subdomains have been identified within the globular core (6, 7). The so-called “IT” arm includes the high affinity metal ion sites of troponin-C (C-lobe) and a span of coiled-coil involving helical sections of troponin-T and -I. The regulatory head is a conformational switching center that consists of the low affinity calcium sites of troponin-C (N-lobe) and the troponin-I inhibitory peptide (8, 9), the orientation of which is calcium-sensitive. Structural changes associated with the binding of calcium to troponin, as well as rigor myosin binding to the thin filament, are thought to be relayed by way of tropomyosin (10, 11) and possibly actin as well (12) resulting in changes in myosin activation. Over the years, a number of models have been formulated to explain thin filament-based regulation (13–16). The model of Hill and co-workers (14) envisions two thin filament conformers of nonidentical affinity for myosin, with the fraction of each state dependent upon the bound ligand (either calcium or rigor myosin). The three-state model (16) included a thin filament state (‘blocked’) that did not associate with myosin, in addition to weakly binding (“closed”) and strongly binding (“open”) states. Formation of the open state is produced by the binding of ATP-free myosin to the thin filament but not calcium alone.
We have used double mixing stopped-flow fluorescence, which permits the selective generation of myosin intermediates (i.e. myosin-ATP ⇄ myosin-ADP-Pi or myosin-ADP) in the first mix, followed by combination with thin filaments in the second mix. This enabled us to measure the release of products from actomyosin-ADP-Pi using an extrinsically fluorescent bacterial inorganic phosphate (Pi)-binding protein (17–19). This work showed that the rate of dissociation of Pi from skeletal acto(TnTm)S1-ADP-Pi was the step of the mechanism regulated by calcium and myosin binding to skeletal thin filaments (19). Contrary to the steric blocking model, the thin filament affinity of S1-ADP-Pi was relatively insensitive to [Ca2+], changing only ∼1.5-fold from pCa 4–7. Contrary to the three-state model, maximal acceleration of Pi dissociation required the binding of both calcium and rigor S1. For example, at pCa > 7, rigor S1 gave less than half-maximal activation (19), and at pCa < 4 in the absence of rigor S1 activation was only 20%.
We subsequently used the fluorescent nucleotide, mdATP, to measure the dependence of the kinetics of mdADP dissociation from acto(TnTm)myosin-mdADP-Pi upon calcium and bound rigor myosin (20). The maximum rate of product dissociation was similar whether measured directly by Pi dissociation kinetics or by mdADP dissociation, which is consistent with ordered dissociation of products (Pi then ADP) in which Pi is rate-limiting. Whether Pi release was measured directly or indirectly, regulation could be explained by an allosteric model in which calcium and rigor myosin binding to the thin filament produces a change between active and inactive thin filament conformations.
Our previous studies of thin filament regulation were carried out with thin filaments reconstituted from proteins isolated from rabbit fast skeletal muscle (19, 20). Here, we have used a similar approach to investigate the mechanism of thin filament regulation in mammalian cardiac muscle. There are significant differences between the contractile proteins in cardiac muscle and fast skeletal muscle. Cardiac troponin-I contains an amino-terminal extension that the skeletal isoforms do not have (21, 22) and that is phosphorylatable (23, 24). Mammalian cardiac troponin-C, which is identical to slow skeletal troponin-C (25), possesses only a single calcium “trigger” site (26), whereas fast skeletal Tn-C has two (27, 28). Unlike the other two subunits, there are multiple troponin-T isoforms in a given muscle (29, 30). The relative abundance of the various cardiac specific isoforms changes during development (29, 31). The form that predominates in the adult heart is longer than its skeletal counterpart (29, 32–34). In contrast, mammals lack a unique cardiac isoform of tropomyosin. Depending upon the species, one or two skeletal muscle tropomyosins are utilized (35–37). Cardiac and skeletal actins are virtually identical to each other (38, 39), but fast skeletal and cardiac myosins have significantly different kinetic mechanisms, the latter having significantly slower rates of ADP dissociation from actomyosin (40).
We have measured the kinetics of the acceleration of dissociation of mdADP from cardiac S1-mdADP-Pi and S1-mdADP by native porcine cardiac thin filaments in different ligand states using double mixing stopped-flow fluorescence. The maximum acceleration of mdADP dissociation from cardiac S1-mdADP-Pi (∼75-fold) requires both calcium and myosin to be bound to the thin filaments. The thin filament affinity of S1-mdADP-Pi displays less than 2-fold sensitivity to ligand binding, which is incompatible with steric hindrance by tropomyosin of myosin binding to the thin filament being the principal mechanism of regulation. Compared with the skeletal system, however, cardiac thin filaments are significantly more activated (∼70%) by calcium alone, and there is a correspondingly smaller amount of additional rigor activation. These current data can be explained by an allosteric regulation model in which the binding of either calcium alone or rigor S1 alone to the thin filament shifts the equilibrium in favor of the active conformation, but full activation requires binding of both ligands. Overall, cardiac thin filaments are less inhibited and are more easily turned on by either calcium or rigor myosin alone than are skeletal thin filaments. The slower rate of ADP dissociation from cardiac actomyosin (40) allowed us to also measure the regulation of the dissociation of mdADP from cardiac acto(TnTm)S1. Acceleration of the rate of dissociation of mdADP from cardiac acto(TnTm)S1 by calcium and rigor myosin binding was only ∼6-fold compared with ∼75-fold acceleration of the rate mdADP dissociation from acto(TnTm)S1-mdADP-Pi. Thus, different myosin nucleotide complexes appear to be subject to different mechanisms of thin filament regulation.
EXPERIMENTAL PROCEDURES
Materials
ATP, 2′deoxyATP, buffers, and salts were purchased from Sigma. mdATP and mdADP were prepared from 2′-deoxyATP and 2′deoxyADP and purified according to the procedure of Hiratsuka (41) for mant-ATP. Cardiac S1 was prepared from porcine cardiac myosin with α-chymotrypsin by the method of Siemankowskii et al. (40) except that 2 mg of lima bean trypsin inhibitor per mg of chymotrypsin rather than PMSF was used to inhibit chymotrypsin. Native porcine cardiac thin filaments were prepared according to the procedure of Spiess et al. (42) as modified by Matsumoto et al. (43). An SDS-polyacrylamide gel of native cardiac thin filaments is shown in Fig. 1.
FIGURE 1.
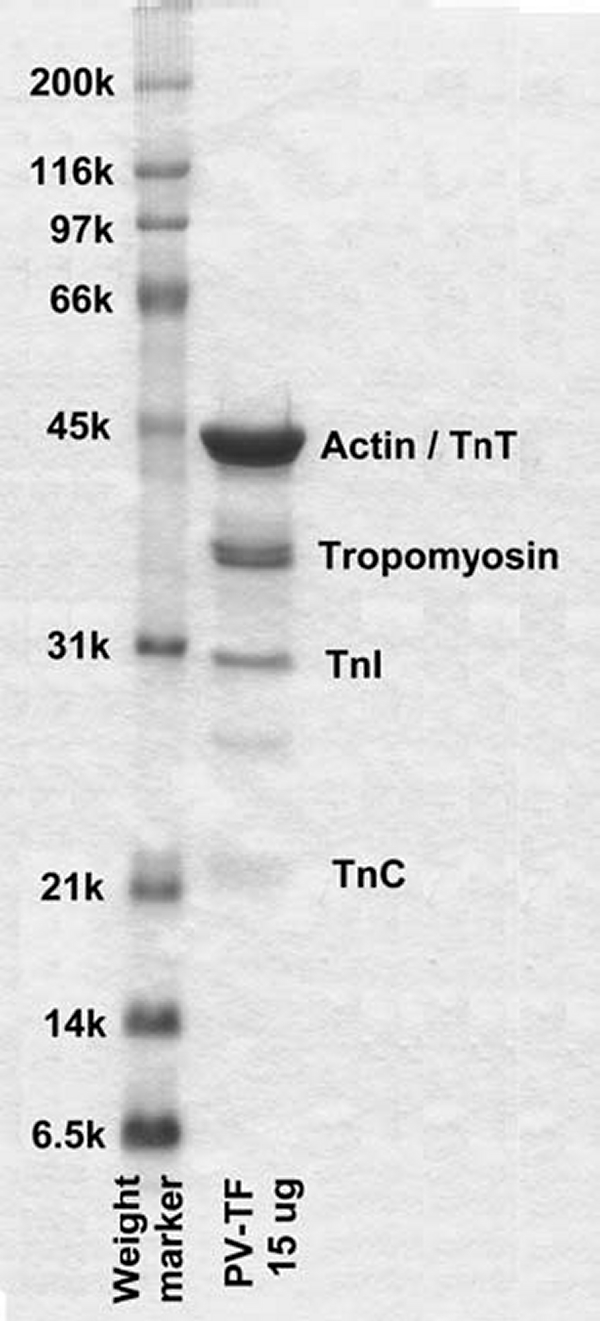
SDS-PAGE of native porcine cardiac thin filaments. Lanes from left to right contain molecular weight markers and 15 μg of native cardiac thin filaments. The two tropomyosin bands correspond to α (lower) and β (upper) isoforms. The unlabeled band is a consistent trace impurity.
Kinetic Measurements
Steady state ATP hydrolysis was measured by a colorimetric assay (44). Native cardiac thin filaments displayed at least a 15-fold calcium sensitivity of the rates of steady state ATP hydrolysis (mole ratio of S1/actin = 1:70 to 1:120) under identical temperature and buffer conditions used for pre-steady state assays except that the ATP concentration was 1 mm. The maximum rate of ATP hydrolysis by cardiac myosin-S1 was 1.9 s−1 in the presence of actin and 2.1 s−1 with native thin filaments at pCa < 4.
Chemical quench measurements were done using a computer-controlled stepper motor-driven quench-flow apparatus as described previously (19). The reaction was quenched by mixing the sample with half the volume of 1.8 m ammonium phosphate, pH 4.0. The fraction of mdATP hydrolyzed was determined by quantitative HPLC. A 0.1-ml sample containing 100 pmol of deoxymant-nucleotide was loaded onto a Whatman Partisil column and eluted isocratically with 0.6 m ammonium phosphate, pH 4.0, at a flow rate of 1 ml/min. Fluorescence emission was observed with a McPherson, FL-750B fluorescence detector equipped with a 200-watt Hg-xenon lamp. Excitation was at 365 nm, and the emission >420 nm obtained with a sharp cutoff filter was recorded every 1 s using a Pico ADC-16 converter. The fraction of hydrolysis was determined by integration of the area of the mdATP and mdADP peaks in the elution profiles.
Stopped-flow fluorescence experiments were performed using a KinTek SF-2001 double mixing stopped-flow fluorimeter. The excitation light from a 75-watt xenon lamp was selected using a 0.125-m monochromator (PTI Corp.). Kinetic measurements of mdADP dissociation were observed using an excitation at 360 nm and emission >420 nm using a sharp cutoff filter. Three to four data traces of 1000 points were averaged, and the observed rate constants were obtained by fitting the data to one or two exponential terms using the software package included with the Kintek stopped flow. In most cases, two different time bases of 500 data points each were selected that were appropriate for the rate constants being observed.
The Kintek stopped flow was fitted with 2-ml syringes in positions A and B and a 5-ml syringe in position C so that both mixes were approximately equivolume and to reduce the dilution of thin filaments in the final reaction mixture. The dilution of the syringe contents was as follows: 2:9 for S1 and deoxymant-nucleotide (either mdATP or mdADP) and 5:9 for thin filaments. Double mixing experiments were performed by first mixing cardiac S1 with deoxymant-nucleotide. The resulting steady state mixture was held in a delay line for the desired time and then in a second mix was combined with thin filaments in 5 mm MOPS, 2 mm MgCl2, pH 7, + 0.2 to 0.5 mm CaCl2 (high calcium) or 1 to 2 mm EGTA (low calcium). The experiments were designed to minimize the effect of other myosin species on activation of the thin filaments. Rigor activation was produced by having excess S1 over mdATP in the first mix so that a constant ratio of one rigor S1 per seven actin subunits was present after the second mix. There was no change in activation between the 1:7 and 1:14 ratio of rigor S1 to actin subunits, which indicates a 1:7 ratio fully activates the thin filaments. In experiments where rigor activation was not desired, 2 mm MgATP was included with the thin filaments to dissociate any rigor-bound S1 resulting from product dissociation. Double mixing experiments similar to those described above were also done in which actin replaced thin filaments. In other experiments, ATP was used as the substrate in the first mix and the release of phosphate after the second mix was measured using fluorescent phosphate-binding protein (18, 19).
Active Enzyme Centrifugation
The calcium dependence of the binding of cardiac S1 to native cardiac thin filaments during steady state ATP hydrolysis was measured by a modification of the method of Chalovich et al. (45); 0.5 ml of a solution containing 0.2 μm cardiac S1, 1 mm ATP, and concentrations of thin filaments between 0 and 50 μm actin subunits was centrifuged for 25 min at 50,000 rpm in a Beckman 70.1Ti rotor at 4 °C to sediment the thin filaments and any bound S1. The amount of S1 in the supernatant was determined by MgATP hydrolysis at 25 °C. The reaction was initiated by the addition of 0.4 ml of the supernatant to 0.6 ml of a mixture containing 20 μm F-actin, 1.67 mm ATP, and 1.67 mm EGTA. At times of 0, 8, 14, and 18 min, 200-μl aliquots were removed and analyzed colorimetrically for phosphate with ammonium molybdate by A550 (44). The fraction of enzyme in the supernatant was determined by reference to a control experiment done without thin filaments.
RESULTS
Single Turnover Rapid Chemical Quench Measurement of the Hydrolysis of mdATP by Cardiac S1
100 μm cardiac S1 was mixed with 20 μm mdATP and quenched at the indicated time, and the fraction of mdATP hydrolyzed is shown in Fig. 2A. The rapid phase of the reaction, 13 s−1, measures the rate of substrate binding and hydrolysis, and the second slow phase, 0.043 s−1, measures the steady state rate (phosphate dissociation). The ratio of the amplitudes of the fast and slow phases (0.55:0.37 = ∼1.5) provides a measure of the equilibrium constant of hydrolysis of mdATP, KH, while bound to myosin. Fig. 2B shows a plot of the dependence of the fast component upon the concentrations of S1. The extrapolated value of 34 s−1 is equal to k−H + kH and can be used with the value of KH, determined from the ratio of the slow and fast phases, 1.5, to determine the values of kH to be ∼21 s−1 and k-H to be ∼14 s−1.
FIGURE 2.

Hydrolysis of mdATP by cardiac S1 by quench flow. A, 100 μm cardiac S1 was mixed with 20 μm mdATP in 5 mm MOPS, 2 mm MgCl2, 20 mm potassium acetate, pH 7.0, 20 °C. The solid line drawn through the data is a fit to the curve: I(t) = 0.55 e−13t + 0.37 e−0.043t. B, dependence of kobs upon [S1] is fit to the equation kobs = (kH + k−H)/(1 + K1/[S1]), in which K1 = 50 μm; kH = 21 s−1; k−H = 14 s−1.
Effect of Calcium and Rigor Myosin on the Rate of Dissociation of mdADP from Cardiac Acto(TnTm)S1-mdADP-Pi
Fig. 3A shows the change in stopped-flow fluorescence that is associated with mdADP dissociation in a double mixing stopped-flow experiment in which the native cardiac thin filaments had neither calcium (pCa > 7) nor rigor cardiac S1 bound. Equal volumes of 2 μm S1 and 3 μm mdATP are combined in the first mix and allowed to incubate for 2 s for the mdATP to be bound and hydrolyzed by the cardiac S1. After the first mix (2 s incubation), the distribution of myosin and myosin md-nucleotide complexes would be expected to be 0.24 μm mdATP, 0.02 μm myosin, 0.16 μm M-mdATP, 0.24 μm M-mdADP-Pi, 0.02 μm M-mdADP, based on the equilibrium constant for the hydrolysis step and the rate constant for the dissociation of Pi and mdADP dissociation from cardiac myosin. The amplitudes of a control experiment in which the second mix contained only 2 mm MgATP (no thin filaments) was fit by 95% of the amplitude at 0.04 s−1 (M-md-ADP-Pi → M + mdADP + Pi) and 5% at 0.55 s−1 (M-mdADP → myosin + mdADP), which is consistent with the calculated values.
In the second mix, the cardiac S1-nucleotide complex is combined with thin filaments containing 1.0 mm EGTA to deplete the filaments of associated calcium and 2.0 mm MgATP. The excess MgATP prevents binding of any mdATP not bound to cardiac S1 in the first mix and dissociates rigor S1 produced by mdADP dissociation from the S1 bound to the thin filaments. The fluorescence decrease is fit well by a single exponential process in which kobs = 0.37 s−1 (Fig. 3A). Under conditions in which calcium is bound to the thin filament (0.27 mm CaCl2 in the flow cell), the fluorescence change from the mdADP dissociation is biphasic (Fig. 3B). The initial rapid decrease (kobs = 19 s−1) is followed by a slower decrease (kobs = 1.7 s−1). To determine the effect of rigor heads on the rate of product dissociation, by cardiac thin filaments, an excess of cardiac S1 (i.e. [S1] > [mdATP]) is used in the first mix. Nucleotide-free myosin is then available for rapid binding to the cardiac thin filaments at the beginning of the second mix. A biphasic fluorescence decrease (kfast = 15 s−1 and kslow = 1.8 s−1) is observed after incubating 2 μm mdATP with 19 μm cardiac S1 in the first mix and after 2 s mixing with thin filaments to obtain a final concentration of 26 μm cardiac thin filaments with 3.7 μm bound rigor cardiac S1 at pCa > 7 (Fig. 3C). If the same experiment is done at pCa < 4, the observed rates are kfast = 25 s−1 and kslow = 1.9 s−1 (Fig. 3D).
FIGURE 3.

Effect of calcium and rigor myosin S1 on the kinetics of product dissociation from cardiac acto(TnTm)myosin S1-mdADP-Pi. Double mixing stopped-flow experiments were performed as described under “Experimental Procedures.” A and B, 2 μm cardiac S1 and 3 μm mdATP were mixed, incubated for 2 s, and then mixed with 47 μm (actin subunit concentration) cardiac thin filaments containing 2 mm MgATP and either 1.0 mm EGTA (A) or 0.5 mm CaCl2 (B). Final concentrations in the flow cell are as follows: 0.44 μm cardiac S1, 0.67 μm nucleotide, 26 μm cardiac thin filaments, 1.1 mm MgATP, 2 mm MgCl2, 5 mm MOPS, and either 0.55 mm EGTA (A) or 0.27 mm CaCl2 (B), pH 7, 20 °C. C and D, 19 μm of cardiac S1 and 2 μm mdATP were mixed, incubated for 2 s, and then mixed with cardiac thin filaments containing either 1.0 mm EGTA (C) or 0.5 mm CaCl2 (D). Final concentrations in the flow cell are as follows: 3.7 μm cardiac S1, 0.44 μm nucleotide, 26 μm cardiac thin filaments, 2 mm MgCl2, 5 mm MOPS, and either 0.55 mm EGTA (C) or 0.27 mm CaCl2 (D), pH 7, 20 °C. The solid lines through the data are the best fits to the following exponential equations: A, I(t) = 1.0e−0.37t + C; B, I(t) = 0.34e−19t + 0.66e−1.7t + C; C, I(t) = 0.71e−15t + 0.29e−1.8t + C; D, I(t) = 0.76e−25t + 0.24e−1.9t + C.
The dependence of the observed rate of the fast phase, which corresponds to the dissociation of Pi from cardiac S1-mdADP-Pi (18–20), upon thin filament concentration with the various ligand conditions is shown in Fig. 4. At pCa > 7 in the absence of rigor myosin (Fig. 4, ♢) (i.e. no ligands bound to the thin filament), the relationship is fit by a hyperbola with a maximum of 0.49 s−1. With only calcium bound (pCa < 4 and no rigor cardiac S1), the dependence of kobs on thin filament concentration saturates at a rate of 27 s−1 as shown in Fig. 4 (■). Thus, these data show that the maximum rate of product dissociation at saturating thin filaments is increased ∼54-fold by calcium binding alone to the thin filament.
FIGURE 4.

Dependence of the rates of product dissociation from cardiac acto(TnTm)myosin S1-mdADP-Pi on thin filament concentration and calcium and rigor S1 bound to the thin filaments. Experiments are similar to those described in Fig. 3 except that the concentration of thin filaments was varied as indicated. The dependence of kobs of thin filament (actin subunit) concentration is fit to the equation kobs = kfast(1 + (KTF/[TF])). For pCa > 7 (♢), kfast = 0.49 ± 0.05 s−1, KTF = 16 μm; pCa < 4 (■), kfast = 27 ± 4 s−1, KTF = 19 μm; pCa > 7 + rigor (▴), kfast = 24 ± 4 s−1, KTF = 11 μm; pCa < 4 + rigor (●), kfast = 36 ± 3 s−1, KTF = 11 μm. In the inset F-actin replaced cardiac thin filaments. The observed rate scale is indicated on the right vertical axis of the inset. Open symbols (○) are the fast component of experiments measuring the decrease in md nucleotide fluorescence. The line fit through the data is for a hyperbola in which Kactin = 53 μm and kfast = 38 ± 4 s−1. Solid symbols (●) are the fast component of experiments in which phosphate dissociation was measured using fluorescent phosphate-binding protein. The line fit through the data is for a hyperbola in which Kactin = 48 μm are kfast = 30 ± 5 s−1.
Both steady state kinetic measurements and binding studies (10, 46) have demonstrated that skeletal thin filaments containing no bound calcium can be activated by myosin heads bound in rigor. In the experiments shown in Fig. 3, C and D, the cardiac S1 concentration was varied so as to always maintain a constant ratio of one rigor cardiac S1 to each seven actin subunits in the thin filaments after the second mix. In these experiments after the second mix (2 s incubation), the concentration of myosin md-nucleotide complexes are calculated to be 0.01 μm mdATP, 0.16 μm M-mdATP, 0.24 μm M-mdADP-Pi, and 0.03 μm M-mdADP, based on the equilibrium constant for the hydrolysis step and the rate constant for the dissociation of Pi and mdADP dissociation from cardiac myosin. With only rigor myosin-S1 bound to the thin filament (pCa > 7), the maximum extrapolated rate of 24 ± 4 s−1 (Fig. 4, ▴) is similar to that measured with calcium only bound to the thin filaments. The dependence of kobs of the fast phase upon thin filament concentration at a ratio of one rigor bound to cardiac S1 per seven thin filament actin subunits and pCa < 4 as shown by (●) in Fig. 4 has an extrapolated rate at a saturating thin filament concentration of 36 ± 3 s−1. In this set of experiments, the apparent affinity of the cardiac S1-mdADP-Pi for thin filaments, KTF, ranged from ∼10 to 20 μm. The lack of a significant dependence of KTF upon either pCa or rigor cardiac S1 bound to the thin filament is consistent with there being little steric blocking of myosin binding to the thin filament by tropomyosin. The inset in Fig. 4 shows the dependence of the fast phase for similar experiments in which unregulated F-actin replaced cardiac thin filaments. The maximum extrapolated rate obtained with F-actin, 38 ± 4 s−1, was the same within experimental error as that measured for fully activated thin filaments and was independent of either pCa or rigor-bound myosin.
The open symbols (○) in the upper left corner of Fig. 4 are for experiments measuring the fast component of the decrease in md nucleotide fluorescence of double mixing experiments in which rabbit F-actin replaced cardiac thin filaments. The line fit through the data is for a hyperbola in which Kactin = 53 μm and kfast = 38 ± 4 s−1. The solid symbols (●) are the fast component of experiments in which phosphate dissociation was measured using fluorescent phosphate-binding protein as previously described (18, 19). The line fit through these data is for a hyperbola in which Kactin = 48 μm and kfast = 30 ± 5 s−1. These data show, as was previously demonstrated for regulated skeletal actomyosin (19, 20), that product dissociation from acto(TmTm)myosin ADP-Pi occurs by an ordered mechanism in which slow phosphate dissociation limits the rate of ADP dissociation.
The slow phase of the fluorescent decrease measures the lifetime of the AM-mdATP (AM-T), which has three possible pathways of breakdown as shown in Scheme 1. where A is actin, M is myosin-S1; T is mdATP; and D is mdADP.
SCHEME 1.

Previous experiments similar to those used here with skeletal actomyosin S1 in the absence of regulatory proteins demonstrated that the slow component of phosphate release generated in double mixing experiments was produced by slow hydrolysis of ATP bound to actomyosin (AM-T → AM-DP). This step was shown to be the rate-limiting step of ATP hydrolysis at saturating actin (18). Although it is not possible to rigorously demonstrate that the slow phase is due to attached hydrolysis with regulated cardiac actomyosin, several observations indicate that it is also likely to be the same as for unregulated actin. The rate constant was the same, 2.1 ± 0.2 s−1, within experimental error for the slow phase with F-actin, cardiac thin filaments at pCa < 4 (with or without rigor activation), and pCa > 7 with rigor activation and the steady state rate of actin-activated ATP hydrolysis. The fraction of the fluorescence amplitude corresponding to the fast component in Fig. 3, C and D, 0.7, is similar to that expected from the composition of the myosin nucleotide 0.6 (cardiac S1-mdADP-Pi) and 0.4 (cardiac S1-mdATP) prior to mixing to actin as determined from quenched-flow experiments in Fig. 2. This indicates that there is relatively little re-equilibration (S1-mdATP ⇄ S1-mdADP-Pi) after mixing with the thin filaments.
Effect of Calcium and Rigor Myosin on the Rate of Dissociation of mdADP from Cardiac Acto(TnTm)S1-mdADP
Experiments in Fig. 5 were similar to those previously described in Fig. 3 except that mdATP was replaced by mdADP. The observed rates of nucleotide dissociation for a given ligand condition are as follows: (A) pCa > 7 and zero rigor S1; kobs = 15.7 s−1; (B) pCa < 4 and zero rigor S1, kobs = 250 s−1; (C) pCa > 7 and 1 rigor S1 bound per seven actin monomers, kobs = 153 s−1; and (D) pCa < 4 and 1 rigor S1 bound per seven actin monomers, kobs = 290 s−1. In addition to being considerably more rapid, the kinetics of mdADP dissociation from myosin-mdADP in Fig. 5 were fit by single exponential rather than the double exponential fits required to fit the data in Fig. 3. These results are explained by the single intermediate, cardiac S1-mdADP, in Fig. 5 compared with two intermediates (S1-mdATP ⇄ S1-mdADP-Pi) in Fig. 3. Experiments in which mdATP was used in the first mix and the mixing time was increased to 99 s to allow the mdATP to be completely hydrolyzed to mdADP and single mixing experiments in which S1-mdADP was mixed with thin filaments gave similar results (data not shown) as those described above. The dependence of rates of mdADP dissociation upon thin filament concentration were fit to hyperbolic equations to determine the rates of dissociation of mdADP from cardiac acto(TnTm)S1 and apparent affinities of cardiac S1-mdADP for the thin filaments (Fig. 6). The rates of mdADP dissociation were measured for the four ligand conditions as follows: thin filaments with no ligands bound (Fig. 6, ♢), k = 64 s−1; only calcium bound (■), k = 357 s−1; only rigor myosin bound (▴), k = 332 s−1; and both ligands bound (●), k = 359 s−1. Thus, there is only an ∼6-fold increase in the rate of mdADP dissociation from cardiac S1 between the fully inhibited thin filament state, pCa > 7, with no bound rigor cardiac S1 and the fully activated state, pCa < 4, and rigor S1 bound to the thin filaments. This can be compared with a 75-fold increase in the rate of dissociation of mdADP from myosin-mdADP-Pi (Fig. 4). An additional difference between the regulation of mdADP and mdADP-Pi dissociation is that mdADP dissociation is almost fully activated by rigor S1 bound to thin filaments whereas md-ADP-Pi dissociation is only partially activated by rigor-S1.
FIGURE 5.

Effect of calcium and rigor myosin S1 on the kinetics of mdADP dissociation from cardiac acto(TnTm)myosin S1. A and B, double mixing stopped-flow experiments were performed as described under “Experimental Procedures.” 4 μm cardiac S1 and 2 μm mdADP were mixed, incubated for 2 s, and then mixed with cardiac thin filaments containing 2 mm MgATP and either 2.0 mm EGTA (A) or 0.2 mm CaCl2 (B). Final concentrations in the flow cell are as follows: 0.88 μm cardiac S1, 0.44 μm mdADP, 32 μm cardiac thin filaments, 1.1 mm ATP, 2 mm MgCl2, 5 mm MOPS, and either 1.1 mm EGTA (A) or 0.11 mm CaCl2 (B), pH 7, 20 °C. C and D, 20 μm cardiac S1 and 2 μm mdADP were mixed, incubated for 2 s, and then mixed with cardiac thin filaments containing either 2.0 mm EGTA (A) or 0.2 mm CaCl2 (B). Final concentrations in the flow cell are as follows: 4.5 μm cardiac S1, 0.44 μm nucleotide, 32 μm cardiac thin filaments, 2 mm MgCl2, 5 mm MOPS, and either 1.1 mm EGTA (C) or 0.11 mm CaCl2 (D), pH 7, 20 °C. The solid lines through the data are the best fit to single exponential equations in which kobs = 15.7 s−1 (A), 250 s−1 (B), 153 s−1 (C), and 290 s−1 (D).
FIGURE 6.

Dependence of the rates of product dissociation from cardiac acto(TnTm)myosin S1-mdADP on thin filament concentration and calcium and rigor S1 bound to the thin filaments. Experiments are similar to those described in Fig. 5 except that the concentration of thin filaments was varied as indicated. The solid lines through the data are best fits to a hyperbolic equation: kobs = k−AD(1 + (KTF/[TF])). For pCa > 7 (♢), k−AD = 64 s−1, KTF = 32 μm; pCa < 4 (■), k−AD = 357 s−1, KTF = 12 μm; pCa > 7 + rigor (▴), k−AD = 332 s−1, KTF = 27 μm; pCa < 4 + rigor (●), k−AD = 359 s−1, KTF = 6 μm.
We have also measured the rates of dissociation of mdADP from porcine cardiac actomyosin S1 by experiments similar to those shown in Fig. 6 except that the mdADP was first mixed with cardiac myosin-S1 (to form myosin-mdADP) and then with actin and ATP to displace the bound nucleotide (data not shown). The extrapolated maximum rate of 362 s−1 is ∼5-fold faster than the 75 s−1 previously observed for ADP dissociation from bovine cardiac actomyosin at 15 °C (40, 51) and ∼3-fold more rapid than the rate (120 s−1) of ADP dissociation from porcine cardiac actomyosin S1 at 20 °C (data not shown).
Active enzyme centrifugation was used as an alternative method for measuring the calcium dependence of myosin affinity for thin filaments in the presence of MgATP (Fig. 7). Thin filaments and cardiac S1 were centrifuged to separate the bound and free cardiac S1 under conditions similar those used in stopped-flow experiments shown in Fig. 3, A and B, and Fig. 4, at pCa > 7 and < 4. The amount of S1 remaining in the supernatant is used to determine a disassociation constant, Kapp, of 8.5 ± 1 μm at pCa > 7 and 3.2 ± 0.4 μm at pCa < 4.
FIGURE 7.

Measurement of cardiac myosin S1 binding to cardiac thin filaments in the presence of MgATP at high (pCa < 4) and low calcium (pCa > 7) by active enzyme centrifugation. Experimental conditions are as follows: final concentrations in the centrifuge tube were 0.2 μm cardiac myosin S1, 5 mm MOPS, 2 mm MgCl2, 1.0 mm MgATP, either 0.2 mm CaCl2 or 1.0 mm EGTA, and the indicated concentration of porcine thin filaments (actin subunit concentration). The amount of cardiac myosin S1 in the supernatant was determined by enzymatic activity as described under “Experimental Procedures.” Solid lines through the data are fit to fsupernatant = Vo/(1 + ([actin]/Kbind)), where Vo = ATPase rate before spinning with thin filaments, and Kbind = 3.2 μm in 0.2 mm CaCl2 (■) and 8.5 μm in 1 mm EGTA (□).
DISCUSSION
We have extended our analysis of thin filament regulation to cardiac muscle. Native cardiac thin filaments and cardiac S1 were used in conjunction with double mixing stopped-flow fluorescence and active enzyme centrifugation to investigate the regulation, by calcium and rigor myosin, of thin filament activation of mdADP dissociation from two distinct myosin-nucleotide complexes, actomyosin-mdADP-Pi and actomyosin-mdADP. The results, which are summarized in Table 1, can be compared with those previously obtained with rabbit skeletal thin filaments (19, 20). For both cardiac and skeletal muscle thin filaments, acceleration of product release from acto(TnTm)S1-ADP-Pi is the principal regulated step and proceeds by an ordered mechanism in which phosphate dissociation precedes ADP dissociation. In both instances, maximum activation of product release requires the binding of both calcium and rigor myosin to the thin filament, and the effect of calcium and rigor myosin binding can be explained by an allosteric model of regulation in which a given ligand shifts the equilibrium of the cardiac thin filament from the inactive to the active conformation. This study also shows significant differences between the mechanisms of regulation of cardiac and skeletal thin filaments, principally cardiac thin filaments are more fully activated by calcium or rigor S1 alone. In addition, the slower rates of ADP dissociation from cardiac actomyosin-ADP (47) allowed us to directly measure the regulation of mdADP dissociation from cardiac acto(TnTm)myosin S1-ADP.
TABLE 1.
Summary of the acceleration of product dissociation kinetics from myosin S1-mdADP-Pi and myosin S1-mdADP by thin filaments and F-actin
| +TnTm, pCa > 7, 0 [rigor myosin]a | +TnTm, pCa < 4, 0 [rigor myosin]a | +TnTm, pCa > 7, 1 [rigor myosin]/7 [actin]b | +TnTm, pCa < 4, 1 [rigor myosin]/7 [actin]b | Actin,cpCa > 7, 0 [rigor myosin] | |
|---|---|---|---|---|---|
| kfastd (mdADP-Pi) | 0.49 s−1 | 27 s−1 | 24 s−1 | 36 s−1 | 38 s−1e |
| KTF, fast(M-mdADP-Pi) | 16 μm | 19 μm | 11 μm | 11 μm | 53 μm |
| kslowd (mdATP) | NAf | 2.3 s−1 | 2.2 s−1 | 1.9 s−1 | 2.0 s−1 |
| KTF, slow(M-mdATP) | 13 μm | 6.3 μm | 6.1 μm | 32 μm | |
| Kccard(M, Ca)g | 0.02 | 3 | 2 | >10 | NDh |
| Kcskel(M, Ca)g,i | 0.0055 | 0.17 | 0.3 | >3 | ND |
| k−AD(mdADP)j | 64 s−1 | 357 s−1 | 332 s−1 | 359 s−1 | 361 s−1 |
| KTF(M-mdADP) | 32 μm | 12 μm | 27 μm | 6 μm | 49 μm |
a [S1] = 0.
b [S1]/[actin] = 1/7.
c Purified rabbit skeletal F-actin is in the absence of regulatory proteins. The values for KTF are the thin filament (actin subunit) concentration required to obtain half the maximal observed rate.
d kfast(mdADP-Pi) and kslow(mdATP) are the maximal rates of md nucleotide dissociation for the fast and slow components at saturating thin filament (or F-actin) concentrations as determined in Figs. 3 and 4.
e kF-actin is the maximum rate observed with F-actin in the absence of regulatory proteins.
f Data were fit to a single exponential.
g Kc(M, Ca2+) = kfast/(kF-actin – kfast), where kfast is the rate of the fast component of product release at saturating thin filament concentrations under the indicated conditions.
h ND means not determined.
i Data were determined previously for rabbit skeletal muscle thin filaments (19).
A simple steric blocking mechanism in which the tropomyosin inhibits myosin binding to thin filaments at low calcium predicts that the primary effect of regulation upon the kinetic mechanism would be expected to alter the affinity of S1-ADP-Pi for thin filaments. Such a mechanism was inconsistent with subsequent observations that the effect of calcium upon the affinity of myosin for thin filaments during steady state ATP hydrolysis is small (45, 48). The kinetic results (summarized in Table 1) and active enzyme centrifugation results (Fig. 7) are consistent with this view in that there is only a small (<2-fold) increase in the apparent affinity of M-ADP-Pi for maximally activated filaments (calcium and rigor heads bound) relative to either partially activated (calcium or rigor heads bound) or maximally inhibited thin filaments (neither calcium or rigor heads bound).
A three-state regulation model is shown in Fig. 8 (16). In this model, the blocked state myosin is prevented from binding to the thin filament. The closed state of thin filaments allows myosin binding but does not allow completion of the power stroke. The open state is fully active, accelerating phosphate dissociation to produce a power stroke. The experiments upon which the three-state model is based were equilibrium and kinetic measurements of rigor S1 (and other myosin-ligands that produce open switch II myosin conformations) binding to the thin filament. The three-state model assumed that the binding of either rigor myosin or myosin with ligands such as ADP, pyrophosphate, AMP-PNP, and ADP-Pi to actin (or thin filaments) occurs by the same two-step mechanism except that the equilibrium constant of the second step is altered by the bound ligand. However, it is now generally accepted that myosin exists in multiple conformations and that the conformation is dependent upon the ligands bound to the active site. Of the ligands listed above, only M-ADP-Pi produces predominantly the closed pre-power stroke switch II conformation, which is the intermediate that produces a power stroke when myosin binds to actin. The other ligands stabilize myosin predominantly in open post-power stroke switch II conformation that does not produce a power stroke on binding to actin (49).
FIGURE 8.

Three state mechanism of thin filament regulation showing blocked, closed, and open states.
There are also several features of the three-state model for thin filament regulation that are not consistent with the kinetic data summarized in Table 1. First, the ∼75-fold acceleration of product release from myosin-mdADP-Pi by thin filaments at high calcium but without rigor myosin bound is 5–10 times greater than the acceleration predicted by the calcium dependence (3–5-fold) of the equilibrium constant between the closed and open states, KT (16) of skeletal thin filaments and ∼75 times greater than that measured with cardiac thin filaments (50). Second, the three-state model predicts that rigor binding should fully activate product release at low calcium, but as is shown in Figs. 4 and 5, rigor binding at pCa > 7 produces only about 70% of the maximal rate of product release that occurs with both calcium and rigor heads bound to the thin filament.
The data in Table 1 compare the effect of calcium and rigor cardiac S1 on the rate of dissociation of mdADP from the physiological complex acto(TnTm)S1-mdADP-Pi and the nonphysiological complex acto(TnTm)S1-mdADP. The apparent affinity (KTF) of S1-mdADP-Pi binding to thin filaments shows little calcium dependence, suggesting that there is no blocked state present and that KB in the three-state model is ≫1. The absence of the blocked state is not unexpected in view of previous observations that the block state is not present in skeletal muscle thin filaments at ionic strengths <50 mm (51, 52). However, we observed a 2–4-fold increase in KTF of cardiac S1-ADP for cardiac thin filaments at low ionic strength upon increasing the concentration of calcium from pCa >7 to <4, which is similar to the calcium dependence of the equilibrium between the open and blocked states of the three-state model at physiological ionic strength. Although it is possible that we missed the blocked state for M-ADP-Pi binding to thin filaments because of the very low ionic strength, which we were required to use to obtain maximal dissociation rates, our observation of an apparent blocked state for mdADP dissociation kinetics (Figs. 5 and 6 and Table 1) suggests that it is the ligand bound to the myosin and not ionic strength that is the most significant factor in determining the regulatory mechanism.
Both pCa < 4 and rigor-bound cardiac S1 produce near maximal acceleration (5–6-fold) of mdADP dissociation at saturating concentrations of thin filaments. The good agreement between the data obtained for mdADP dissociation from acto(TnTm)S1-mdADP with the predictions of the three-state model of thin filament regulation is likely because the myosin is in the same open switch II conformation in both sets of experiments.
The model that we previously proposed for the regulation of skeletal muscle thin filaments (20) is shown in Scheme 2 using the data from Table 1 for cardiac thin filaments. In Scheme 2, calcium and rigor S1 shift the equilibrium from the inactive (I) to the active (A) conformation of the thin filaments. Our model is similar to the modified model of Hill et al. (15) in which the thin filament conformation is either active (A) or inactive (I) with regard to the ability to bind myosin (6). The model allows a quantitative evaluation of the relationship between activation of product dissociation and calcium and rigor myosin binding to cardiac thin filaments to be made. In a manner similar to that observed for skeletal thin filaments, the equilibrium strongly favors the inactive form in the absence of bound calcium and rigor myosin.
SCHEME 2.

A, active thin filament conformation (accelerates product dissociation from M-ADP-Pi); I is inactive thin filament conformation (does not accelerate product release from M-ADP-Pi); subscripts to equilibrium constants i = inactive thin filament conformation and a = active thin filament conformation; if neither i nor a is indicated the equilibrium constant is the apparent equilibrium constant [A(Ca,M)]/[I(Ca,M)], with the indicated ligands bound to the thin filament (e.g. KCa is the equilibrium between A and I with calcium bound to the thin filament, and KiCa is the association constant for calcium binding to the inactive filaments (I); M = cardiac S1; Ca = calcium; the second subscript is the associating/dissociating ligand. ΣA and ΣI are the sum of the active and inactive thin filament regulatory units. The values for the equilibrium constants or ratios of equilibrium constants assuming that the affinity is only a function of the thin filament conformation and not of the bound ligands (i.e. KiCa = KiMCa, KaCa = KaMCa, KiM = KiCaM, and KaM = KaCaM) are shown in parentheses.
The dependence of the conformational equilibrium constants, Kc upon the ligands calcium and myosin, Ko = 0.02 (no ligands), KCa = 3 (calcium only), KM = 2 (rigor heads only), and KMCa > 10 (rigor and calcium activation), is calculated from the maximum rate of activation as described in the legend of Table 1. The accuracy of the values estimated for the equilibrium between the inactive and active conformers is reasonably good for Ko, KCa, and KM, but only a lower limit of 10 could be obtained for KMCa. A comparison between the extent of activation of cardiac and skeletal thin filaments is shown in Fig. 9. Cardiac thin filaments are more activated by either calcium or rigor binding alone. Cardiac thin filaments are ∼70% activated by pCa < 4 in the presence of MgATP (no rigor myosin binding) compared with skeletal thin filaments, which are only ∼20% activated under similar conditions. Our results indicate that cardiac muscle is primarily regulated by calcium binding to the thin filament and that any rigor-bound heads produced during contraction would be expected to produce only a small additional activation. Similar observations were made using bifunctional fluorescent labels on TnC exchanged into cardiac muscle to measure conformational changes in TnC produced by calcium and rigor myosin. These results showed that although myosin binding can switch on cardiac thin filaments in rigor conditions, it does not significantly contribute to activation under physiological conditions (53).
FIGURE 9.

Comparison of the activation of cardiac and skeletal thin filaments on rigor and calcium. Dependence of the extent of activation by cardiac (gray) and skeletal (black) thin filaments on calcium (pCa < 4) and 1 rigor myosin/7 actin subunits. Activation is the maximum rate of the fast component of mdADP dissociation from acto(TnTm)myosin-md ADP-Pi at the indicated conditions (Fig. 4, inset) (20) normalized relative to the maximum extrapolated rate of mdADP dissociated from unregulated actomyosin-mdADP-Pi.
In addition, the ratios of the equilibrium constant for each ligand (calcium and rigor S1) to the active and inactive forms of the thin filament (with and without the other ligand bound) can be determined from conservation equations that are shown below Scheme 2.
These data are consistent with a mechanism in which the affinity of each ligand is affected only by the equilibrium between the active and inactive conformation of the filaments and not by binding of the ligand per se, that is KaM/KiM = KaCa-M/KiCa-M = 100 and KaCa/KiCa = KaM-Ca/KiM-Ca = 150. This simplification is reasonable as there is no physical overlap between the calcium and myosin sites on the thin filament, and the interaction between the sites would necessarily be mediated by the conformation of the thin filament. If such a mechanism is true, then a value of 300 can be calculated for KMCa, which is consistent with the experimentally determined lower limit of >10.
The model in Scheme 2 assumes that the equilibrium between the active and inactive conformations of the thin filaments is more rapid than the product dissociation steps. If this was not the case, then inhibition would lower the concentration of active thin filaments and the primary observed effect upon the kinetic mechanism would be to decrease the apparent affinity of M-ADP-Pi for thin filaments in the inhibited form. The similar values for KTF when one (either calcium or rigor S1) or both ligands are bound to the thin filament support a mechanism in which there is a rapid equilibrium between active and inactive states. However, the small (<2-fold) decrease in myosin-ADP-Pi affinity to thin filaments in the absence of calcium and bound rigor S1 could be attributed to either the rate of equilibration between active and inactive cardiac thin filament conformers being similar to the rates of product release in the absence of calcium and rigor-S1 or by a steric blocking mechanism, as suggested by the “blocked state” of “the three-state model” that produces a small change in affinity.
Single particle analysis of the structure of thin filaments has recently been used to determine the dependence of the position of tropomyosin upon calcium concentration (54). At low calcium, ∼80% of the thin filament segments contained tropomyosin in a position that would block myosin binding, but ∼20% were in the closed position that would allow partial binding. At high calcium, the situation was reversed with ∼20% in the blocked conformation and 80% in the closed position. These structural data predict an ∼4-fold decrease in the KTF of thin filament binding to S1-ADP-Pi at low calcium. The calcium dependence of the structural change is in good agreement with the results in Table 1, which indicate that calcium binding to the thin filament produces only a small ∼2–3-fold alteration in the value of KTF.
Our results are in good agreement with those reported previously for reconstituted skeletal thin filaments (19, 20). The change in the tropomyosin position between the blocked and closed conformations is only a very small part of the regulatory mechanism, and the principal site of regulation is phosphate dissociation.
Acknowledgment
We thank Dr. S. J. Smith for critical reading of the manuscript.
This work was supported, in whole or in part, by National Institutes of Health Grants HL84604 and EB00209 (to H. D. W.). This work was also supported by Canadian Institutes of Health Research and Natural Sciences and Engineering Research Council of Canada research grants (to D. H. H.).
- Tn
- troponin
- S1
- myosin subfragment 1
- cardiac S1
- porcine ventricular myosin subfragment 1
- M-ATP
- myosin ATP
- M-ADP-Pi
- myosin ADP-inorganic phosphate
- mdADP
- 2′deoxy-3′-O-(N-methylanthraniloyl)ADP
- mdATP
- 2′deoxy-3′-O-(N-methylanthraniloyl)ATP
- Tm
- tropomyosin
- AM
- actomyosin
- AMP-PNP
- adenosine 5′-(β,γ-imino)triphosphate
- mant
- N-methylanthraniloyl.
REFERENCES
- 1.Cohen C. (1975) Sci. Am. 233, 36–45 [DOI] [PubMed] [Google Scholar]
- 2.Ohtsuki I. (1979) J. Biochem. 86, 491–497 [DOI] [PubMed] [Google Scholar]
- 3.Mak A. S., Smillie L. B. (1981) J. Mol. Biol. 149, 541–550 [DOI] [PubMed] [Google Scholar]
- 4.Flicker P. F., Phillips G. N., Jr., Cohen C. (1982) J. Mol. Biol. 162, 495–501 [DOI] [PubMed] [Google Scholar]
- 5.Cabral-Lilly D., Tobacman L. S., Mehegan J. P., Cohen C. (1997) Biophys. J. 73, 1763–1770 [DOI] [PMC free article] [PubMed] [Google Scholar]
- 6.Takeda S., Yamashita A., Maeda K., Maéda Y. (2003) Nature 424, 35–41 [DOI] [PubMed] [Google Scholar]
- 7.Vinogradova M. V., Stone D. B., Malanina G. G., Karatzaferi C., Cooke R., Mendelson R. A., Fletterick R. J. (2005) Proc. Natl. Acad. Sci. U.S.A. 102, 5038–5043 [DOI] [PMC free article] [PubMed] [Google Scholar]
- 8.Syska H., Wilkinson J. M., Grand R. J., Perry S. V. (1976) Biochem. J. 153, 375–387 [DOI] [PMC free article] [PubMed] [Google Scholar]
- 9.Talbot J. A., Hodges R. S. (1981) J. Biol. Chem. 256, 12374–12378 [PubMed] [Google Scholar]
- 10.Bremel R., Murray J. M., Weber A. (1972) Cold Spring Harbor Symp. Quant. Biol. 37, 267–275 [Google Scholar]
- 11.Bremel R. D., Weber A. M. (1972) Nat. New Biol. 238, 97–101 [DOI] [PubMed] [Google Scholar]
- 12.Tobacman L. S. (1996) Annu. Rev Physiol. 58, 447–481 [DOI] [PubMed] [Google Scholar]
- 13.Huxley H. E. (1972) Cold Spring Harbor Symp. Quant. Biol. 37, 361–376 [Google Scholar]
- 14.Hill T. L., Eisenberg E., Greene L. (1980) Proc. Natl. Acad. Sci. U.S.A. 77, 3186–3190 [DOI] [PMC free article] [PubMed] [Google Scholar]
- 15.Hill T. L., Eisenberg E., Greene L. E. (1983) Proc. Natl. Acad. Sci. U.S.A. 80, 60–64 [DOI] [PMC free article] [PubMed] [Google Scholar]
- 16.McKillop D. F., Geeves M. A. (1993) Biophys. J. 65, 693–701 [DOI] [PMC free article] [PubMed] [Google Scholar]
- 17.Brune M., Hunter J. L., Corrie J. E., Webb M. R. (1994) Biochemistry 33, 8262–8271 [DOI] [PubMed] [Google Scholar]
- 18.White H. D., Belknap B., Webb M. R. (1997) Biochemistry 36, 11828–11836 [DOI] [PubMed] [Google Scholar]
- 19.Heeley D. H., Belknap B., White H. D. (2002) Proc. Natl. Acad. Sci. U.S.A. 99, 16731–16736 [DOI] [PMC free article] [PubMed] [Google Scholar]
- 20.Heeley D. H., Belknap B., White H. D. (2006) J. Biol. Chem. 281, 668–676 [DOI] [PubMed] [Google Scholar]
- 21.Grand R. J., Wilkinson J. M., Mole L. E. (1976) Biochem. J. 159, 633–641 [DOI] [PMC free article] [PubMed] [Google Scholar]
- 22.Wilkinson J. M., Grand R. J. (1978) Nature 271, 31–35 [DOI] [PubMed] [Google Scholar]
- 23.Solaro R. J., Moir A. J., Perry S. V. (1976) Nature 262, 615–617 [DOI] [PubMed] [Google Scholar]
- 24.Solaro R. J., Rosevear P., Kobayashi T. (2008) Biochem. Biophys. Res. Commun. 369, 82–87 [DOI] [PMC free article] [PubMed] [Google Scholar]
- 25.Wilkinson J. M. (1980) Eur. J. Biochem. 103, 179–188 [DOI] [PubMed] [Google Scholar]
- 26.van Eerd J. P., Takahshi K. (1976) Biochemistry 15, 1171–1180 [DOI] [PubMed] [Google Scholar]
- 27.Collins J. H., Potter J. D., Horn M. J., Wilshire G., Jackman N. (1973) FEBS Lett. 36, 268–272 [DOI] [PubMed] [Google Scholar]
- 28.Kretsinger R. H., Barry C. D. (1975) Biochim. Biophys. Acta 405, 40–52 [DOI] [PubMed] [Google Scholar]
- 29.Cooper T. A., Ordahl C. P. (1985) J. Biol. Chem. 260, 11140–11148 [PubMed] [Google Scholar]
- 30.Perry S. V. (1998) J. Muscle Res. Cell Motil. 19, 575–602 [DOI] [PubMed] [Google Scholar]
- 31.Anderson P. A., Malouf N. N., Oakeley A. E., Pagani E. D., Allen P. D. (1991) Circ. Res. 69, 1226–1233 [DOI] [PubMed] [Google Scholar]
- 32.Pearlstone J. R., Carpenter M. R., Johnson P., Smillie L. B. (1976) Proc. Natl. Acad. Sci. U.S.A. 73, 1902–1906 [DOI] [PMC free article] [PubMed] [Google Scholar]
- 33.Pearlstone J. R., Carpenter M. R., Smillie L. B. (1986) J. Biol. Chem. 261, 16795–16810 [PubMed] [Google Scholar]
- 34.Leszyk J., Dumaswala R., Potter J. D., Gusev N. B., Verin A. D., Tobacman L. S., Collins J. H. (1987) Biochemistry 26, 7035–7042 [DOI] [PubMed] [Google Scholar]
- 35.Cummins P., Perry S. V. (1974) Biochem. J. 141, 43–49 [DOI] [PMC free article] [PubMed] [Google Scholar]
- 36.Lewis W. G., Smillie L. B. (1980) J. Biol. Chem. 255, 6854–6859 [PubMed] [Google Scholar]
- 37.Humphreys J. E., Cummins P. (1984) J. Mol. Cell. Cardiol. 16, 643–657 [DOI] [PubMed] [Google Scholar]
- 38.Collins J. H., Elzinga M. (1975) J. Biol. Chem. 250, 5915–5920 [PubMed] [Google Scholar]
- 39.Vandekerckhove J., Weber K. (1979) Differentiation 14, 123–133 [DOI] [PubMed] [Google Scholar]
- 40.Siemankowski R. F., Wiseman M. O., White H. D. (1985) Proc. Natl. Acad. Sci. U.S.A. 82, 658–662 [DOI] [PMC free article] [PubMed] [Google Scholar]
- 41.Hiratsuka T. (1983) Biochem. Biophys. Acta 742, 496–508 [DOI] [PubMed] [Google Scholar]
- 42.Spiess M., Steinmetz M. O., Mandinova A., Wolpensinger B., Aebi U., Atar D. (1999) J. Struct. Biol. 126, 98–104 [DOI] [PubMed] [Google Scholar]
- 43.Matsumoto F., Makino K., Maeda K., Patzelt H., Maéda Y., Fujiwara S. (2004) J. Mol. Biol. 342, 1209–1221 [DOI] [PubMed] [Google Scholar]
- 44.White H. D. (1982) Methods Enzymol. 85, 698–708 [DOI] [PubMed] [Google Scholar]
- 45.Chalovich J. M., Eisenberg E. (1982) J. Biol. Chem. 257, 2432–2437 [PMC free article] [PubMed] [Google Scholar]
- 46.Williams D. L., Jr., Greene L. E., Eisenberg E. (1988) Biochemistry 27, 6987–6993 [DOI] [PubMed] [Google Scholar]
- 47.White H. D. (1985) J. Biol. Chem. 260, 982–986 [PubMed] [Google Scholar]
- 48.Tobacman L. S., Adelstein R. S. (1986) Biochemistry 25, 798–802 [DOI] [PubMed] [Google Scholar]
- 49.Steffen W., Sleep J. (2004) Proc. Natl. Acad. Sci. U.S.A. 101, 12904–12909 [DOI] [PMC free article] [PubMed] [Google Scholar]
- 50.Maytum R., Westerdorf B., Jaquet K., Geeves M. A. (2003) J. Biol. Chem. 278, 6696–6701 [DOI] [PubMed] [Google Scholar]
- 51.Maytum R., Lehrer S. S., Geeves M. A. (1999) Biochemistry 38, 1102–1110 [DOI] [PubMed] [Google Scholar]
- 52.Head J. G., Ritchie M. D., Geeves M. A. (1995) Eur. J. Biochem. 227, 694–699 [DOI] [PubMed] [Google Scholar]
- 53.Sun Y. B., Lou F., Irving M. (2009) J. Physiol. 587, 155–163 [DOI] [PMC free article] [PubMed] [Google Scholar]
- 54.Pirani A., Xu C., Hatch V., Craig R., Tobacman L. S., Lehman W. (2005) J. Mol. Biol. 346, 761–772 [DOI] [PubMed] [Google Scholar]