

Abstract
OBJECTIVE
Hepatic steatosis is common in type 2 diabetes. It is causally linked to the features of the metabolic syndrome, liver cirrhosis, and cardiovascular disease. Experimental data have indicated that increased liver fat may impair hepatic perfusion and metabolism. The aim of the current study was to assess hepatic parenchymal perfusion, together with glucose and fatty acid metabolism, in relation to hepatic triglyceride content.
RESEARCH DESIGN AND METHODS
Fifty-nine men with well controlled type 2 diabetes and 18 age-matched healthy normoglycemic men were studied using positron emission tomography to assess hepatic tissue perfusion, insulin-stimulated glucose, and fasting fatty acid metabolism, respectively, in relation to hepatic triglyceride content, quantified by proton magnetic resonance spectroscopy. Patients were divided into two groups with hepatic triglyceride content below (type 2 diabetes-low) or above (type 2 diabetes-high) the median of 8.6%.
RESULTS
Type 2 diabetes-high patients had the highest BMI and A1C and lowest whole-body insulin sensitivity (ANOVA, all P < 0.001). Compared with control subjects and type 2 diabetes-low patients, type 2 diabetes-high patients had the lowest hepatic parenchymal perfusion (P = 0.004) and insulin-stimulated hepatic glucose uptake (P = 0.013). The observed decrease in hepatic fatty acid influx rate constant, however, only reached borderline significance (P = 0.088). In type 2 diabetic patients, hepatic parenchymal perfusion (r = −0.360, P = 0.007) and hepatic fatty acid influx rate constant (r = −0.407, P = 0.007) correlated inversely with hepatic triglyceride content. In a pooled analysis, hepatic fat correlated with hepatic glucose uptake (r = −0.329, P = 0.004).
CONCLUSIONS
In conclusion, type 2 diabetic patients with increased hepatic triglyceride content showed decreased hepatic parenchymal perfusion and hepatic insulin mediated glucose uptake, suggesting a potential modulating effect of hepatic fat on hepatic physiology.
Obesity and type 2 diabetes have grown to epidemic proportions in virtually all parts of the world because of a sedentary lifestyle and positive energy balance (1). Hepatic steatosis is a common finding in type 2 diabetes, which is causally linked to features of the metabolic syndrome, liver cirrhosis, and cardiovascular disease (2,3). The pro-atherogenic serum lipid profile associated with hepatic steatosis is a consequence of an increased synthesis of VLDLs (4). Moreover, hepatic steatosis is associated with impaired insulin signaling in insulin responsive tissues by promoting the formation of humoral factors, (5) and it plays a role in atherogenesis via induction of systemic inflammation (6).
The liver is the central organ for lipid and glucose metabolism, both of which are additionally regulated by insulin (7–9). Liver steatosis is associated with impaired inhibition of hepatic glucose output, but also with impaired insulin clearance (10,11). Using splanchnic catheterization in patients with type 2 diabetes and healthy control subjects, glucose and fatty acid fluxes into the liver have been characterized (12–15). However, those techniques cannot discriminate between the effects of the liver versus those of the other splanchnic tissues. More recently, positron emission tomography (PET) was introduced to noninvasively assess hepatic substrate fluxes (16–18). To date, however, only a few studies have addressed effects of glucometabolic disorders on hepatic disposal of glucose and fatty acids in humans using PET (19–21).
Hepatic steatosis has also been associated with alterations of hepatic hemodynamics. Using noninvasive Doppler sonography, decreased portal vein hemodynamics were demonstrated in patients with fatty liver disease (22,23). Human donor livers, studied during organ retrieval using laser Doppler flowmetry, showed diminished microcirculation compared with control livers (24). Moreover, animal data revealed that graded steatosis decreased parenchymal microcirculation (25). In addition to these highly invasive methods, noninvasive in vivo studies of hepatic perfusion have also been performed using PET (26–28). However, little is known about the relationship between liver triglyceride content with hepatic perfusion or substrate metabolism in human type 2 diabetes.
The purpose of the current study was to measure hepatic perfusion and metabolism and to investigate the relationship with hepatic fat content in type 2 diabetic patients without diabetes-related complications and age-matched healthy male subjects.
RESEARCH DESIGN AND METHODS
Fifty-nine type 2 diabetic patients and 18 healthy control subjects participated in this two-center study, which was approved by the Medical Ethics Review Committees of both centers and performed in compliance with the Declaration of Helsinki. All subjects signed informed consent prior to inclusion. Patients and control subjects were recruited by advertisements in local papers. Male type 2 diabetic patients, aged 45–65 years, without diabetes-related complications were eligible. Inclusion criteria were glycated hemoglobin A1c (A1C) level of 6.5–8.5% at screening, BMI of 25–32 kg/m2, and blood pressure not exceeding 150/85 mmHg (with or without the use of anti-hypertensives). In addition, only moderate alcohol intake was allowed. Patients were excluded if they had a history of or current hepatic or cardiovascular disease. Other exclusion criteria were the use of insulin, fibrates, thiazolidinediones, or other hormonal replacement therapies. Healthy males, aged 45–65 years, with normal glucose metabolism, as assessed by a 75 g oral glucose tolerance test, were eligible as control subjects. Inclusion criteria were BMI of 25–32 kg/m2 and blood pressure below 150/85 mmHg. Patients and healthy control subjects underwent a screening consisting of medical history, physical examination, electrocardiogram, and fasting blood and urine analyses. In addition, patients underwent dobutamine-stress echocardiography to confirm absence of inducible ischemia. All eligible patients entered a 10-week run-in period in which their blood glucose-lowering agents were stopped. Subsequently, all patients were transferred to a comparable dosing of glimepiride monotherapy. Data on myocardial perfusion and substrate uptake have previously been published elsewhere (29).
Study design.
The study protocol was performed during two visits, within the same week. At one of the visits, hepatic triglyceride content was measured using 1H-MRS. In addition, subcutaneous and visceral fat volumes were measured using magnetic resonance imaging (MRI). At the other visit, hepatic perfusion and metabolism were measured using PET. At both occasions, patients visited the clinical research unit in the morning at 08:00 A.M. after an overnight fast of ∼12–15 h and no glucose-lowering agents were taken on the day of the assessments.
Magnetic resonance imaging and spectroscopy.
All magnetic resonance studies were performed at a single center (Leiden) on the same 1.5 Tesla whole-body magnetic resonance scanner (Gyroscan ACS/NT15, Philips, Best, the Netherlands) with subjects at rest and in supine position. Hepatic 1H-MR spectra were obtained as described previously (30). In short, 1H-MRS (magnetic resonance spectroscopy) of the liver was performed with an 8 ml voxel positioned in the right lobe of the liver, avoiding gross vascular structures and adipose tissue depots. Sixty-four averages were collected with water suppression. Spectra were obtained with an echo time of 26 ms and a repetition time of 3,000 ms. Data points (1,024) were collected using a 1,000 Hz spectral line. Without changing any parameters, spectra without water suppression, with a repetition time of 10 s, and with four averages were obtained as an internal reference. 1H-MRS data were fitted using Java-based magnetic resonance user interface software (jMRUI version 2.2, Leuven, Belgium), as described previously (31). Hepatic triglyceride content relative to water was calculated as 100 × (signal amplitude of triglyceride)/(signal amplitude of water). Type 2 diabetic patients were divided according to the median liver fat content in a low (≤8.6%; type 2 diabetes-low) and high (>8.6%; type 2 diabetes-high) liver triglyceride group. Abdominal visceral and subcutaneous fat depots were quantified using MRI (32). A turbo spin echo imaging protocol was used, and imaging parameters included the following: echo time = 11 ms, repetition time = 168 ms, flip angle = 90°, slice thickness = 10 mm. Three consecutive transverse images were obtained during one breath hold, with the middle image at a level just above the fifth lumbar vertebra. The volumes of the visceral and subcutaneous fat depots of all slices were calculated by converting the number of pixels to square centimeters multiplied by the slice thickness. The total volume of the fat depots was calculated by summing fat volumes of all three slices.
PET.
All PET studies were performed at a single center (Amsterdam) using an ECAT EXACT HR+ scanner (Siemens/CTI, Knoxville, TN). Patients received three venous catheters: one in both antecubital veins and one in a hand vein being wrapped into a heated blanket to obtain arterialized blood during the [18F]FDG scan. Hepatic tissue perfusion was performed in 2D mode and quantified using [15O]H2O (1,100 MBq). Hepatic glucose and fatty-acid uptake were performed in 3D mode and quantified using [18F]FDG (170 MBq) and [11C]palmitate (185 MBq), respectively. Perfusion and fatty acid uptake were assessed in the postabsorptive state, whereas glucose uptake was performed under hyperinsulinemic euglycemic conditions. The following scan protocol was used for all studies. After a 10 min transmission scan for attenuation correction, [15O]H2O was injected and a 10 min dynamic emission scan, consisting of 40 frames with progressively increasing frame length, was acquired. Subsequently, a 30 min dynamic emission scan, consisting of 34 frames with progressively increasing frame length, was performed after [11C]palmitate injection. Next, a euglycemic hyperinsulinemic clamp procedure was started using an insulin infusion rate of 40 mU·m−2·min−1 as previously described (33). Euglycemia was maintained by adapting the glucose infusion rate to maintain a plasma glucose level of 5 mmol/l. Whole-body insulin sensitivity (M/I value) was calculated as the mean plasma glucose level between 90 and 120 min from the start of the clamp procedure and then divided by the mean plasma insulin levels in the same time interval. The insulin clearance rate was estimated by dividing the exogenous insulin infusion rate by the steady-state plasma insulin concentrations during the clamp. Under these conditions, the described ratio corresponds to the metabolic clearance rate of systemically administered insulin, minus a small (though variable) part represented by residual insulin secretion. The posthepatic insulin delivery rate of insulin is then calculated as the product of the insulin clearance rate and fasting plasma insulin levels. At steady state (∼90 min after start of clamp) and after a second transmission scan, [18F]FDG was injected and a 60 min dynamic emission of 40 frames with progressively increasing frame length was acquired. Blood samples were collected during all three scans at predefined time points to measure glucose, nonesterified fatty acid, lactate, lipids, and insulin levels. In addition, 11CO2 was measured during the [11C]palmitate scan (29,34).
PET data analysis.
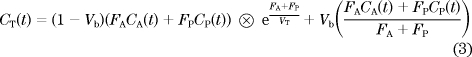
Emission data were corrected for physical decay of the respective tracers and for dead time, scatter, randoms, and photon attenuation. To generate myocardial time–activity curves, large regions (2 cm × 5 cm) of interest (ROIs) were defined in the right lobe of the liver on 4–5 consecutive planes of ordered subset expectation maximization (OSEM) reconstructed (summed) images and then copied to the three dynamic images to obtain one tissue time–activity curve per tracer for each subject. Additionally, circular ROIs (15 mm diameter) were drawn on 10 consecutive planes on the respective dynamic images in the aorta ascendens and grouped to obtain one image-derived input function for each tracer. To quantify hepatic parenchymal perfusion, it was assumed that [15O]H2O in liver can be described by a single-tissue compartment model as proposed and validated by Kudomi and coworkers (27,28).
 |
Here, CT(t), CA(t), and CP(t) represent liver, arterial blood, and portal venous blood time–activity curves, respectively, FA and FP are arterial and portal venous perfusion, respectively, and VT is the partition coefficient of water in liver. The model assumes that CP(t) can be described as a delayed and dispersed version of CA(t) after passage though a notional gut compartment:
Finally, delay Δt, dispersion constant kg, and VT, FA, FP, and fractional hepatic blood volume VB were determined by nonlinear regression using the following operational equation in which the right-hand side of Eq. 2 was substituted for CP(t):
 |
Plasma and tissue time–activity curves for [18F]FDG and [11C]palmitate were quantified using Patlak graphical analysis, as previously described (18–20) and validated in a porcine model (16). In this analysis, a graph is produced by plotting CT(t)/CP(t) against ∫CP(t)/CP(t), where CT(t) and CP(t)Ct are liver and arterial plasma time–activity curves, respectively. The model presupposes irreversible tracer kinetics, and, after exclusion of the first few min when there is no equilibrium yet, a linear relationship is obtained. The hepatic influx rate constant (Ki) is then derived from the slope of a linear fit of the latter part of this plot (10–60 min). Hepatic glucose uptake (HGU) was calculated by multiplying Ki with the plasma glucose concentration. Under hyperinsulinemic conditions, as used in the current study, hepatic glucose output and dephosphorylation of FDG-6-phosphate are considered to be essentially absent (21) and reflux will be minimal. Nevertheless, to account for reversible tracer uptake, data were additionally analyzed by introduction of a rate constant parameter (Kloss) accounting for tracer outflow as previously described (21). The Ki of [11C]palmitate was not multiplied by fasting fatty acid levels, as these may not accurately reflect portal vein concentrations; hence, only Ki is provided. Patlak analysis of [11C]palmitate was confined to the interval from 3 to 10 min after tracer injection, as a previous study in the liver has shown that labeled triglyceride metabolites of [11C]palmitate become detectable after 10 min (35). Although for this time interval no correction for labeled triglycerides was necessary, a correction of [11C]palmitate image-derived input functions for [11C]CO2 was still performed, as described elsewhere (29,34). In addition, the validity of using the Patlak method for analyzing [11C]palmitate data were assessed using spectral analysis (36). Spectral analysis allows for assessment of 1) the number of tissue compartments identifiable in the data and 2) whether these compartments represent irreversible or reversible tracer kinetics, without prior assumptions about the underlying tracer kinetics. Use of this approach showed the validity of the Patlak method, as in all scans only one irreversible compartment was detected for the time interval selected (data not shown).
Biochemical analyses.
Samples were analyzed at one certified central laboratory (Amsterdam). Plasma glucose was quantified using a hexokinase-based technique (Roche Diagnostics, Mannheim, Germany). A1C was determined by high-performance liquid chromatography (Menarini Diagnostics, Florence, Italy; reference values: 4.3–6.1%). Plasma triglycerides, total cholesterol, and HDL cholesterol were determined using enzymatic colorimetric methods (Modular, Hitachi, Japan). Levels of LDL cholesterol were calculated using Friedewald's formula (reference values: 2.0–4.6 mmol/l). Plasma free fatty acids were measured by an enzyme-linked immunoabsorbent assay (Wako Chemicals, Neuss, Germany). Plasma insulin levels were quantified by an immunoradiometric assay (Bayer Diagnostics, Mijdrecht, The Netherlands). Ultrasensitive C-reactive protein (us-CRP) was determined by ELISA (DSL, Webster, TX). The sensitivity was 1.6 μg/l, and the interassay coefficient of variation (CV) ranged from 3 to 5%. In duplo determinations of plasma malondialdehyde, a marker of oxidative stress, were performed by high-performance liquid chromatography after alkaline hydrolysis and reaction with thiobarbituric acid (37). The intraassay CV was 5.7%.
Statistical analyses.
Values are expressed as mean ± SE or as median (interquartile range) in case of skewed distribution. Nonnormally distributed data were log-transformed. Comparisons between control subjects, type 2 diabetes-low, and type 2 diabetes-high patients were performed using ANOVA, including the Bonferroni post hoc multiple comparisons test. Pearson and Spearman (where appropriate) univariate correlation coefficients were calculated, and linear regression was used to control for covariates. Statistical analysis was performed using SPPS for Windows version 15.0 (SPSS Inc., Chicago, IL). A two-tailed probability value < 0.05 was considered significant.
RESULTS
The 1H-MRS protocol was successfully completed in all participants. For technical reasons, four [15O]H2O, two [18F]FDG, and 12 [11C]palmitate scans in type 2 diabetic patients were not available for analysis, as well as one [15O]H2O and two [11C]palmitate scans in healthy control subjects.
Subject characteristics.
Baseline characteristics of patients, categorized according to liver fat content, and control subjects are listed in Table 1. All groups were similar with respect to age, and both type 2 diabetes groups had comparable disease duration and medication use. As expected, anthropometric and hemodynamic parameters (which were all in the normal range) differed significantly between groups. Plasma lipid profiles and liver enzymes were different among groups (Table 1). Metabolic characteristics under postabsorptive and hyperinsulinemic conditions are displayed in Table 2 and showed differences between groups. Plasma fatty acids (postabsorptive state) and plasma lactate (hyperinsulinemia), however, were similar between groups.
TABLE 1.
Subject characteristics
| Control (n = 18) | T2DM-low (n = 29) | T2DM-high (n = 30) | ANOVA P value | |
|---|---|---|---|---|
| Demography | ||||
| Age, years | 54.7 ± 1.3 | 57.1 ± 0.9 | 56.8 ± 1.0 | 0.304 |
| Time since diagnosis of diabetes, years | NA | 4 (2–8) | 4 (3–5) | 0.426 |
| Anthropometry and hemodynamics | ||||
| BMI, kg/m2 | 27.3 ± 0.6 | 26.7 ± 0.5 | 30.0 ± 0.5*,‡ | <0.001 |
| Body surface area, m−2 | 2.1 ± 0.1 | 2.0 ± 0.1 | 2.1 ± 0.1 | 0.085 |
| Waist circumference, cm | 102 ± 2 | 99 ± 2 | 107 ± 2‡ | 0.005 |
| Systolic blood pressure, mmHg | 118 ± 3 | 124 ± 2 | 130 ± 2* | 0.002 |
| Diastolic blood pressure, mmHg | 72 ± 2 | 73 ± 1 | 78 ± 1*,‡ | 0.004 |
| Heart rate, bpm | 56 ± 2 | 64 ± 2† | 66 ± 1* | 0.001 |
| Metabolic characteristics | ||||
| HbA1c, % | 5.4 ± 0.1 | 7.0 ± 0.2† | 7.3 ± 0.2* | <0.001 |
| Total cholesterol, mmol/l | 5.0 ± 0.2 | 4.3 ± 0.1† | 4.5 ± 0.2 | 0.006 |
| LDL cholesterol, mmol/l | 3.2 ± 0.1 | 2.6 ± 0.1† | 2.7 ± 0.7* | 0.007 |
| HDL cholesterol, mmol/l | 1.24 (1.10–1.63) | 1.05 (0.85–1.29)† | 0.96 (0.82–1.09)* | <0.001 |
| Triglycerides, mmol/l | 0.8 (0.6–1.2) | 1.1 (0.8–1.6)† | 1.8 (1.2–2.3)*,‡ | <0.001 |
| ALT, U/l | 25 (18–33) | 26 (21–33) | 37 (30–51)*,‡ | <0.001 |
| AST, U/l | 24 (20–30) | 28 (21–36) | 28 (24–38)* | 0.139 |
| γ-GT, U/l | 23 (17–29) | 23 (18–37) | 42 (35–48)*,‡ | <0.001 |
| usCRP, mg/l | 3.0 (1.7–6.3) | 2.9 (1.6–4.5) | 4.7 (3.5–6.8) ‡ | 0.007 |
| Malondialdehyde, μmol/l | 6.0 ± 0.1 | 9.7 ± 0.5† | 10.0 ± 0.4* | <0.001 |
| Medications, % (n/N) | ||||
| Statins | NA | 38 (11/29) | 47 (14/30) | 0.497 |
| Any antihypertensive medication | NA | 41 (12/29) | 43 (13/30) | 0.879 |
Data are mean ± SE, median (interquartile range). NA indicates not applicable. T2DM-low indicates type 2 diabetic patients with liver triglyceride content ≤8.6%. T2DM-high indicates type 2 diabetic patients with liver triglyceride content >8.6%.
*indicates significant difference between controls and T2DM-high.
†indicates significant difference between controls and T2DM-low.
‡indicates significant difference between T2DM groups. HbA1c, glycated hemoglobin; ALT, alanine aminotransferase; AST, aspartate aminotransferase; γ-GT, γ-glutamyl transferase.
TABLE 2.
Metabolic characteristics in control and type 2 diabetic patients with low and high hepatic triglyceride content
| Control | T2DM-low | T2DM-high | ANOVA P value | |
|---|---|---|---|---|
| Metabolic characteristic (fasting state) | ||||
| Plasma glucose, mmol/l | 5.2 (4.9–5.4) | 8.3 (6.7–10.1)† | 8.0 (7.1–8.7)* | <0.001 |
| Plasma nonesterified fatty acids, umol/l | 470 (360–540) | 450 (410–570) | 500 (370–590) | 0.624 |
| Plasma lactate, mmol/l | 0.8 (0.7–0.9) | 1.1 (0.9–1.3)† | 1.2 (1.0–1.5)*,‡ | <0.001 |
| Plasma insulin, pmol/l | 28 (19–33) | 39 (28–62)† | 78 (62–99)*,‡ | <0.001 |
| Metabolic characteristics (hyperinsulinemic state) | ||||
| Plasma nonesterified fatty acids, umol/l | 40 (20–48) | 50 (30–85)† | 115 (70–173)*,‡ | <0.001 |
| Plasma lactate, mmol/l | 1.1 (0.9–1.3) | 1.0 (0.9–1.2) | 1.1 (1.0–1.4) | 0.560 |
| Plasma insulin, pmol/l | 511 ± 67 | 513 ± 23 | 643 ± 26*,‡ | <0.001 |
| M/I value, mg/(kg · min)/(pmol/l) | 1.13 (0.73–1.66) | 0.68 (0.46–1.0)† | 0.37 (0.17–0.45)*,‡ | <0.001 |
| Insulin clearance rate, ml/min | 1,101 (1,017–1,270) | 1,029 (951–1,262) | 945 (816–1,053)*,‡ | 0.003 |
| Post-hepatic insulin delivery rate, pmol/min | 29 (21–40) | 48 (30–77)† | 78 (56–97)*,‡ | <0.001 |
Data are mean ± SE, median (interquartile range). T2DM-low = type 2 diabetic patients with liver triglyceride content ≤8.6%. T2DM-high = type 2 diabetic patients with liver triglyceride content >8.6%.
*indicates significant difference between controls and T2DM-high.
†indicates significant difference between controls and T2DM-low.
‡indicates significant difference between T2DM groups. M value, whole-body insulin sensitivity; M/I value, M value adjusted for insulin during the steady state.
Hepatic and abdominal fat.
Type 2 diabetes-high patients had, compared with type 2 diabetes-low patients and control subjects, the highest hepatic triglyceride content: 21.6 (12.9–29.4) versus 2.6 (1.5–5.2) and 2.5 (1.0–4.2) %, respectively, ANOVA, P < 0.001. Figure 1 shows a representative MRI image and spectrogram. Subcutaneous and visceral fat volumes were statistically different between groups (736 ± 47 vs. 572 ± 39 and 598 ± 52 ml, P = 0.020) and (440 (333–578) versus 318 (248–404) and 264 (203–340) ml, P < 0.001), respectively.
FIG. 1.

Representative images of OSEM (summed) reconstructed PET images of the liver with [11C]palmitate (A) and [18F]FDG (B) with ROIs used for analysis indicated. Images show uptake in the liver on the left and uptake in the heart on the upper right. Time course of [15O]H2O concentration (C) in the liver (circles), with hepatic perfusion model fit (straight line). Patlak plots of [11C]palmitate (D) and [18F]FDG (E) data points, respectively. The blue dots in parts (D) and (E) were excluded from the analysis. The slope of the linear fits equals the net rate of influx Ki. Note the correspondence between the respective Ki values and the uptake seen in (A) and (B), which is much higher for 11C-palmitate (fasting state) than for 18F-FDG (hyperinsulinemic state). (A high-quality digital representation of this figure is available in the online issue.)
Hepatic parenchymal perfusion and substrate uptake.
Fig. 2 shows representative OSEM (summed) reconstructed PET images of the liver for [11C]palmitate, [18F]FDG, and fits on the data for the respective tracers. Type 2 diabetes-high patients had, compared with type 2 diabetes-low patients and control subjects, the lowest hepatic perfusion (0.647 ± 0.038 vs. 0.795 ± 0.042 and 0.850 ± 0.047 ml·ml−1·min−1, ANOVA, P = 0.004, Fig. 3A). Type 2 diabetes-high patients had, compared with type 2 diabetes-low patients and control subjects, the lowest insulin mediated HGU (20.4 ± 1.9 vs. 24.1 ± 2.1 and 30.7 ± 3.0 μmol·ml−1·min−1, respectively, P = 0.013, Figure 3B). No tracer loss from the liver could be detected during scan time. The mean hepatic fatty acid influx rate constant (Fig. 3C) was lower in type 2 diabetes-high patients compared with type 2 diabetes-low patients and control subjects, but only reached borderline significance (P = 0.088).
FIG. 2.

Hepatic perfusion (A), HGU (B), and hepatic fatty acid influx rate constant (C), in control subjects (□), type 2 diabetic patients with low liver triglyceride content (T2DM low) (■), and type 2 diabetic patients with high liver triglyceride content (T2DM high) (gray scale). Ki = hepatic influx rate constant. P values are from Bonferroni post hoc analysis. For P ANOVA, see text.
FIG. 3.

Correlations between hepatic triglyceride content % and hepatic perfusion (A), hepatic fatty acid influx rate constant (B), and HGU (C), in pooled analysis of type 2 diabetic patients and control subjects.
Correlations between hepatic fat content, parenchymal perfusion, and substrate uptake.
In a pooled analysis, hepatic triglyceride content correlated inversely with hepatic perfusion (r = −0.402, P = 0.001; Fig. 3A) and hepatic fatty acid influx rate constant (r = −0.335, P = 0.004; Fig. 3B), which both remained significant after correction for diabetic status, A1C, BMI, visceral fat content, plasma fatty acid, and lactate levels. Hepatic triglyceride content also correlated inversely with HGU (r = −0.329, P = 0.004; Fig. 3C), which remained significant after correction for diabetic status, A1C, BMI, and visceral fat content, but not when additionally correcting for plasma fatty acid or lactate. Hepatic triglyceride content, but not hepatic perfusion or hepatic fatty acid influx rate constant, were correlated with M/I value (r = −0.684, P < 0.001), malondialdehyde (r = 0.427, P < 0.001), usCRP (r = 0.326, P = 0.005), insulin clearance rate (r = −0.459, P < 0.001), and visceral (r = 0.612, P < 0.001) and subcutaneous fat (r = 0.392, P < 0.001) volumes. The hepatic glucose influx rate constant correlated inversely with plasma fatty acid levels (r = −0.246, P = 0.036), A1C (r = −0.310, P = 0.007), and malondialdehyde (r = −0.434, P < 0.001).
In type 2 diabetic patients alone, hepatic fat content correlated inversely with hepatic perfusion (r = −0.360, P = 0.007) and hepatic fatty acid influx rate constant (r = −0.407, P = 0.007), whereas borderline significant associations were found with HGU (r = −0.245, P = 0.057). Hepatic fat content, but not hepatic perfusion or hepatic fatty acid influx rate constant, correlated with M/I value (r = −0.657, P < 0.001) and usCRP (0.375, P = 0.005), insulin clearance rate (r = −0.436, P = 0.001), and visceral (r = 0.540, P < 0.001) and subcutaneous fat (r = 0.375, P = 0.003) volumes. The hepatic glucose influx rate constant rate is inversely correlated with malondialdehyde (r = −0.380, P = 0.004) and borderline correlated with plasma fatty acids (r = −0.251, P = 0.059). None of these correlations were observed in control subjects alone.
DISCUSSION
Using MRS and PET in the same patients, the current study provides evidence for a potential modulating effect of hepatic fat content on hepatic physiology in type 2 diabetic patients. Reduced hepatic parenchymal perfusion, insulin-mediated HGU, and a borderline decrease in hepatic fatty acid influx rate constant were observed in type 2 diabetic patients with increased hepatic triglyceride content. Moreover, hepatic triglyceride content was directly and inversely related to hepatic perfusion, hepatic glucose, and fatty acid metabolism.
Hepatic fat content and relationship with hepatic parenchymal perfusion.
Although flow through portal vein and hepatic artery is readily accessible using Doppler sonography, (22,23) in vivo studies on human hepatic (parenchymal) perfusion are limited due to the often (highly) invasive methodology required. Indirect methods for measuring hepatic blood flow have been used and include the assessment of clearance or dilution of a dye or marker (gas or microspheres), which have a wider range of clinical applicability than the direct methods (38). Moreover, noninvasive measurements of hepatic perfusion using PET with the freely diffusible flow tracer [15O]H2O have been shown to provide reliable estimates of hepatic blood flow, when taking into account the dual input from hepatic artery and vena porta (27,28). In the current study, decreased hepatic parenchymal perfusion was observed in type 2 diabetic patients with increased liver triglyceride content but not in those type 2 diabetic patients with low liver triglyceride content, as compared with control subjects, implying a potential modulating effect of liver fat per se.
These results extend data from previous studies suggesting a modulating effect of increased hepatic fat content on hepatic blood flow velocity and perfusion. It has been shown that the level of fatty infiltration in humans alters portal vein hemodynamics in a graded way (22,23). Especially under stress conditions, such as during ischemia-reperfusion or transplantation, the fatty liver has shown decreased adaptability and hence increased risk of failure (39). In addition to changes in hepatic macrocirculation, alterations in the hepatic microvasculature have been implicated. In steatotic livers of human donors, laser Doppler flowmetry revealed a significant decrease in hepatic parenchymal perfusion (24). In New Zealand white rabbits with diet-induced hepatic steatosis, Seifalian et al. (25) found that graded steatosis progressively reduced hepatic blood flow velocity and hepatic parenchymal perfusion. Moreover, they observed an inverse correlation between the degree of fat infiltration and both total hepatic blood flow and the hepatic parenchymal perfusion, with the biggest on the latter.
The mechanisms by which increased liver fat affects hepatic perfusion include factors like structural changes in the liver, a microvascular inflammatory response, and possibly vascular insulin resistance. Experimental studies in several animal models of diet and genetically induced hepatic steatosis have shown that reductions in sinusoidal perfusion are initially due to enlarged hepatic parenchymal cells overloaded with lipids (40–43). Consequently, parenchymal cell plates become wider, which results in narrowing and deformation of the lumen of sinusoids, reducing their volume. This eventually leads to sinusoidal dysfunction and impaired hepatic perfusion (42). Increased leukocyte adherence to endothelial cells, expression of adhesion molecules, and upregulation of NF-κB have been shown to promote reactive oxygen species generation, with subsequent inflammation and formation of vasoactive metabolites, all of which may be implicated in decreased hepatic parenchymal perfusion (44). Moreover, insulin resistance, one of the hallmarks of type 2 diabetes pathology and strongly associated with hepatic steatosis, may additionally decrease hepatic microcirculatory flow by impaired insulin receptor signaling via the PI3-kinase/Akt/eNOS cascade, which in turn may result in decreased nitric oxygen synthesis by endothelial cells and hence decreased nitric oxygen mediated vasodilation (44,45). In addition, stimulated signaling through the insulin-receptor mediated MAPK/ERK pathway may additionally favor vasoconstriction and abnormal angiogenesis, contributing to impaired microvascular hepatic perfusion (46). Although in the current study no direct relationships were found between hepatic parenchymal perfusion and whole-body insulin sensitivity, oxidative stress, or usCRP, the hepatic parenchymal perfusion was inversely correlated with hepatic fat content. Therefore, more studies are warranted to further explore these interrelations.
Hepatic triglyceride content and relationship with substrate metabolism.
Interestingly, only a borderline significant difference was found in the fasting hepatic fatty acid influx rate constant across groups, caused by the lower uptake rate in type 2 diabetes-high, but not type 2 diabetes-low, patients. Depending on the condition, fatty acid extraction or uptake has been reported to be unaltered (13,14), decreased (15,19), or increased (14,47). Using PET with the fatty acid analog tracer 14(R,S)-18F-fluoro-6-thia-heptadecanoic acid, Iozzo et al. found decreased fatty acid extraction in 10 fasting patients with impaired glucose tolerance compared with eight healthy control subjects (19). These findings were primarily explained by reverse substrate competition, as plasma glucose sampled from arterialized blood correlated inversely with fatty acid uptake. In the current study, during the [11C]palmitate PET scan, only venous sampling was performed and hence this relation could not be tested reliably.
In the current study, previous findings were confirmed, indicating that both type 2 diabetes and liver fat content are inversely related to insulin-stimulated hepatic glucose uptake (20,48). Hepatic glucose influx and output are directly regulated by insulin through several enzymes. Insulin initializes the upregulation of glucokinase and glycogen synthase and conversely inhibits glucose-6-phosphatase and glycogen phosphorylase in hepatocytes (8). In hepatic insulin resistance, impaired activity of these key enzymes may therefore lead to decreased insulin-stimulated HGU (49).
An indirect mechanism underlying the negative relationship between liver fat and HGU may be increased fatty acid fluxes related to increased lipolysis from insulin-resistant adipose tissue. The inverse association between plasma fatty acids and HGU rate is in line with this assumption. Furthermore, other studies have shown that a combined intralipid/heparine infusion increased plasma fatty acids and reduced splanchnic and peripheral glucose uptake in type 2 diabetic patients (50). Moreover, although the current study is aimed at HGU, it should be mentioned that hepatic glucose uptake only constitutes a small percentage of net change in glucose metabolism during the clamp.
Finally, the liver is the main site involved in insulin clearance and degradation (51). Recently, Kotronen et al. (11) found that increased hepatic fat was associated with impaired insulin clearance in 80 nondiabetic subjects. The present inverse relationship between liver fat content and insulin clearance is in line with those results.
Limitations.
In the current study, we used 1H-MRS to measure hepatic triglyceride content. To that purpose, only three magnetic resonance slides of the liver were made for voxel localization, and hence, total liver volume could not be calculated. Thus, the study's conclusions are limited to liver tissue studied within the volume of the voxel. Although liver volume was probably increased in the type 2 diabetes-high group, the effect of an increased liver volume on our findings cannot be established. From animal studies, however, it seems less likely that an increase in liver volume substantially influenced our findings (25,52). In addition to a decrease in the total number of hepatocytes, many structural changes in the fatty liver may negatively influence hepatic metabolism and parenchymal perfusion.
In conclusion, type 2 diabetic patients with high liver triglyceride content have a poorer metabolic profile than age-matched control subjects and type 2 diabetic patients with a liver triglyceride content in the normal range. In addition, type 2 diabetic patients with high liver triglyceride content show decreased hepatic parenchymal perfusion and insulin-mediated glucose uptake. Finally, hepatic triglyceride content is inversely related to hepatic parenchymal perfusion, HGU, and hepatic fatty acid influx rate constant, suggesting a potential modulating effect of hepatic fat on hepatic physiology.
ACKNOWLEDGMENTS
This investigator-initiated study was supported by Eli Lilly, the Netherlands. M.D. reports receiving consulting and lecture fees from Eli Lilly, Merck, Novartis, Pfizer, and sanofi-aventis and research grants from Eli Lilly, Merck, Novartis, Novo Nordisk, and GlaxoSmithKline. R.J.H. is employed by Eli Lilly & Company as of January 2008. No other potential conflicts of interest relevant to this article were reported.
L.J.R. conceived and designed the study, analyzed and interpreted the data, and drafted and revised the manuscript. R.W.M. conceived and designed the study, analyzed and interpreted the data, and revised the manuscript. M.L. analyzed and interpreted the data, modeled PET data, provided technical assistance, and drafted and revised the manuscript. H.J.L., J.A.R., and A.R. conceived and designed the study and revised the manuscript. J.W.T. analyzed and interpreted the study and revised the manuscript. R.J.H., A.A.L., and J.W.A.S. conceived and designed the study and revised the manuscript. M.D. conceived and designed the study, analyzed and interpreted the data, and drafted, cowrote, and revised the manuscript.
Footnotes
The costs of publication of this article were defrayed in part by the payment of page charges. This article must therefore be hereby marked “advertisement” in accordance with 18 U.S.C. Section 1734 solely to indicate this fact.
REFERENCES
- 1.James WP. The epidemiology of obesity: the size of the problem. J Intern Med 2008;263:336–352 [DOI] [PubMed] [Google Scholar]
- 2.Kotronen A, Yki-Järvinen H. Fatty liver: a novel component of the metabolic syndrome. Arterioscler Thromb Vasc Biol 2008;28:27–38 [DOI] [PubMed] [Google Scholar]
- 3.Lautamäki R, Borra R, Iozzo P, Komu M, Lehtimäki T, Salmi M, Jalkanen S, Airaksinen KE, Knuuti J, Parkkola R, Nuutila P. Liver steatosis coexists with myocardial insulin resistance and coronary dysfunction in patients with type 2 diabetes. Am J Physiol Endocrinol Metab 2006;291:E282–E290 [DOI] [PubMed] [Google Scholar]
- 4.Taskinen MR. Diabetic dyslipidaemia: from basic research to clinical practice. Diabetologia 2003;46:733–749 [DOI] [PubMed] [Google Scholar]
- 5.Hwang JH, Stein DT, Barzilai N, Cui MH, Tonelli J, Kishore P, Hawkins M. Increased intrahepatic triglyceride is associated with peripheral insulin resistance: in vivo MR imaging and spectroscopy studies. Am J Physiol Endocrinol Metab 2007;293:E1663–E1669 [DOI] [PubMed] [Google Scholar]
- 6.Pepys MB, Hirschfield GM. C-reactive protein: a critical update. J Clin Invest 2003;111:1805–1812 [DOI] [PMC free article] [PubMed] [Google Scholar]
- 7.Leclercq IA, Da Silva Morais A, Schroyen B, Van Hul N, Geerts A. Insulin resistance in hepatocytes and sinusoidal liver cells: mechanisms and consequences. J Hepatol 2007;47:142–156 [DOI] [PubMed] [Google Scholar]
- 8.Postic C, Dentin R, Girard J. Role of the liver in the control of carbohydrate and lipid homeostasis. Diabete Metab 2004;30:398–408 [DOI] [PubMed] [Google Scholar]
- 9.Nguyen P, Leray V, Diez M, Serisier S, Le BJ, Siliart B, Dumon H. Liver lipid metabolism. J Anim Physiol Anim Nutr (Berl) 2008;92:272–283 [DOI] [PubMed] [Google Scholar]
- 10.Seppälä-Lindroos A, Vehkavaara S, Häkkinen AM, Goto T, Westerbacka J, Sovijärvi A, Halavaara J, Yki-Järvinen H. Fat accumulation in the liver is associated with defects in insulin suppression of glucose production and serum free fatty acids independent of obesity in normal men. J Clin Endocrinol Metab 2002;87:3023–3028 [DOI] [PubMed] [Google Scholar]
- 11.Kotronen A, Vehkavaara S, Seppälä-Lindroos A, Bergholm R, Yki-Järvinen H. Effect of liver fat on insulin clearance. Am J Physiol Endocrinol Metab 2007;293:E1709–E1715 [DOI] [PubMed] [Google Scholar]
- 12.DeFronzo RA, Gunnarsson R, Björkman O, Olsson M, Wahren J. Effects of insulin on peripheral and splanchnic glucose metabolism in noninsulin-dependent (type II) diabetes mellitus. J Clin Invest 1985;76:149–155 [DOI] [PMC free article] [PubMed] [Google Scholar]
- 13.Sidossis LS, Mittendorfer B, Walser E, Chinkes D, Wolfe RR. Hyperglycemia-induced inhibition of splanchnic fatty acid oxidation increases hepatic triacylglycerol secretion. Am J Physiol 1998;275:E798–E805 [DOI] [PubMed] [Google Scholar]
- 14.Wahren J, Sato Y, Ostman J, Hagenfeldt L, Felig P. Turnover and splanchnic metabolism of free fatty acids and ketones in insulin-dependent diabetics at rest and in response to exercise. J Clin Invest 1984;73:1367–1376 [DOI] [PMC free article] [PubMed] [Google Scholar]
- 15.Waldhäusl WK, Gasić S, Bratusch-Marrain P, Nowotny P. The 75-g oral glucose tolerance test: effect on splanchnic metabolism of substrates and pancreatic hormone release in healthy man. Diabetologia 1983;25:489–495 [DOI] [PubMed] [Google Scholar]
- 16.Iozzo P, Jarvisalo MJ, Kiss J, Borra R, Naum GA, Viljanen A, Viljanen T, Gastaldelli A, Buzzigoli E, Guiducci L, Barsotti E, Savunen T, Knuuti J, Haaparanta-Solin M, Ferrannini E, Nuutila P. Quantification of liver glucose metabolism by positron emission tomography: validation study in pigs. Gastroenterology 2007;132:531–542 [DOI] [PubMed] [Google Scholar]
- 17.Iozzo P, Turpeinen AK, Takala T, Oikonen V, Solin O, Ferrannini E, Nuutila P, Knuuti J. Liver uptake of free fatty acids in vivo in humans as determined with 14(R,S)-[18F]fluoro-6-thia-heptadecanoic acid and PET. Eur J Nucl Med Mol Imaging 2003;30:1160–1164 [DOI] [PubMed] [Google Scholar]
- 18.Iozzo P, Geisler F, Oikonen V, Mäki M, Takala T, Solin O, Ferrannini E, Knuuti J, Nuutila P. 18F-FDG PET Study: Insulin stimulates liver glucose uptake in humans: an 18F-FDG PET Study. J Nucl Med 2003;44:682–689 [PubMed] [Google Scholar]
- 19.Iozzo P, Turpeinen AK, Takala T, Oikonen V, Bergman J, Grönroos T, Ferrannini E, Nuutila P, Knuuti J. Defective liver disposal of free fatty acids in patients with impaired glucose tolerance. J Clin Endocrinol Metab 2004;89:3496–3502 [DOI] [PubMed] [Google Scholar]
- 20.Iozzo P, Hallsten K, Oikonen V, Virtanen KA, Kemppainen J, Solin O, Ferrannini E, Knuuti J, Nuutila P. Insulin-mediated hepatic glucose uptake is impaired in type 2 diabetes: evidence for a relationship with glycemic control. J Clin Endocrinol Metab 2003;88:2055–2060 [DOI] [PubMed] [Google Scholar]
- 21.Iozzo P, Lautamaki R, Geisler F, Virtanen KA, Oikonen V, Haaparanta M, Yki-Jarvinen H, Ferrannini E, Knuuti J, Nuutila P. Non-esterified fatty acids impair insulin-mediated glucose uptake and disposition in the liver. Diabetologia 2004;47:1149–1156 [DOI] [PubMed] [Google Scholar]
- 22.Balci A, Karazincir S, Sumbas H, Oter Y, Egilmez E, Inandi T. Effects of diffuse fatty infiltration of the liver on portal vein flow hemodynamics. J Clin Ultrasound 2008;36:134–140 [DOI] [PubMed] [Google Scholar]
- 23.Erdogmus B, Tamer A, Buyukkaya R, Yazici B, Buyukkaya A, Korkut E, Alcelik A, Korkmaz U. Portal vein hemodynamics in patients with non-alcoholic fatty liver disease. Tohoku J Exp Med 2008;215:89–93 [DOI] [PubMed] [Google Scholar]
- 24.Seifalian AM, Chidambaram V, Rolles K, Davidson BR. In vivo demonstration of impaired microcirculation in steatotic human liver grafts. Liver Transpl Surg 1998;4:71–77 [DOI] [PubMed] [Google Scholar]
- 25.Seifalian AM, Piasecki C, Agarwal A, Davidson BR. The effect of graded steatosis on flow in the hepatic parenchymal microcirculation. Transplantation 1999;68:780–784 [DOI] [PubMed] [Google Scholar]
- 26.Taniguchi H, Oguro A, Koyama H, Masuyama M, Takahashi T. Analysis of models for quantification of arterial and portal blood flow in the human liver using PET. J Comput Assist Tomogr 1996;20:135–144 [DOI] [PubMed] [Google Scholar]
- 27.Kudomi N, Slimani L, Järvisalo MJ, Kiss J, Lautamäki R, Naum GA, Savunen T, Knuuti J, Iida H, Nuutila P, Iozzo P. Non-invasive estimation of hepatic blood perfusion from H215O PET images using tissue-derived arterial and portal input functions. Eur J Nucl Med Mol Imaging 2008;35:1899–1911 [DOI] [PMC free article] [PubMed] [Google Scholar]
- 28.Slimani L, Kudomi N, Oikonen V, Jarvisalo M, Kiss J, Naum A, Borra R, Viljanen A, Sipila H, Ferrannini E, Savunen T, Nuutila P, Iozzo P. Quantification of liver perfusion with [15O]H2O-PET and its relationship with glucose metabolism and substrate levels. J Hepatol 2008;48:974–982 [DOI] [PubMed] [Google Scholar]
- 29.van der Meer RW, Rijzewijk LJ, de Jong HW, Lamb HJ, Lubberink M, Romijn JA, Bax JJ, de Roos A, Kamp O, Paulus WJ, Heine RJ, Lammertsma AA, Smit JW, Diamant M. Pioglitazone improves cardiac function and alters myocardial substrate metabolism without affecting cardiac triglyceride accumulation and high-energy phosphate metabolism in patients with well-controlled type 2 diabetes mellitus. Circulation 2009;119:2069–2077 [DOI] [PubMed] [Google Scholar]
- 30.van der Meer RW, Hammer S, Lamb HJ, Frölich M, Diamant M, Rijzewijk LJ, de Roos A, Romijn JA, Smit JW. Effects of short-term high-fat, high-energy diet on hepatic and myocardial triglyceride content in healthy men. J Clin Endocrinol Metab 2008;93:2702–2708 [DOI] [PubMed] [Google Scholar]
- 31.Naressi A, Couturier C, Devos JM, Janssen M, Mangeat C, de Beer R, Graveron-Demilly D. Java-based graphical user interface for the MRUI quantitation package. MAGMA 2001;12:141–152 [DOI] [PubMed] [Google Scholar]
- 32.Elbers JM, Haumann G, Asscheman H, Seidell JC, Gooren LJ. Reproducibility of fat area measurements in young, non-obese subjects by computerized analysis of magnetic resonance images. Int J Obes Relat Metab Disord 1997;21:1121–1129 [DOI] [PubMed] [Google Scholar]
- 33.DeFronzo RA, Tobin JD, Andres R. Glucose clamp technique: a method for quantifying insulin secretion and resistance. Am J Physiol 1979;237:E214–E223 [DOI] [PubMed] [Google Scholar]
- 34.Herrero P, Peterson LR, McGill JB, Matthew S, Lesniak D, Dence C, Gropler RJ. Increased myocardial fatty acid metabolism in patients with type 1 diabetes mellitus. J Am Coll Cardiol 2006;47:598–604 [DOI] [PubMed] [Google Scholar]
- 35.Guiducci L, Järvisalo M, Kiss J, Någren K, Viljanen A, Naum AG, Gastaldelli A, Savunen T, Knuuti J, Salvadori PA, Ferrannini E, Nuutila P, Iozzo P. [11C]palmitate kinetics across the splanchnic bed in arterial, portal and hepatic venous plasma during fasting and euglycemic hyperinsulinemia. Nucl Med Biol 2006;33:521–528 [DOI] [PubMed] [Google Scholar]
- 36.Cunningham VJ, Jones T. Spectral analysis of dynamic PET studies. J Cereb Blood Flow Metab 1993;13:15–23 [DOI] [PubMed] [Google Scholar]
- 37.van de Kerkhof J, Schalkwijk CG, Konings CJ, Cheriex EC, van der Sande FM, Scheffer PG, ter Wee PM, Leunissen KM, Kooman JP. Nepsilon-(carboxymethyl)lysine, Nepsilon-(carboxyethyl)lysine and vascular cell adhesion molecule-1 (VCAM-1) in relation to peritoneal glucose prescription and residual renal function; a study in peritoneal dialysis patients. Nephrol Dial Transplant 2004;19:910–916 [DOI] [PubMed] [Google Scholar]
- 38.Johnson DJ, Muhlbacher F, Wilmore DW. Measurement of hepatic blood flow. J Surg Res 1985;39:470–481 [DOI] [PubMed] [Google Scholar]
- 39.Sun CK, Zhang XY, Zimmermann A, Davis G, Wheatley AM. Effect of ischemia-reperfusion injury on the microcirculation of the steatotic liver of the Zucker rat. Transplantation 2001;72:1625–1631 [DOI] [PubMed] [Google Scholar]
- 40.Sato N, Eguchi H, Inoue A, Matsumura T, Kawano S, Kamada T. Hepatic microcirculation in Zucker fatty rats. Adv Exp Med Biol 1986;200:477–483 [DOI] [PubMed] [Google Scholar]
- 41.Teramoto K, Bowers JL, Kruskal JB, Clouse ME. Hepatic microcirculatory changes after reperfusion in fatty and normal liver transplantation in the rat. Transplantation 1993;56:1076–1082 [DOI] [PubMed] [Google Scholar]
- 42.McCuskey RS, Ito Y, Robertson GR, McCuskey MK, Perry M, Farrell GC. Hepatic microvascular dysfunction during evolution of dietary steatohepatitis in mice. Hepatology 2004;40:386–393 [DOI] [PubMed] [Google Scholar]
- 43.Sun CK, Zhang XY, Wheatley AM. Increased NAD(P)H fluorescence with decreased blood flow in the steatotic liver of the obese Zucker rat. Microvasc Res 2003;66:15–21 [DOI] [PubMed] [Google Scholar]
- 44.Brock RW, Dorman RB. Obesity, insulin resistance and hepatic perfusion. Microcirculation 2007;14:339–347 [DOI] [PubMed] [Google Scholar]
- 45.Vicent D, Ilany J, Kondo T, Naruse K, Fisher SJ, Kisanuki YY, Bursell S, Yanagisawa M, King GL, Kahn CR. The role of endothelial insulin signaling in the regulation of vascular tone and insulin resistance. J Clin Invest 2003;111:1373–1380 [DOI] [PMC free article] [PubMed] [Google Scholar]
- 46.Jiang ZY, Lin YW, Clemont A, Feener EP, Hein KD, Igarashi M, Yamauchi T, White MF, King GL. Characterization of selective resistance to insulin signaling in the vasculature of obese Zucker (fa/fa) rats. J Clin Invest 1999;104:447–457 [DOI] [PMC free article] [PubMed] [Google Scholar]
- 47.Namdaran K, Bracy DP, Lacy DB, Johnson JL, Bupp JL, Wasserman DH. Gut and liver fat metabolism in depancreatized dogs: effects of exercise and acute insulin infusion. J Appl Physiol 1997;83:1339–1347 [DOI] [PubMed] [Google Scholar]
- 48.Borra R, Lautamäki R, Parkkola R, Komu M, Sijens PE, Hällsten K, Bergman J, Iozzo P, Nuutila P. Inverse association between liver fat content and hepatic glucose uptake in patients with type 2 diabetes mellitus. Metabolism 2008;57:1445–1451 [DOI] [PubMed] [Google Scholar]
- 49.Barzilai N, Rossetti L. Role of glucokinase and glucose-6-phosphatase in the acute and chronic regulation of hepatic glucose fluxes by insulin. J Biol Chem 1993;268:25019–25025 [PubMed] [Google Scholar]
- 50.Bajaj M, Pratipanawatr T, Berria R, Pratipanawatr W, Kashyap S, Cusi K, Mandarino L, DeFronzo RA. Free fatty acids reduce splanchnic and peripheral glucose uptake in patients with type 2 diabetes. Diabetes 2002;51:3043–3048 [DOI] [PubMed] [Google Scholar]
- 51.Duckworth WC, Kitabchi AE. Insulin metabolism and degradation. Endocr Rev 1981;2:210–233 [DOI] [PubMed] [Google Scholar]
- 52.Altunkaynak BZ, Ozbek E. Overweight and structural alterations of the liver in female rats fed a high-fat diet: a stereological and histological study. Turk J Gastroenterol 2009;20:93–103 [PubMed] [Google Scholar]