Abstract
Complex mixtures containing O-linked glycopeptides bearing SA1-0GalGalNAc structures, or single GalNAc units were subjected to CID and ETD analysis on a linear ion trap – Orbitrap mass spectrometer and the resulting data was analyzed using the Protein Prospector software. An overview of the structural information provided by the different fragmentation techniques, as well as their limitations is presented. We illustrate the importance of the complementary information in the MS survey scans as well as the different MS/MS techniques. We also present some unique features offered by Protein Prospector that are advantageous in glycopeptide analysis: i) considering a modification that will produce a neutral loss, without “labeling” the original modification site; ii) merging CID and ETD search results; iii) permitting the comparison of different modification site-assignments. Although these data were obtained from secreted glycopeptides, the observations and conclusions are also valid for the intracellular regulatory O-GlcNAc modification.
Keywords: O-glycosylation, glycopeptides, CID, ETD, site-assignment, database search
Introduction
Oligosaccharides may modify the side-chains of Asn, Ser, Thr and Trp residues, and these modifications are specified as N-, O- and C-linked glycosylations depending on the nature of the carbohydrate-peptide bond1, 2. Among these, the characterization of O-linked modifications is the most challenging for a number of reasons. There is no known consensus motif for O-glycosylation and a series of different sugar units, such as GalNAc, GlcNAc, Glc, Fuc, Man and Xyl, may be directly linked to Ser or Thr-residues1, 3. In addition, proteins may be modified by single carbohydrate units at each site or by elongated simple or complex structures1, 3. Carbohydrate heterogeneity at modification sites as well as variable site occupancy also add to the complexity of glycosylation. Removal of the “interfering” protein and subsequent analysis of the liberated carbohydrate had been common practice until the newest ionization techniques (MALDI and ESI) permitted the analysis of intact glycopeptides1, 3. The CID fragmentation behavior of O-linked glycopeptides is well documented 3, 4, 5, 6. Briefly, glycosidic bond cleavages are the favored fragmentation steps and mostly unmodified peptide fragments are detected. If any peptide backbone fragments are observed, these are usually after a gas-phase rearrangement reaction that eliminates the carbohydrate while “restores” the hydroxyl group on the previously modified side-chain to give unmodified peptide fragment ions. In the newest MS/MS activation technique, electron-transfer dissociation (ETD) the fragmentation follows an entirely different pathway, yielding mostly c and z· fragments and leaving the peptide side-chains (including modifications) intact. Thus, ETD represents a promising alternative for the analysis of fragile post-translational modifications, and indeed, successful ETD analysis of O-linked glycopeptides has been reported7, 8.
Here we describe the mass spectrometric characterization of O-linked glycopeptides bearing SA1-0--GalGalNAc structures. These glycopeptides were enriched from bovine serum using lectin-affinity chromatography and were then subjected to CID and ETD analysis on a linear ion trap – Orbitrap hybrid mass spectrometer either intact or after exoglycosidase treatment, which leaves only the core GalNAc residues attached. Database searches and fragment assignments were accomplished by Protein Prospector, allowing unambiguous identification of several glycosylation sites. Here we present a summary of the information the different MS/MS techniques provide, and how these results are utilized by the existing computational tools. We also describe the limitations of the methods. Our conclusions are valid for glycopeptides with other similarly simple O-linked carbohydrate structures, such as the regulatory O-GlcNAc modification8, 9. In addition, we outline a more utilitarian data interpretation approach that employs the combination of all available data. This more efficient use of the available information is highly desirable for addressing such complex problems as O-glycosylation, but would also be appropriate for the characterization of other post-translational modifications.
Experimental
Secreted glycopeptides were enriched from bovine serum after tryptic digestion using Jacalin-affinity chromatography. An aliquot of the enriched glycopeptides was subjected to neuraminidase and β–galactosidase treatment (sample preparation described in10).
LC/MS
Reversed phase chromatography was performed using a nanoACQUITY HPLC system (Waters) with a nanoACQUITY UPLC BEH C18 column (1.7 μm, 75 μm × 200 mm); 0.1% formic acid in water, and 0.1% formic acid in acetonitrile were solvent A and B, respectively. Peptides were eluted by a gradient from 2% to 35% solvent B in 35 min followed by a short wash at 50% solvent B, before returning to starting conditions. Data acquisition was carried out on a linear ion trap – Orbitrap mass spectrometer (LTQ-Orbitrap, Thermo Fisher Scientific) in a data-dependent fashion, acquiring sequential CID and ETD spectra of the 3 most intense multiply charged precursor ions identified from each MS survey scan. MS spectra were acquired in the Orbitrap; CID and ETD spectra in the linear ion trap. Ion populations within the trapping instruments were controlled by integrated automatic gain control (AGC). For CID, the AGC target was set to 30000, with dissociation at 35% of normalized collision energy and an activation time of 30 ms. For ETD, the AGC target values were set to 30000 and 200000 for the isolated precursor cations and fluoranthene anions, respectively, and allowing 100 ms of ion/ion reaction time. Supplemental activation for the ETD experiments was enabled. Dynamic exclusion was also enabled, with an exclusion time of 60 s.
Data interpretation
Peaklists were created using Bioworks 3.3.1 SP1. Database searching was performed by ProteinProspector v.5.3 (http://prospector.ucsf.edu) against the SwissProt database (4.24.2008), supplemented with a random sequence for each entry, and species specified as Bos taurus (10170/725568 entries searched). For both CID and ETD data, trypsin was selected as the enzyme, 1 missed cleavage was permitted, and non-specific cleavage was also permitted at one of the peptide termini. This non-specific cleavage had to be considered because of the sample source, not because of sample preparation issues: proteolytic activity is rampant in serum. Mass accuracy was set to 15 ppm for precursor ions and 0.6 Da for the fragment ions. Carbamidomethylation of Cys residues was a fixed modification, while the acetylation of protein N-termini; Met oxidation; and the cyclization of N-terminal Gln residues; and HexHexNAc or SAHexHexNAc modification on Thr and Ser residues were permitted. A maximum of 2 modifications per peptide were considered. The same search parameters were used for the ETD data after the exoglycosidase digestion except Ser and Thr residues were considered modified by HexNAc only and 3 modifications per peptide were permitted. Search parameters for CID data after the exoglycosidase treatment also included a modification of 203-203.1 Da on Ser and Thr residues that lead to a neutral loss of the same mass value; i.e. fragments were assumed to be unmodified. All glycopeptide identifications having a maximal expectation value of 0.3 were manually inspected.
Results and Discussion
O-linked glycopeptides bearing SA1-0GalGalNAc structures were enriched from bovine serum using Jacalin affinity chromatography and then subjected to CID and ETD analysis on a linear ion trap – Orbitrap mass spectrometer.
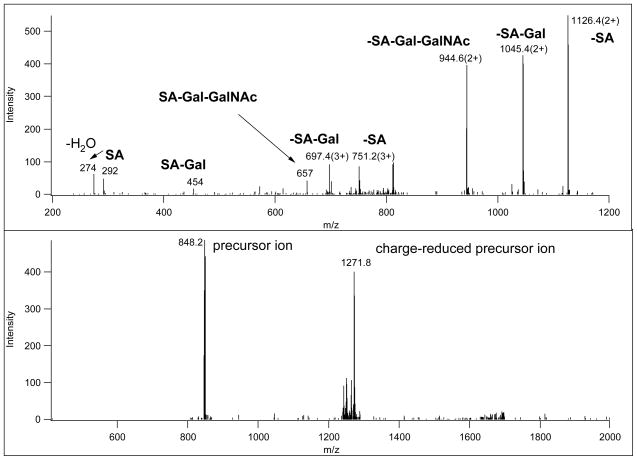
CID spectra from the linear ion trap mostly show fragments formed via glycosidic bond cleavages. When multiple sugar units are attached to a peptide, ion series (often at more than one charge state) are detected due to sequential carbohydrate losses. From the non-reducing end, oxonium ions and small neutral losses from these fragments are also detected (Figure 1, upper panel). Thus, from CID spectra the size and the number of sugar units can be determined, as well as the mass of the unmodified peptide. In certain instances, usually for lower charge state precursor ions (2+ especially), these spectra may also contain fragments formed through peptide backbone cleavages. The identity of the carbohydrate units cannot be determined solely from these data; but we are able to make assignments based on the specificity of the lectin and the exoglycosidases used for partial deglycosylation.
Figure 1.
CID and ETD spectra of a 3+ precursor ion at m/z 848.39 (MS spectrum is presented in Figure 4). The upper panel shows the CID spectrum acquired in the linear ion trap; the spectrum is dominated by fragments that consist of the intact glycopeptide minus sugar units, annotated “–SA” (the glycopeptide minus sialic acid), “-SA-Gal”, etc. There are also non-reducing end oxonium ions (“SA”, “SA-Gal”, etc.). The lower panel shows the ETD spectrum. This spectrum contains no useful information, probably because the low charge-density of the precursor ion prevented efficient ETD fragmentation.
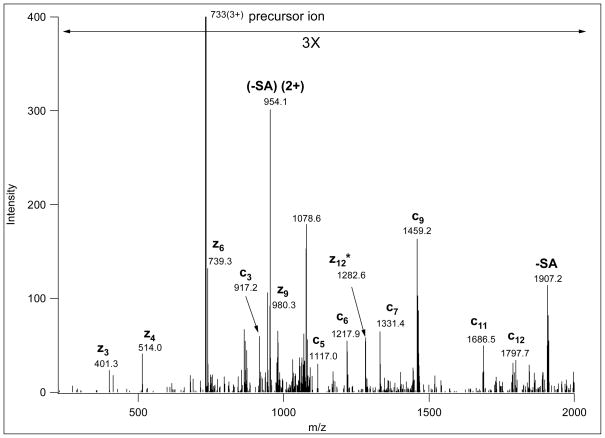
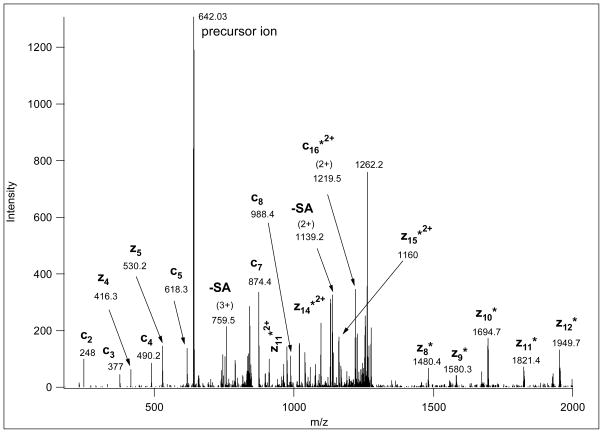
Electron-transfer triggers an entirely different fragmentation with cleavages almost exclusively along the peptide backbone. Good quality ETD spectra permit identification of the peptide sequence, glycan mass, and the unambiguous assignment of the modification site (Figures 2 and 3). Some carbohydrate fragmentation can also be detected in ETD spectra from charge-reduced species, most likely due to the supplemental activation11, 12. As illustrated in Figure 3 (MS spectrum in Figure 4), precursor ions representing metal-ion adducts may also produce excellent ETD spectra. Unfortunately, in order to obtain efficient ETD fragmentation precursor ions with a sufficient amount of charge-density are required. Precursor ions above m/z ~850 usually do not yield sufficient information regardless of their charge state12 (e.g. Figure 1, lower panel).
Figure 2.
ETD spectrum of m/z 733.0369(3+), corresponding to AAT(GalNAcGalSA)LSTLAGQPLLER. This spectrum provides sufficient information for confident sequence identification as well as site assignment. Sialic acid loss from charge-reduced versions of the precursor ion was also detected. Fragments labeled with asterisk indicate hydrogen transfer, i.e. z+1 ions.
Figure 3.
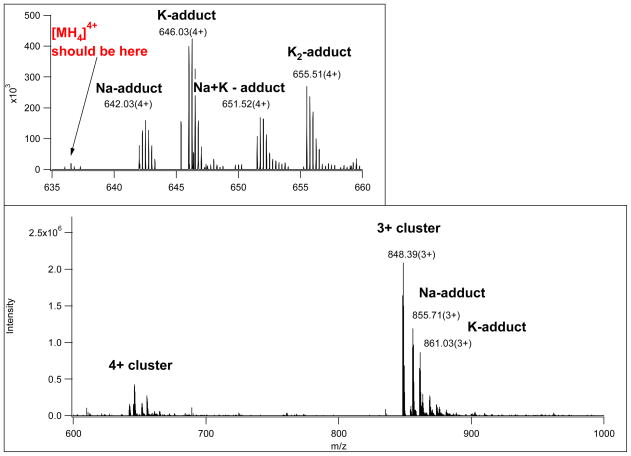
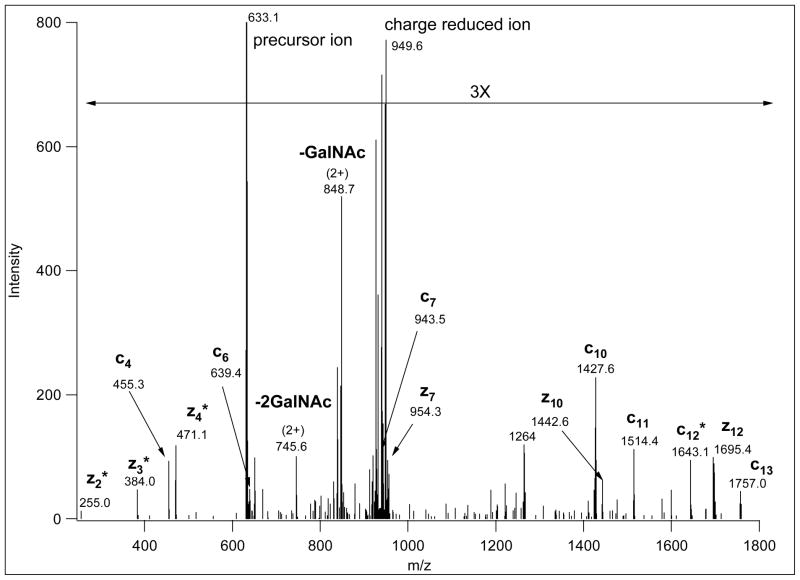
This ETD spectrum of m/z 642.03 (4+) was manually deciphered as representing the Na-adduct of TEELQQQNTAPT(GalNAcGalSA)NSPTK. CID and ETD data for the same glycopeptide from a protonated ion of a lower charge state are shown in Figure 1. Its MS spectrum is presented in Figure 4, where the upper panel clearly illustrates that at the higher charge state the solely protonated ion was practically non-existent. Asterisk-labeled fragments retained the Na-ion.
Figure 4.
MS survey scan showing the multiply charged precursor ion clusters for the glycopeptide presented in Figures 1 and 3. The MS scan also illustrates that the distribution of protonated ions and Na- and K-adducts can be significantly different at different charge states. Thus, sometimes only metal-ion adducts will be subjected to MS/MS analysis from a cluster.
Reducing the mass of the glycopeptide while retaining the charges should be advantageous for ETD analysis. This can be accomplished with sequential neuraminidase and β-galactosidase digestion, which will leave only the GalNAc units attached to the peptides. Indeed, Figure 5 shows that multiply modified glycopeptides can be successfully identified by ETD from the analysis of molecules displaying only the proximal GalNAc units. The exoglycosidase digestion, i.e. retaining only the core GalNAc units, also improves CID spectra by decreasing the number and intensity of neutral losses and increasing the number of peptide fragments (Figure 6).
Figure 5.
ETD data from precursor ion 632.6347 (3+), in the linear ion trap. A partially deglycosylated mixture was analyzed, and the ALRPSPT(GalNAc)S(GalNAc)PPSENH glycopeptide was identified from these data. Fragments labeled with asterisk indicate hydrogen transfer, i.e. c-1· and z+1 ions.
Figure 6.
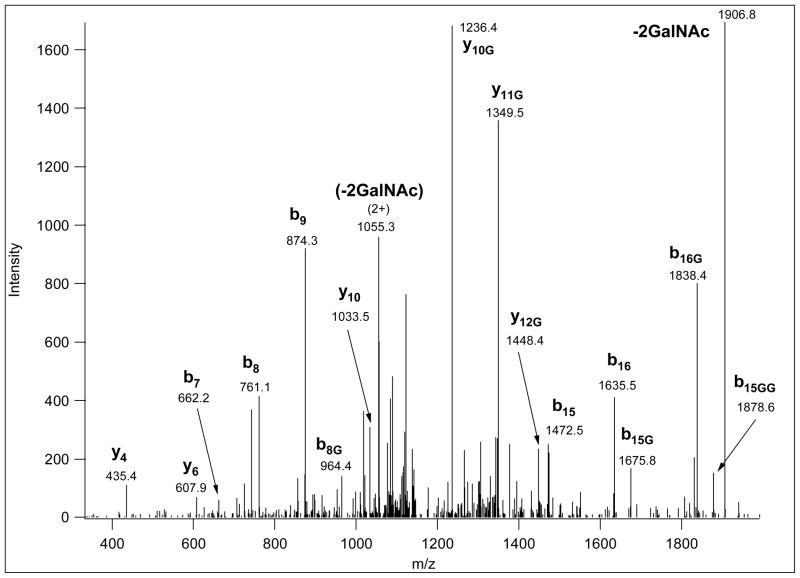
CID data of m/z 1157.0476, acquired in the linear ion trap from a partially deglycosylated mixture. Fragment ions labeled with G retained the sugar unit. The structure is DVSASTTVLPDDVT(GalNAc)AYPVG bearing an additional GalNAc unit on any of the 4 other hydroxy amino acids.
For identifying glycosylated peptides by database searching, information about the carbohydrate size and composition is necessary prior to the data interpretation. In the present study the lectin-specificity determined the carbohydrate structure. However, this information is also readily obtained from the corresponding CID spectrum, albeit not automatically yet. Equipped with this knowledge, glycopeptide ETD spectra could be identified and interpreted using Protein Prospector v5.3 (some features had been described8), that has been developed to handle ETD data. While other search engines also accommodate ETD fragmentation, Protein Prospector is unique in this aspect, as besides the canonical c and z· ETD fragments it also considers the formation of alternative c-1· and z+1 ions. We found that while the formation of such hydrogen-transfer fragments cannot be predicted with certainty, doubly charged precursor ions produce them in significantly higher yield than precursor ions of other charge states. In addition, a weighted ETD scoring is applied – ion types more frequently detected contribute more to the final score, while for example, b-ion fragments are searched for but do not alter the score significantly when detected. Protein Prospector v5.3 permits the merged display of CID and ETD search results. In such a report file one may retain a single spectrum with the best score for a unique sequence or the best data for each charge state. Table 1 shows such merged ETD and CID results for an Apolipoprotein E glycopeptide. While good ETD data usually require a precursor with a charge of +3 or more, doubly charged precursors tend to produce the highest quality CID data. Thus information gathered from ETD and CID data of the same glycopeptide in different charge states can often confirm a tenuous assignment.
Table 1.
Protein Prospector merged output of CID and ETD results. Since a 203.0-203.1 Da neutral loss was permitted, without defined elemental composition, the software calculates the mass difference between the precursor and the theoretical mass from the peptide sequence. The accurate mass increment for GalNAc (or any HexNAc) would be: 203.0794 Da.
| m/z | z | ppm | Peptide | MS2 | Score | Expect |
|---|---|---|---|---|---|---|
| 678.3465 | 3 | −2.4 | VQLALRPSPT(HexNAc)SPPSENH | ETD | 30.3 | 0.0020 |
| 1017.0150 | 2 | 0 | VQLALRPSPTSPPSENH+203.0722 | CID | 30.9 | 2.6e-5 |
| 678.3465 | 3 | 0 | VQLALRPSPTSPPSENH+203.0745 | CID | 23.9 | 0.16 |
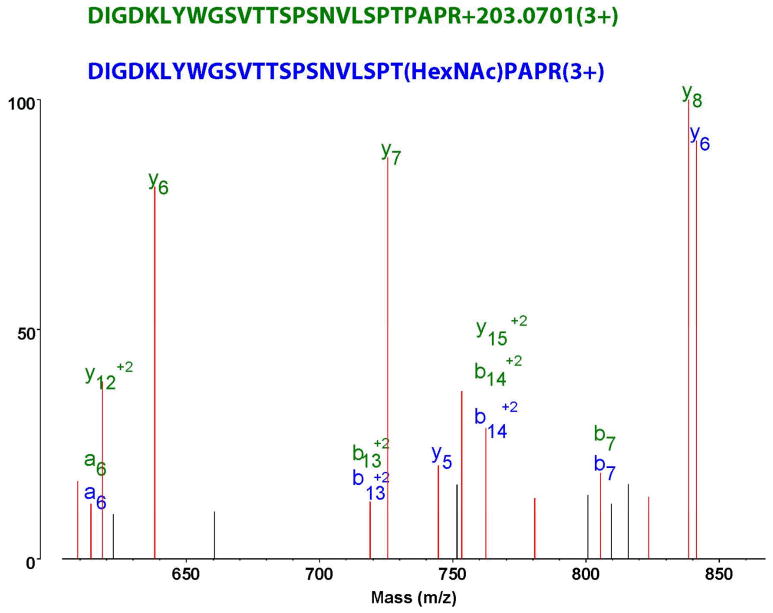
The exact site assignment of covalent modifications is a recurring issue in automated database searches. Software will provide an assignment even when insufficient information is available. Protein Prospector allows the user to move the assignment location of the modification so one can compare results with different site interpretations to test the validity of the assignments, although this analysis is manual and one spectrum at a time. This also allows annotation of peaks with and without modification attachment as shown in Figure 7. This Figure displays the annotation of ions with no sugar attached (i.e. where fragments underwent gas-phase deglycosylation) and with the correctly assigned modification site. This shows that there are a number of deglycosylated fragment ions in this spectrum, but also glycosylated fragments that allow modification site assignment.
Figure 7.
Fragment assignment of a glycopeptide CID using MS-Product from SearchCompare output of ProteinProspector. The green y fragment assignments indicate gas-phase deglycosylation, while the glycosylated y5 and y6 ions (in blue) show that there is sufficient information to pinpoint the modification site.
Summary
The ideal method for the mass spectrometric characterization of O-linked glycopeptides requires the combination of MS level information and complementary fragmentation techniques. The MS survey scans provide information about all available related precursor ions, i.e. different charge states of the same molecule and metal-adducts. CID spectra yield data about the presence, composition and potential size of the carbohydrate(s) as well as the mass of the unmodified peptide. ETD spectra yield information for peptide sequence identification and provide the most promising method for determining the modification site.
Protein Prospector is able to identify glycopeptides by database searching of ETD data if only a few carbohydrate structures are considered. It is also able to merge CID and ETD search results into a single output file. For glycopeptide data analysis, this combining of results from different fragmentation types is primarily of use when analyzing peptides bearing a single sugar modification, such as the glycosidase-treated samples presented in this work or single O-GlcNAc modified peptides8, as it is only for these simple sugar structures that CID is able to provide informative spectra about peptide sequence.
In addition, the software permits manual comparison of the potential site assignments and annotation of glycosylated and de-glycosylated fragment ions in the same spectrum, which is a particularly useful feature for CID spectra of O-linked glycopeptides, where both fragment types are generally present.
We believe that the combination of the complementary fragmentation options discussed in this manuscript, along with improved data analysis software should greatly facilitate O-linked glycopeptides analysis.
Acknowledgments
This work was supported by NIH grants NCRR RR001614, and RR019934 (to the UCSF Mass Spectrometry Facility, director: A.L. Burlingame) and a Hungarian Science Foundation Grant, OTKA T60283 (to KFM).
References
- 1.Varki A, Cummings RD, Esko JD, Freeze HH, Stanley P, Bertozzi CR, Hart GW, Etzler ME, editors. Essentials of Glycobiology. Cold Spring Harbor Laboratory Press; New York: 2009. [PubMed] [Google Scholar]
- 2.Hofsteenge J, Muller DR, de Beer T, Loffler A, Richter WJ, Vliegenthart JF. New type of linkage between a carbohydrate and a protein: C-glycosylation of a specific tryptophan residue in human Rnase. Biochemistry. 1994;33:13524. doi: 10.1021/bi00250a003. [DOI] [PubMed] [Google Scholar]
- 3.Peter-Katalinic J. O-glycosylation of proteins. Methods Enzymol. 2005;405:139. doi: 10.1016/S0076-6879(05)05007-X. [DOI] [PubMed] [Google Scholar]
- 4.Medzihradszky KF, Gillece-Castro BL, Settineri CA, Townsend RR, Masiarz FR, Burlingame AL. Structure Determination of O-Linked Glycopeptides by Tandem Mass-Spectrometry. Biomed Environ Mass Spectrom. 1990;19:777. doi: 10.1002/bms.1200191205. [DOI] [PubMed] [Google Scholar]
- 5.Medzihradszky KF, Gillece-Castro BL, Townsend RR, Burlingame AL, Hardy MR. Structural elucidation of O-linked glycopeptides by high energy collision-induced dissociation. J Am Soc Mass Spectrom. 1996;7:319. doi: 10.1016/1044-0305(95)00682-6. [DOI] [PubMed] [Google Scholar]
- 6.Chalkley RJ, Burlingame AL. Identification of GlcNAcylation sites of peptides and alpha-crystallin using Q-TOF mass spectrometry. J Am Soc Mass Spectrom. 2001;12:1106. doi: 10.1016/s1044-0305(01)00295-1. [DOI] [PubMed] [Google Scholar]
- 7.Perdivara I, Petrovich R, Alliquant B, Deterding LJ, Tomer KB, Przybylski M. Elucidation of O-Glycosylation Structures of the beta-Amyloid Precursor Protein by Liquid Chromatography-Mass Spectrometry Using Electron Transfer Dissociation and Collision Induced Dissociation. J Proteome Res. 2009;8:631. doi: 10.1021/pr800758g. [DOI] [PMC free article] [PubMed] [Google Scholar]
- 8.Chalkley RJ, Thalhammer A, Schoepfer R, Burlingame AL. Identification of protein O-GlcNAcylation sites using electron transfer dissociation mass spectrometry on native peptides. Proc Natl Acad Sci U S A. 2009;106:8894. doi: 10.1073/pnas.0900288106. [DOI] [PMC free article] [PubMed] [Google Scholar]
- 9.Hart GW, Housley MP, Slawson C. Cycling of O-linked beta-N-acetylglucosamine on nucleocytoplasmic proteins. Nature. 2007;446:1017. doi: 10.1038/nature05815. Review. [DOI] [PubMed] [Google Scholar]
- 10.Darula Zs, Medzihradszky KF. Affinity-enrichment and characterization of mucin core 1-type glycopeptides from bovine serum. Mol Cell Proteomics. doi: 10.1074/mcp.M900211-MCP200. in press. [DOI] [PMC free article] [PubMed] [Google Scholar]
- 11.Swaney DL, McAlister GC, Wirtala M, Schwartz JC, Syka JE, Coon JJ. Supplemental activation method for high-efficiency electron-transfer dissociation of doubly protonated peptide precursors. Anal Chem. 2007;79:477. doi: 10.1021/ac061457f. [DOI] [PMC free article] [PubMed] [Google Scholar]
- 12.Good DM, Wirtala M, McAlister GC, Coon JJ. Performance characteristics of electron transfer dissociation mass spectrometry. Mol Cell Proteomics. 2007;6:1942. doi: 10.1074/mcp.M700073-MCP200. [DOI] [PubMed] [Google Scholar]


