

1. Introduction
Although uncommon in early childhood, MDD reaches a point prevalence of 6–9% and lifetime prevalence of 33% in adolescents, (Lewinsohn et al., 1993; Schachar and Tannock, 1995). This disorder has a chronic course and is associated with severe psychosocial impairment (Lewinsohn et al., 1995; Birmaher et al., 1996). Numerous magnetic resonance imaging (MRI) studies show volumetric reductions in the frontal cortex and its subregions in adults with MDD ( Drevets et al., 1997; Rajkowska et al., 1999; Botteron et al., 2002; Bremner et al., 2002; Sheline, 2003). Post-mortem studies of adults with MDD show reductions in glial cell density of the DLPFC (Cotter et al., 2002; Uranova et al., 2004) and orbitofrontal regions (Drevets et al., 1997; Ongur et al., 1998; Rajkowska et al., 1999). Reviews of functional studies suggest hypo-functioning of the PFC (Seminowicz et al., 2004) in particular the DLPFC (Fitzgerald et al., 2006).
The few MRI studies done in children and adolescents with MDD, also suggest evidence of frontal lobe involvement. Decreased frontal volume and increased ventricular size was seen in depressed children compared to psychiatric controls (Steingard et al., 1996). In a later study, smaller whole brain volumes and smaller frontal white matter volumes were noted in depressed adolescents compared to controls (Steingard et al., 2002). After finding no differences in PFC volumes between untreated adolescents with MDD and healthy controls, Nolan et al. (2002) further subdivided their sample and found smaller left sided PFC gray matter volumes in patients with familial MDD compared to patients without a family history of MDD. Furthermore, subjects without a family history of MDD had larger left-sided total PFC volumes and PFC white matter volumes compared to patients with familial MDD and controls (Nolan et al., 2002). There was no significant difference in either total orbitofrontal cortex (OFC) volume or total gray matter OFC volume between twenty-seven mediation naïve children and adolescents with MDD patients compared to healthy controls (Chen et al., 2008).
In vivo proton (1H ) spectroscopy is a non-invasive and non-radioactive neuroimaging tool, which can measure the levels of major neurochemicals in vivo such as NAA, GPC + PC, myo-inositol (mI), PCr + Cr and glutamate (Glu) (Stanley et al., 2000; Stanley, 2002). These in vivo measurements provide insights into the neurochemical properties of selected brain regions. Of these neurochemicals, NAA is considered a marker of neuronal integrity, mitochondrial energy metabolism, and a developmental marker of dendritic and synaptic proliferation ( Tsai and Coyle, 1995; Pouwels and Frahm, 1998; Barker, 2001; Baslow, 2003). GPC + PC are breakdown products and precursors of membrane phospholipids, respectively (Stanley et al., 2000; Stanley, 2002) and PCr + Cr are high-energy phosphate metabolites related to the cellular energy metabolism via the creatine kinase high-energy phosphate reaction ( Hemmer and Wallimann, 1993;Kemp, 2000; Aubert and Costalat, 2002).
1H spectroscopy studies of adults with MDD provide mixed results. Within the frontal lobes, decreased NAA/PCr + Cr ratios were found bilaterally in depressed adults (Gruber et al., 2003) and in the left frontal lobe of elderly MDD patients with more deep white matter hyperintensities compared to MDD subjects with fewer white matter hyperintensities (Murata et al., 2001). Higher GPC + PC/PCr + Cr and myo-inositol/PCr + Cr ratios were reported in the dorsolateral white matter of elderly MDD patients (mean age 69.9 years) compared to healthy control subjects (Kumar et al., 2002). Decreased glutamate plus glutamine (Glu + Gln) and Glu alone was noted in the AC of depressed patients compared to controls (Auer et al., 2000). In two separate studies of depressed patients, reduced Glu levels in the DLPFC (Michael et al., 2003) and left cingulum (Pfleiderer et al., 2003) were seen pre-electro convulsive therapy (ECT) compared to healthy controls. These levels no longer differed from control subjects in patients who responded to ECT. Subjects whose depression was in remission did not differ from healthy subjects on any metabolite as measured using in vivo 1H spectroscopy in voxels placed in the ventromedial prefrontal cortex and dorsomedial/dorsal anterolateral prefrontal cortex (Hasler et al., 2005).
Most studies using in vivo 1H spectroscopy in children and adolescents with MDD have focused on the AC, noting reduced Glu (Mirza et al., 2004; Rosenberg et al., 2004; Rosenberg et al., 2005) and lower PCr + Cr (Mirza et al., 2004; Rosenberg et al., 2004) levels. Additional studies encompassing a variety of frontal cortex regions have found higher levels of GPC + PC in the OFC (Steingard et al., 2000), and elevated right prefrontal GPC + PC/PCr + Cr ratios in a gray matter voxel close to the anterior cingulate (Mac Master and Kusumakar, 2006). There are two studies of the DLPFC, with one noting increased GPC + PC in the left DLPFC of youth with MDD compared with healthy controls (Farchione et al., 2002) while Caetano et al. (2005) found significantly lower levels of GPC + PC and higher levels of myo-inositol in the left DLPFC of adolescents with MDD compared to healthy controls. In vivo 1H spectroscopy studies of the thalamus have found decreased Glu and NAA in the right medial thalamic area of MDD adolescent vs. controls (Mirza et al., 2006) and increased medial thalamic GPC + PC levels bilaterally in patients with Obsessive Compulsive Disorder compared with both healthy control subjects and patients with MDD (Smith et al., 2003). In the amygdala, MDD adolescents had decreased GPC + PC/PCr + Cr ratios in the left amygdala region compared with controls (Kusumakar et al., 2001).
We used a 2D, multi-voxel or chemical shift imaging (CSI) method to assess levels of NAA, GPC + PC, and PCr + Cr in frontal areas of children and adolescents with and without MDD. A multi-voxel technique has the advantage of obtaining multiple spectra simultaneously therefore evaluating multiple regions of interest during one measurement. Smaller voxels result in less contamination from neighboring tissues. Pitfalls with CSI however include potential smearing across voxels caused by smoothing, decreased signal-to-noise, and residual field inhomogeneities, all of which make processing more complex (Maudsley et al., 1983; Sauter et al., 1991; McRobbie et al., 2003). In contrast, single voxel techniques allow for precise localization using larger voxels which allow for more homogeneity, and easier water suppression. The downside to using a large single voxel, is the voxel may encompass multiple brain areas and tissue types and only one region can be assessed at a time therefore even basic comparison between hemispheres require multiple scans (Maudsley et al., 1983; Sauter et al., 1991; Duijn et al., 1992).
We sought to replicate our prior work (Caetano et al., 2005) finding lower levels of GPC + PC levels in the DLPFC of MDD subjects compared to healthy controls. Based on prior child studies we also expected decreased PCr + Cr in the anterior cingulate (Mirza et al., 2004; Rosenberg et al., 2004). The MPFC has not been examined in pediatric populations therefore our goal is exploratory at this point. For regions that had significant differences in neurochemicals, we explored the effects of clinical status including duration of illness, CDRS scores, medication status and positive family history of mood disorders on these levels. Given the unique nature of a multi-voxel technique, we used the occipital region as a control area where no differences between MDD and control subjects were expected.
2. Methods
2.1 Subjects
We recruited sixteen children and adolescents with MDD and thirty-eight healthy controls, between 8 and 17 years old, without serious medical problems, who were magnetic resonance compatible, from news advertisements and received referrals from local psychiatrists. MDD subjects were included if they met DSM-IV criteria for the disorder assessed with the Schedule for Affective Disorders and Schizophrenia for School-Age Children-Present and Lifetime version (K-SADS-PL) (Kaufman et al., 1997) administered separately to the children and their parent(s) or guardian(s). Final diagnoses were made via consensus of our diagnostic team after integrating the child and parent interview and all other available records. Exclusion criteria were a lifetime diagnosis for psychotic disorders, bipolar disorder, developmental disorders, substance abuse/dependence, eating disorders, tic disorders, or mental retardation. Exclusion criteria for healthy controls were a history of current psychiatric disorder, and a history of any Axis I psychiatric disorder in first-degree relatives. The severity of depression was rated using the Children’s Depression Rating Scale, revised (CDRS) (Poznanski and Mokros, 1996) and the Hamilton Depression Rating Scale (HAM-D) (Clark and Donovan, 1994). Puberty status was assessed through the Pubertal Development Scale – Petersen Scale (Petersen et al., 1988). Global Assessment of Functioning Scale (GAF) was recorded as part of the diagnostic interview. Family socioeconomic status (SES) was measured by the Hollingshead Four Factor Index of Social Status (Hollingshead, 1975). Laterality was assessed with the Oldfield scale (Oldfield, 1971). This study was approved by the Institutional Review Board of The University of Texas Health Science Center at San Antonio. Written informed consent was obtained from all subjects’ parents or legal guardians and written assent was obtained from each child and adolescent.
2.2 Multi-voxel 1H Spectroscopy
We acquired five T1-weighted scout images in order to achieve appropriate placement of the multi-voxel axial slice. In the sagittal plane, we selected the inferior slice adjacent to the superior border of the corpus callosum as this allowed us to examine portions of the MPFC, the dorsal AC and DLPFC. To exclude the sinus, the slice angle was carefully adjusted to be parallel with the anterior commissure-posterior commissure line (Figure 1). Acquisition parameters were as follows: repetition time/echo time = 1.5 s/272 ms; field of view = 24 cm; spectral bandwidth = 2,000 Hz; complex data points = 1024; CSI matrix size 16×16; nominal voxel size 1.5 × 1.5 cm; dimension of the region of interest localized by the point-resolved spectroscopy sequence (PRESS) sequence within the CSI = 119.14 ± 12.89 × 146.61±16.12 × 2 cm3, number of measurements = 2; and acquisition time = 16 min. To reduce lipid contamination from the anterior, posterior and lateral scalp, we positioned four outer volume saturation bands. In order to obtain absolute quantification, we also collected water unsuppressed data using 8 × 8 phase-encoding steps, which was zero-filled to 16×16 (Stanley et al., 1995).
Figure 1.
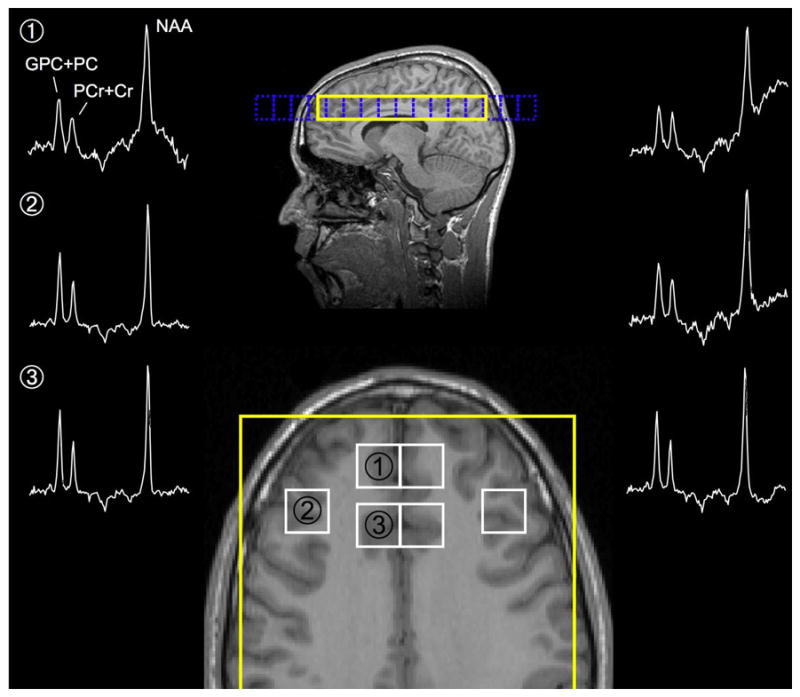
CSI Placement and Spectra
Locations: 1= Medial Prefrontal cortex, 2 = Dorsolateral Prefrontal Cortex, 3 = Anterior cingulate,
2.3 Post-acquisition data processing
We zero-filled the unsuppressed data to match the 16×16 matrix; and then performed a Fourier transformation before transferring the data to the workstation. Following the data acquisition, we used the Spec-Tool program, version 3.2 (Philips Medical Systems) that runs under the Philips Research Imaging Development Environment (PRIDE) in order to reposition the voxels in predefined (left and right) brain areas (Figure 1): the MPFC, the anterior cingulate and the DLPFC. This process was applied to the data related to water suppressed spectra, as well as to those related to water unsuppressed spectra. We used the PRIDE to extract the complex time-domain signal of the shifted voxels, which was then quantified as a separate spectrum. Prior to the spectral fitting, we removed any residual water or lipid signals using Hankel-Lanczos singular value decomposition (de Beer et al., 1992). We modeled the NAA, PCr + Cr and GPC + PC peaks in the time domain using Gaussian modulated sinusoidal functions and the nonlinear Levenberg-Marquardt algorithm (Marquardt, 1963).
The proportion of gray and white matter tissue, and CSF/extra-cortical space were estimated for each extracted 1H spectroscopy voxel. In a fully automated procedure, the T1-weighted images were co-registered to the axial scout images, corrected for any B1 field bias, the brain was extracted and the images segmented into partial volume maps of gray and white matter tissue, and CSF/extra-cortical space using FreeSurfer and FSL tools (Dale et al., 1999; Smith et al., 2004). The tissue fractions were then estimated by extracting from the segmented images the region of interest matching the coordinates and size of the 1H spectroscopy voxel using FSL tools.
We obtained the absolute metabolite levels (mmol/kg wet weight) using the gray and white matter tissue, and CSF voxel content values, and the quantified water peak from the data related to water unsuppressed spectra (Stanley et al., 1995). Because of the time limitation in scanning children, additional measurements were not conducted to estimate the T1 and T2 relaxation values of the metabolites in all of the participants. Therefore, the T1 and T2 relaxation values necessary for absolute quantification (Stanley et al., 1995) were assumed to be constant for all subjects and reflected values of adults (Kreis et al., 1993). Spectra were systematically rejected if the chemical shift was not within the ± 2 ppm window of the NAA, GPC + PC and PCr + Cr peaks (2.01 ppm, 3.02 ppm and 3.20 ppm, respectively); as was any spectral peak with a line width ≥ 50 Hz (18% of voxels were rejected).
2.4 Statistical Data Analysis
Statistical analyses were conducted using SPSS software version 14 (SPSS, Inc., Chicago, IL). Analysis of covariance with age and gender as covariates was performed. We adopted a two-tailed significance level of p < 0.05. We selected to examine the DLPFC, MPFC and AC without adjusting for multiple comparisons. Pearson’s correlation coefficients were used to examine linear association between chemical measures and age, and Spearman’s correlation coefficients were used for clinical variables that did not follow a normal distribution (duration of illness, CDRS).
3. Results
Our two groups did not differ in age, gender, pubertal status, years of education, handedness or socioeconomic status (Table 1). In the DLPFC, we did not see significant differences in GPC + PC metabolite levels with trends for lower NAA in the left DLPFC gray matter and right DLPFC white matter. In the right AC we saw significantly decreased NAA (F=4.76, df=1, 46, P=0.03) and GPC + PC (F=7.98, df=1, 46, P=0.007), with a trend for decreased PCr + Cr, in MDD subjects compared to healthy controls (see Table 2). Examination of the MPFC revealed significantly lower levels of NAA in the right MPFC (F=5.06, df=1, 46, P=0.03) and a trend for decreased GPC + PC in MDD subjects compared to healthy controls (see Table 2). As expected we found no metabolite differences in the occipital region. We examined the effects of medication status (medicated vs. unmedicated subjects) on metabolite levels in regions that were statistically significant and found no significant differences. Similarly correlations between clinical variables and metabolite levels in these areas did not reach statistical significance (see Table 3).
Table 1.
Demographic and Clinical Characteristics of subjects
| Pediatric MDD patients (N = 16) | Healthy controls (N = 38) | ||
|---|---|---|---|
| Age (years) (sd) | 13.19 (2.45) | 13.88 (2.66) | |
| Male Gender (%) | 11 (69%) | 19 (50%) | |
| Education (years) (sd) | 7.07 (2.79) | 7.89 (2.72) | |
| Petersen Puberty score (sd) | 6.75 (2.98) | 7.74 (2.91) | |
| Right Handed (%) | 15 (92%) | 35 (92%) | |
| Years of schooling | 7.07 (2.79) | 7.89 (2.72) | |
| Hollingshead SES | 46.58 (12.56) | 45.21 (14.60) | |
| Age of onset (years) (sd) | 10.31 (2.50) | - | |
| Duration of illness (months) (sd) | 28.50 (11.50) | - | |
| Number of episodes(sd) | 1.64 (1.64) | - | |
| Medicated (%) | 7 (44%) | - | |
| CDRS score(sd) | 42.56 (16.77) | - | |
| HAM-D | 11.50 (6.42) | - | |
| CGI Depression | 2.75 (1.48) | - | |
| CGI Mania | 1.25 (0.78) | - | |
| Family History of Mood disorder (%) | 15 (94%) | 0 | |
| First Degree relative with a Mood Disorder (%) | 15 (94%) | 0 | |
| Ethnicity | (%) | ||
| Hispanic | 6 (38%) | 26 (68%) | |
| Non-Hispanic White | 8 (50%) | 6 (16%) | |
| African American | 1 (6%) | 4 (10%) | |
| Other | 1 (6%) | 2 (5%) | |
Table 2.
Metabolite levels of Anterior Brain Regions
| MDD Subjects (N=16) | Healthy Controls (N=38) | ||||
|---|---|---|---|---|---|
| Region | Chemica l | mean±SD (mmol/kg) | mean±SD (mmol/kg) | F | p |
| Left DLPFC Gray Matter | NAA | 22.78± 4.20 | 25.85± 6.79 | 2.961 | 0.092 |
| GPC + PC | 3.94± 2.54 | 3.88± 1.30 | 0.016 | 0.899 | |
| PCr + Cr | 19.15± 5.87 | 20.28± 8.92 | 0.330 | 0.568 | |
| Right DLPFC Gray Matter | NAA | 27.08± 7.71 | 28.91± 7.76 | 0.645 | 0.426 |
| GPC + PC | 4.90± 2.64 | 3.98± 1.53 | 1.592 | 0.213 | |
| PCr + Cr | 18.89± 6.71 | 22.82± 7.89 | 2.709 | 0.106 | |
| Left DLPFC White Matter | NAA | 16.82± 5.71 | 18.28± 6.24 | 0.900 | 0.347 |
| GPC + PC | 3.02± 0.97 | 3.38± 1.08 | 2.308 | 0.135 | |
| PCr + Cr | 14.22± 5.35 | 15.48± 5.70 | 0.768 | 0.385 | |
| Right DLPFC White Matter | NAA | 16.81± 4.26 | 19.38± 6.08 | 2.967 | 0.091 |
| GPC + PC | 3.43± 1.42 | 3.71± 1.40 | 0.793 | 0.378 | |
| PCr + Cr | 13.53± 3.01 | 15.01± 5.76 | 1.205 | 0.278 | |
| Left Medial PFC | NAA | 21.22± 5.50 | 24.20 ± 7.75 | 1.576 | 0.216 |
| GPC + PC | 3.21 ± 0.99 | 4.01± 1.90 | 2.966 | 0.092 | |
| PCr + Cr | 20.00± 6.56 | 18.04± 7.85 | 1.145 | 0.290 | |
| Right Medial PFC | NAA | 17.46± 4.08 | 22.00± 7.59 | 5.056 | 0.029 |
| GPC + PC | 3.01± 0.91 | 3.72± 1.28 | 4.020 | 0.051 | |
| PCr + Cr | 17.20± 7.04 | 18.48± 7.22 | 0.284 | 0.596 | |
| Left Anterior Cingulate | NAA | 21.25± 6.56 | 21.72± 6.86 | 0.007 | 0.935 |
| GPC + PC | 4.04± 1.00 | 4.19± 1.24 | 0.290 | 0.593 | |
| PCr + Cr | 15.88± 4.71 | 16.88± 5.34 | 0.233 | 0.631 | |
| Right Anterior Cingulate | NAA | 17.71± 4.40 | 21.28± 6.37 | 4.768 | 0.034 |
| GPC + PC | 3.41± 0.66 | 4.22± 1.34 | 7.986 | 0.007 | |
| PCr + Cr | 13.40± 4.14 | 16.39± 7.05 | 3.065 | 0.086 | |
| Left Occipital Cortex | NAA | 24.92± 7.56 | 23.38± 9.43 | 0.1.88 | 0.667 |
| GPC + PC | 3.90± 2.78 | 3.44± 2.97 | 0.056 | 0.815 | |
| PCr + Cr | 18.90± 10.10 | 16.95± 8.53 | 0.429 | 0.516 | |
| Right Occipital Cortex | NAA | 20.02± 4.68 | 22.44± 6.97 | 1.426 | 0.239 |
| GPC + PC | 2.84± 1.71 | 3.20± 2.02 | 0.599 | 0.444 | |
| PCr + Cr | 20.72± 12.28 | 16.83± 8.62 | 1.130 | 0.294 | |
Table 3.
Correlation Between Clinical Variables and Metabolite Levels in selected regions for MDD Subjects
| NAA | GPC + PC | PCr + Cr | |
|---|---|---|---|
| Right Anterior Cingulate | |||
| Age | −0.06 | 0.03 | −0.33 |
| CDRS | 0.07 | −0.23 | 0.015 |
| CGI Mania | −0.26 | −0.36 | −0.14 |
| CGI Depression | −0.06 | −0.15 | 0.01 |
| HAM-D | 0.22 | −0.15 | 0.13 |
| Number of episodes | 0.05 | 0.04 | 0.02 |
| YMRS | −0.07 | −0.11 | −0.03 |
| Right Medial Prefrontal Cortex | |||
| Age | 0.36 | −0.05 | 0.48 |
| CDRS | −0.00 | −0.19 | −0.15 |
| CGI Mania | −0.08 | −0.00 | −0.29 |
| CGI Depression | −0.01 | −0.22 | −0.15 |
| HAM-D | −0.08 | −0.26 | −0.19 |
| Number of episodes | 0.39 | 0.22 | 0.03 |
| YMRS | −0.40 | −0.52 | −0.14 |
4. Discussion
This study found decreased levels of NAA in the right MPFC and decreased NAA and GPC + PC in the right dorsal AC of depressed adolescents compared to healthy controls. Although prior child MRS studies failed to find decreased NAA in PFC areas (Steingard et al., 2000; Mac Master and Kusumakar, 2006) ours is the first pediatric study to specifically examine the MPFC. Studies of the AC have mainly focused on Glu + Gln but did not report other metabolite concentrations (Rosenberg et al., 2004; Rosenberg et al., 2005). The exception is the AC study by Mirza et al (2004) who reported decreased Glu + GLn and PCR + Cr but no difference in NAA or GPC + PC in depressed children and adolescents. Of note decreased NAA/PCr + Cr ratios have been reported in the MPFC of adult (Gruber et al., 2003) and elderly subjects with depression (Murata et al., 2001).
We did not replicate our findings of lower GPC + PC levels in the left DLPFC of depressed patents (Caetano et al., 2005). Our failure to replicate our prior study is of interest as many of the same subjects were scanned using both the SVS and CSI method. The main diffference between these studies is the the CSI voxel is smaller which would effect both the placement and composition of the brain examined. These potential differences are evident in this sample as the MDD subjects’ GPC + PC levels in the left DLPFC gray matter are slightly higher compared to controls whereas in the DLPFC white matter the GPC + PC levels were slightly lower in MDD subjects (see Table 2). The same methodological differences could explain our novel AC findings as prior spectroscopy studies of the AC in depressed children and adolescents used a large central single voxel and averaged metabolite levels across hemispheres (Mirza et al., 2004; Rosenberg et al., 2004; Rosenberg et al., 2005).
4.1 The Frontal Cortex in Mood Regulation
Our main findings encompass differences in two PFC regions, namely the right MPFC and right AC. The prefrontal cortex is a complex region with multiple cortico-striato-thalamo-cortical connections (or loops) to the orbito-frontal cortex (that in turn connect to sensory visual, auditory, somatosensory, olfactory and gustatory inputs) and outputs to the viscero-motor system (thalamic, hypothalamic and brainstem) (Hamer et al., 1993; Phillips et al., 2008). Given this extensive network, it has been postulated that the MPFC and AC function in the monitoring and regulation of emotional states; with growing evidence to this effect based on converging evidence from neuroimaging and neuropathological studies (Drevets, 2007; Levesque et al., 2004; Yurgelun-Todd, 2007). Our voxel is placed in the dorsal AC which is a transitional area encompassing Brodmann areas 32 and 24c, 24b associated with both emotional and cognitive control (Bush et al.,2000). Our significant findings of decreased metabolites on the right MPFC and AC are of interest as fMRI studies have shown right sided prefrontal activation is associated with decreased cerebral blood flow in the amygdala (Hariri et al., 2000) and when trying to suppress the sad feelings in healthy subjects (Levesque et al., 2004; Beauregard et al., 2006). Decreased NAA in the MPFC and AC is suggestive of disrupted neuronal integrity in these regions. NAA is present in axons, dendrites and synaptic terminals, and changes in NAA levels in early development concomitant with dendritic arborization and the formation of synaptic connections suggest NAA is a marker of functioning neuroaxonal tissue (Barker, 2001; Baslow, 2003; Horska et al., 2002; Pouwels and Frahm, 1998; Tsai and Coyle, 1995). GPC + PC are breakdown products and precursors of membrane phospholipids, respectively (Stanley et al., 2000; Stanley,, 2002) therefore our finding of lower GPC + PC levels could be interpreted as evidence of diminished cell growth or myelination in MDD compared to healthy controls.
4.2 Limitations
Limitations of this study are different exposure to psychotropic medication and the presence of comorbid diagnoses. These circumstances however, are common to clinical populations of pediatric MDD. Our subjects also had moderate depressive symptoms, therefore, it is unclear if our findings were a result of their mood state or if these are underlying differences that predispose subjects to a mood disorder. One must also acknowledge that the use of a long TE time for data acquisition. This raises the possibility of a difference in T2 relaxation value between subjects groups driving the significant difference in metabolite levels between groups. Further limitations include a small sample size and failure to control for multiple comparisons, therefore our findings must be interpreted as preliminary. A meta-analyses of existing 1H spectroscopy studies(Yildiz-Yesiloglu and Ankerst, 2006) highights the inconsistent findings in MDD, however most of the studies used single voxel techniques. With the advances in field strength and signal-to-noise ratio, further studies with the CSI technique are warranted before final conclusions can be drawn.
Acknowledgments
This work was partly supported by K23-MH068280, MH 69774, RR 020571, Krus Endowed Chair in Psychiatry (UTHSCSA), UTHSCSA GCRC (M01-RR-01346), and Capes Foundation (Brazil).
Footnotes
Publisher's Disclaimer: This is a PDF file of an unedited manuscript that has been accepted for publication. As a service to our customers we are providing this early version of the manuscript. The manuscript will undergo copyediting, typesetting, and review of the resulting proof before it is published in its final citable form. Please note that during the production process errors may be discovered which could affect the content, and all legal disclaimers that apply to the journal pertain.
References
- Aubert A, Costalat R. A model of the coupling between brain electrical activity, metabolism, and hemodynamics: application to the interpretation of functional neuroimaging. Neuroimage. 2002;17:1162–1181. doi: 10.1006/nimg.2002.1224. [DOI] [PubMed] [Google Scholar]
- Auer D, Putz B, Kraft E, Lipinski B, Schill J, Holsboer F. Reduced glutamate in the anterior cingulate cortex in depression: an in vivo proton magnetic resonance spectroscopy study. Biological Psychiatry. 2000;47:305–313. doi: 10.1016/s0006-3223(99)00159-6. [DOI] [PubMed] [Google Scholar]
- Barker PB. N-acetyl aspartate--a neuronal marker? Ann Neurol. 2001;49:423–424. [PubMed] [Google Scholar]
- Baslow MH. N-acetylaspartate in the vertebrate brain: metabolism and function. Neurochem Res. 2003;28:941–953. doi: 10.1023/a:1023250721185. [DOI] [PubMed] [Google Scholar]
- Beauregard M, Paquette V, Levesque J. Dysfunction in the neural circuitry of emotional self-regulation in major depressive disorder. Neuroreport. 2006;17:843–846. doi: 10.1097/01.wnr.0000220132.32091.9f. [DOI] [PubMed] [Google Scholar]
- Birmaher B, Ryan N, Williamson DE, Brent D, Kaufman J, Dahl R, Perel J, Nelson B. Childhood and Adolescent Depression: A Review of the Past 10 Years. Part I. Journal of the American Academy of Child & Adolescent Psychiatry. 1996;35:1427–1439. doi: 10.1097/00004583-199611000-00011. [DOI] [PubMed] [Google Scholar]
- Botteron KN, Raichle ME, Drevets WC, Heath AC, Todd RD. Volumetric reduction in left subgenual prefrontal cortex in early onset depression. Biological Psychiatry. 2002;51:342–344. doi: 10.1016/s0006-3223(01)01280-x. [DOI] [PubMed] [Google Scholar]
- Bremner JD, Vythilingam M, Vermetten E, Nazeer A, Adil J, Khan S, Staib LH, Charney DS. Reduced volume of orbitofrontal cortex in major depression. Biological Psychiatry. 2002;51:273–279. doi: 10.1016/s0006-3223(01)01336-1. [DOI] [PubMed] [Google Scholar]
- Bush G, Luu P, Posner MI. Cognitive and emotional influences in anterior cingulate cortex. Trends in Cognitive Sciences. 2000;44:215–222. doi: 10.1016/s1364-6613(00)01483-2. [DOI] [PubMed] [Google Scholar]
- Caetano SC, Fonseca M, Olvera RL, Nicoletti M, Hatch J, Stanley J, Hunter K, Lafer B, Pliszka SR, Soares J. Proton spectroscopy study of the left dorsolateral prefrontal cortex in pediatric depressed patients. Neuroscience Letters. 2005;384:321–326. doi: 10.1016/j.neulet.2005.04.099. [DOI] [PubMed] [Google Scholar]
- Chen HH, Rosenberg DR, MacMaster FP, Easter PC, Caetano SC, Nicoletti M, Hatch JP, Nery FG, Soares JC. Orbitofrontal cortex volumes in medication naive children with major depressive disorder: a magnetic resonance imaging study. Journal of Child and Adolescent Psychopharmacology. 2008;18:551–556. doi: 10.1089/cap.2007.053. [DOI] [PMC free article] [PubMed] [Google Scholar]
- Clark DB, Donovan JE. Reliability and validity of the Hamilton Anxiety Rating Scale in an adolescent sample. Journal of the American Academy of Child and Adolescent Psychiatry. 1994;33:354–360. doi: 10.1097/00004583-199403000-00009. [DOI] [PubMed] [Google Scholar]
- Cotter D, Mackay D, Chana G, Beasley C, Landau S, Everall IP. Reduced neuronal size and glial cell density in area 9 of the dorsolateral prefrontal cortex in subjects with major depressive disorder. Cereb Cortex. 2002;12:386–394. doi: 10.1093/cercor/12.4.386. [DOI] [PubMed] [Google Scholar]
- Dale AM, Fischl B, Sereno MI. Cortical surface-based analysis. I. Segmentation and surface reconstruction. Neuroimage. 1999;9:179–194. doi: 10.1006/nimg.1998.0395. [DOI] [PubMed] [Google Scholar]
- de Beer R, van den BA, van Ormondt D, Pijnappel WW, den Hollander JA, Marien AJ, Luyten PR. Application of time-domain fitting in the quantification of in vivo 1H spectroscopic imaging data sets. NMR Biomed. 1992;5:171–178. doi: 10.1002/nbm.1940050403. [DOI] [PubMed] [Google Scholar]
- Drevets WC, Price JL, Simpson JR, Todd RD, Reich T, Vannier M, Raichle ME. Subgenual prefrontal cortex abnormalities in mood disorders. Nature. 1997;386:824–827. doi: 10.1038/386824a0. [DOI] [PubMed] [Google Scholar]
- Drevets WC. Orbitofrontal cortex function and structure in depression. Annals of the New York Academy of Sciences annals. 2007 doi: 10.1196/annals.1401.029. [DOI] [PubMed] [Google Scholar]
- Duijn JH, Matson GB, Maudsley AA, Weiner MW. 3D phase encoding 1H spectroscopic imaging of human brain. Magn Reson Imaging. 1992;10:315–319. doi: 10.1016/0730-725x(92)90490-q. [DOI] [PubMed] [Google Scholar]
- Farchione TR, Moore GJ, Rosenberg DR. Proton magnetic resonance spectroscopic imaging in pediatric major depression. Biological Psychiatry. 2002;52:86–92. doi: 10.1016/s0006-3223(02)01340-9. [DOI] [PubMed] [Google Scholar]
- Fitzgerald P, Oxley T, Laird A, Kulkarni J, Egan G, Daskalakis Z. An analysis of functional neuroimaging studies of dorsolateral prefrontal cortical activity in depression. Psychiatry Research: Neuroimaging. 2006;148:33–45. doi: 10.1016/j.pscychresns.2006.04.006. [DOI] [PubMed] [Google Scholar]
- Gruber S, Frey R, Mlynarik V, Stadlbauer A, Heiden A, Kasper S, Kemp GJ, Moser E. Quantification of metabolic differences in the frontal brain of depressive patients and controls obtained by 1H-MRS at 3 Tesla. Invest Radiol. 2003;38:403–408. doi: 10.1097/01.rli.0000073446.43445.20. [DOI] [PubMed] [Google Scholar]
- Hamer DH, Hu S, Magnuson VL, Hu N, Pattatucci AML. A linkage between DNA markers on the X chromosome and male sexual orientation. Science. 1993;261:321–327. doi: 10.1126/science.8332896. [DOI] [PubMed] [Google Scholar]
- Hariri AR, Bookheimer SY, Mazziotta JC. Modulating emotional responses: effects of a neocortical network on the limbic system. Neuroreport. 2000;11:43–48. doi: 10.1097/00001756-200001170-00009. [DOI] [PubMed] [Google Scholar]
- Hasler G, Neumeister A, van der Veen JW, Tumonis T, Bain EE, Shen J, Drevets WC, Charney DS. Normal Prefrontal Gamma-Aminobutyric Acid Levels in Remitted Depressed Subjects Determined by Proton Magnetic Resonance Spectroscopy. Biological Psychiatry. 2005;58:969–973. doi: 10.1016/j.biopsych.2005.05.017. [DOI] [PubMed] [Google Scholar]
- Hemmer W, Wallimann T. Functional aspects of creatine kinase in brain. Dev Neurosci. 1993;15:249–260. doi: 10.1159/000111342. [DOI] [PubMed] [Google Scholar]
- Hollingshead AB. Four Factor Index of Social Status 1975 [Google Scholar]
- Horska A, Kaufmann WE, Brant LJ, Naidu S, Harris JC, Barker PB. In vivo quantitative proton MRSI study of brain development from childhood to adolescence. J Magn Reson Imaging. 2002;15:137–143. doi: 10.1002/jmri.10057. [DOI] [PubMed] [Google Scholar]
- Kaufman J, Birmaher B, Brent D, Rao U, Flynn C, Moreci P, Williamson D, Ryan N. Schedule for Affective Disorders and Schizophrenia for School Age Children-Present and Lifetime version (K-SADS-PL): Initial reliability and validity data. Journal of the American Academy of Child and Adolescent Psychiatry. 1997;36:980–988. doi: 10.1097/00004583-199707000-00021. [DOI] [PubMed] [Google Scholar]
- Kemp GJ. Non-invasive methods for studying brain energy metabolism: what they show and what it means. Dev Neurosci. 2000;22:418–428. doi: 10.1159/000017471. [DOI] [PubMed] [Google Scholar]
- Kreis R, Ernst T, Ross BD. Absolute Quantitation of Water and Metabolites in the Human Brain. II. Metabolite Concentrations. Journal of Magnetic Resonance, Series B. 1993;102:9–19. [Google Scholar]
- Kumar A, Thomas A, Lavretsky H, Yue K, Huda A, Curran J, Venkatraman T, Estanol L, Mintz J, Mega M, Toga A. Frontal white matter biochemical abnormalities in late-life major depression detected with proton magnetic resonance spectroscopy. American Journal of Psychiatry. 2002;159:630–636. doi: 10.1176/appi.ajp.159.4.630. [DOI] [PubMed] [Google Scholar]
- Kusumakar V, MacMaster FP, Gates L, Sparkes SJ, Khan SC. Left medial temporal cytosolic choline in early onset depression. Can J Psychiatry. 2001;46:959–964. doi: 10.1177/070674370104601009. [DOI] [PubMed] [Google Scholar]
- Levesque J, Joanette Y, Mensour B, Beaudoin G, Leroux JM, Bourgouin P, Beauregard M. Neural basis of emotional self-regulation in childhood. Neuroscience. 2004;129:361–369. doi: 10.1016/j.neuroscience.2004.07.032. [DOI] [PubMed] [Google Scholar]
- Lewinsohn PM, Hops H, Roberts RE, Seeley JR, Andrews JA. Adolescent psychopathology: I. Prevalence and incidence of depression and other DSM-III-R disorders in high school students. J Abnorm Psychol. 1993;102:133–144. doi: 10.1037//0021-843x.102.1.133. [DOI] [PubMed] [Google Scholar]
- Lewinsohn PM, Klein DN, Seeley JR. Bipolar disorders in a community sample of older adolescents: prevalence, phenomenology, comorbidity, and course. Journal of the American Academy of Child and Adolescent Psychiatry. 1995;34:454–463. [PubMed] [Google Scholar]
- Mac Master FP, Kusumakar V. Choline in pediatric depression. McGill J Med. 2006;9:24–27. [PMC free article] [PubMed] [Google Scholar]
- Marquardt D. An algorithm for least-squares estimation of non-linear parameters. Society of Industrial and Applied Mathematics Journal. 1963;11:431–441. [Google Scholar]
- Maudsley AA, Hilal SK, Perman WH, Simon HE. Spatially resolved high resolution spectroscopy by “four-dimensional” NMR. J Magn Reson. 1983;51:147–152. [Google Scholar]
- McRobbie D, Moore E, Graves M, Prince M. MRI from Picture to Proton 2003 [Google Scholar]
- Michael N, Erfurth A, Ohrmann P, Arolt V, Heindel W, Pfleiderer B. Metabolic changes within the left dorsolateral prefrontal cortex occurring with electroconvulsive therapy in patients with treatment resistant unipolar depression. Psychol Med. 2003;33:1277–1284. doi: 10.1017/s0033291703007931. [DOI] [PubMed] [Google Scholar]
- Mirza Y, O’Neill J, Smith EA, Russell A, Smith JM, Banerjee SP, Bhandari R, Boyd C, Rose M, Ivey J, Renshaw PF, Rosenberg DR. Increased medial thalamic creatine-phosphocreatine found by proton magnetic resonance spectroscopy in children with obsessive-compulsive disorder versus major depression and healthy controls. J Child Neurol. 2006;21:106–111. doi: 10.1177/08830738060210020201. [DOI] [PubMed] [Google Scholar]
- Mirza Y, Tang J, Russell A, Banerjee SP, Bhandari R, Ivey J, Rose M, Moore GJ, Rosenberg DR. Reduced anterior cingulate cortex glutamatergic concentrations in childhood major depression. J Am Acad Child Adolesc Psychiatry. 2004;43:341–348. doi: 10.1097/00004583-200403000-00017. [DOI] [PubMed] [Google Scholar]
- Murata T, Kimura H, Omori M, Kado H, Kosaka H, Iidaka T, Itoh H, Wada Y. MRI white matter hyperintensities, (1)H-MR spectroscopy and cognitive function in geriatric depression: a comparison of early- and late-onset cases. Int J Geriatr Psychiatry. 2001;16:1129–1135. doi: 10.1002/gps.501. [DOI] [PubMed] [Google Scholar]
- Nolan CL, Moore GJ, Madden R, Farchione T, Bartoi M, Lorch E, Stewart CM, Rosenberg DR. Prefrontal cortical volume in childhood-onset major depression: preliminary findings. Archives of General Psychiatry. 2002;59:173–179. doi: 10.1001/archpsyc.59.2.173. [DOI] [PubMed] [Google Scholar]
- Oldfield RC. The assessment and analysis of handedness: the Edinburgh inventory. Neuropsychologia. 1971;9:97–113. doi: 10.1016/0028-3932(71)90067-4. [DOI] [PubMed] [Google Scholar]
- Ongur D, Drevets WC, Price JL. Glial reduction in the subgenual prefrontal cortex in mood disorders. Neurobiology. 1998;95:13290–13295. doi: 10.1073/pnas.95.22.13290. [DOI] [PMC free article] [PubMed] [Google Scholar]
- Petersen A, Crockett L, Richards M, Richards M, Boxer A. A self-report measure of pubertal status: Reliability, validity, and initial norms. Journal of Youth and Adolescence. 1988;17:117–133. doi: 10.1007/BF01537962. [DOI] [PubMed] [Google Scholar]
- Pfleiderer B, Michael N, Erfurth A, Ohrmann P, Hohmann U, Wolgast M, Fiebich M, Arolt V, Heindel W. Effective electroconvulsive therapy reverses glutamate/glutamine deficit in the left anterior cingulum of unipolar depressed patients. Psychiatry Research: Neuroimaging. 2003;122:185–192. doi: 10.1016/s0925-4927(03)00003-9. [DOI] [PubMed] [Google Scholar]
- Phillips ML, Ladouceur CD, Drevets WC. Neural systems underlying voluntary and automatic emotion regulation: toward a neural model of bipolar disorder. Molecular Psychiatry. 2008;13:829. doi: 10.1038/mp.2008.65. [DOI] [PMC free article] [PubMed] [Google Scholar]
- Pouwels PJ, Frahm J. Regional metabolite concentrations in human brain as determined by quantitative localized proton MRS. Magn Reson Med. 1998;39:53–60. doi: 10.1002/mrm.1910390110. [DOI] [PubMed] [Google Scholar]
- Poznanski EO, Mokros HB. Children’s Depression Rating Scale, Revised (CDRS-R) 1996 [Google Scholar]
- Rajkowska G, Miguel-Hidalgo JJ, Wei J, Dilley G, Pittman SD, Meltzer HY, Overholser JC, Roth BL, Stockmeier CA. Morphometric evidence for neuronal and glial prefrontal cell pathology in major depression. Biological Psychiatry. 1999;45:1085–1098. doi: 10.1016/s0006-3223(99)00041-4. [DOI] [PubMed] [Google Scholar]
- Rosenberg DR, MacMaster FP, Mirza Y, Smith JM, Easter PC, Banerjee SP, Bhandari R, Boyd C, Lynch M, Rose M, Ivey J, Villafuerte RA, Moore GJ, Renshaw P. Reduced anterior cingulate glutamate in pediatric major depression: a magnetic resonance spectroscopy study. Biological Psychiatry. 2005;58:700–704. doi: 10.1016/j.biopsych.2005.05.007. [DOI] [PubMed] [Google Scholar]
- Rosenberg DR, Mirza Y, Russell A, Tang J, Smith JM, Banerjee SP, Bhandari R, Rose M, Ivey J, Boyd C, Moore GJ. Reduced anterior cingulate glutamatergic concentrations in childhood OCD and major depression versus healthy controls. J Am Acad Child Adolesc Psychiatry. 2004;43:1146–1153. doi: 10.1097/01.chi.0000132812.44664.2d. [DOI] [PubMed] [Google Scholar]
- Sauter R, Schneider M, Wcklow K, Kolem H. Localized 1H MRS of the human brain: single-voxel versus CSI techniques. J Magn Reson Imaging. 1991;1:241. [Google Scholar]
- Schachar R, Tannock R. Test of four hypotheses for the comorbidity of attention deficit hyperactivity disorder and conduct disorder. Journal of the American Academy of Child and Adolescent Psychiatry. 1995;34:639–648. doi: 10.1097/00004583-199505000-00016. [DOI] [PubMed] [Google Scholar]
- Seminowicz DA, Mayberg HS, McIntosh AR, Goldapple K, Kennedy S, Segal Z, Rafi-Tari S. Limbic-frontal circuitry in major depression: a path modeling metanalysis. Neuroimage. 2004;22:409–418. doi: 10.1016/j.neuroimage.2004.01.015. [DOI] [PubMed] [Google Scholar]
- Sheline Y. Neuroimaging studies of mood disorder effects on the brain. Biological Psychiatry. 2003;54:338–352. doi: 10.1016/s0006-3223(03)00347-0. [DOI] [PubMed] [Google Scholar]
- Smith EA, Russell A, Lorch E, Banerjee SP, Rose M, Ivey J, Bhandari R, Moore GJ, Rosenberg DR. Increased medial thalamic choline found in pediatric patients with obsessive-compulsive disorder versus major depression or healthy control subjects: a magnetic resonance spectroscopy study. Biological Psychiatry. 2003;54:1399–1405. doi: 10.1016/s0006-3223(03)00474-8. [DOI] [PubMed] [Google Scholar]
- Smith S, Jenkinson M, Woolrich M, Beckmann C, Behrens T, Johansen-Berg H, Bannister P, De Luca M, Drobnjak I, Flitney D. Advances in functional and structural MR image analysis and implementation as FSL. Neuroimage. 2004;23:S208–S219. doi: 10.1016/j.neuroimage.2004.07.051. [DOI] [PubMed] [Google Scholar]
- Stanley JA. In vivo magnetic resonance spectroscopy and its application to neuropsychiatric disorders. Canadian Journal of Psychiatry. 2002;47:315–326. doi: 10.1177/070674370204700402. [DOI] [PubMed] [Google Scholar]
- Stanley JA, Drost DJ, Willaiamson PC, Thompson RT. The use of apriori knowledge to quantify short echo in vivo 1H NMR spectra. Magnetic Resonance In Medicine. 1995;34:17–24. doi: 10.1002/mrm.1910340105. [DOI] [PubMed] [Google Scholar]
- Stanley JA, Pettegrew JW, Keshavan MS. Magnetic resonance spectroscopy in schizophrenia: methodological issues and findings--part I. Biological Psychiatry. 2000;48:357–368. doi: 10.1016/s0006-3223(00)00949-5. [DOI] [PubMed] [Google Scholar]
- Steingard RJ, Renshaw PF, Hennen J, Lenox M, Cintron CB, Young AD, Connor DF, Au TH, Yurgelun-Todd DA. Smaller frontal lobe white matter volumes in depressed adolescents. Biological Psychiatry. 2002;52:413–417. doi: 10.1016/s0006-3223(02)01393-8. [DOI] [PubMed] [Google Scholar]
- Steingard RJ, Renshaw PF, Yurgelun-Todd DA, Appelmans KE, Lyoo IK, Shorrock KL, Bucci JP, Cesena M, Abebe D, Zurakowski D, Poussaint TY, Barnes P. Structural abnormalities in brain magnetic resonance images of depressed children. Journal of the American Academy of Child and Adolescent Psychiatry. 1996;35:307–311. doi: 10.1097/00004583-199603000-00011. [DOI] [PubMed] [Google Scholar]
- Steingard RJ, Yurgelun-Todd DA, Hennen J, Moore JC, Moore CM, Vakili K, Young AD, Katic A, Beardslee WR, Renshaw PF. Increased orbitofrontal cortex levels of choline in depressed adolescents as detected by in vivo proton magnetic resonance spectroscopy. Biological Psychiatry. 2000;48:1053–1061. doi: 10.1016/s0006-3223(00)00942-2. [DOI] [PubMed] [Google Scholar]
- Tsai G, Coyle JT. N-acetylaspartate in neuropsychiatric disorders. Progress in Neurobiology. 1995;46:531–540. doi: 10.1016/0301-0082(95)00014-m. [DOI] [PubMed] [Google Scholar]
- Uranova NA, Vostrikov VM, Orlovskaya DD, Rachmanova VI. Oligodendroglial density in the prefrontal cortex in schizophrenia and mood disorders: a study from the Stanley Neuropathology Consortium. Schizophrenia Research. 2004;67:269–275. doi: 10.1016/S0920-9964(03)00181-6. [DOI] [PubMed] [Google Scholar]
- Yildiz-Yesiloglu A, Ankerst DP. Review of 1H magnetic resonance spectroscopy findings in major depressive disorder: a meta-analysis. Psychiatry Research. 2006;147:1–25. doi: 10.1016/j.pscychresns.2005.12.004. [DOI] [PubMed] [Google Scholar]
- Yurgelun-Todd D. Emotional and cognitive changes during adolescence. Current Opinion in Neurobiology. 2007;17:251–257. doi: 10.1016/j.conb.2007.03.009. [DOI] [PubMed] [Google Scholar]