

Abstract
Purpose
Higher body-mass index (BMI) has been implicated as a risk factor for developing pancreatic cancer, but its effect on survival has not been thoroughly investigated. We assessed the association of BMI with survival in a sample of pancreatic cancer patients and utilized epidemiologic and clinical information to understand the contribution of diabetes and hyperglycemia.
Methods
A survival analysis using Cox proportional hazards by usual adult BMI was performed on 1,861 unselected patients with pancreatic adenocarcinoma; analyses were adjusted for covariates that included clinical stage, age, and sex. Secondary analyses incorporated self reported diabetes and fasting blood glucose in the survival model.
Results
BMI as a continuous variable was inversely associated with survival from pancreatic adenocarcinoma [hazard ratio 1.019 for each increased unit of BMI (kg/m2), p < 0.001] after adjustment for age, stage, and sex. In analysis by National Institutes of Health BMI category, BMI of 30–34.99 kg/m2 (HR 1.14, 95% confidence interval 0.98–1.33), 35–39.99 kg/m2 (HR 1.32, 95% CI 1.08–1.62), and ≥40 (HR 1.60, 95% CI 1.26–2.04) were associated with decreased survival compared to normal BMI of 18,5–24.99 kg/m2 (overall trend test p<0.001). Fasting blood glucose and diabetes did not affect the results.
Conclusions
Higher BMI is associated with decreased survival in pancreatic cancer. Although the mechanism of this association remains undetermined, diabetes and hyperglycemia do not appear to account for the observed association.
Introduction
High body mass index (BMI) has been consistently reported as a risk factor for pancreatic cancer1–7. Though the mechanism for this increased risk is not yet established, hyperinsulinemia and insulin resistance have been hypothesized.1, 6 In one study using lean and obese mice inoculated with murine pancreatic cancer cells, higher serum insulin and lower adiponectin in obese mice correlated with increased tumor cell proliferation, but there was no change in apoptosis indices.8 The same group has also reported that steatosis in human pancreas at the time of surgical tumor resection correlated with increased likelihood of lymph node metastasis, and hypothesized that steatosis affects the tumor microenvironment.9
Obesity has been reported to be associated with poorer prognosis in multiple cancers10, 11, perhaps most notably breast cancer12–15 In breast cancer, it is possible that increased peripheral estrogens related to obesity may contribute to risk of recurrent disease, although this mechanism remains indeterminate. In pancreatic cancer, increased BMI has been reported to be an adverse prognostic factor for survival after surgery in two surgical series of 285 and 356 patients, respectively.16, 17 However, another surgical report of 306 patients undergoing resection of pancreatic adenocarcinoma reported increased postoperative complications in obese patients, but the slight decrease in survival did not reach statistical significance.18
An epidemiologic study19 has reported an association of risk of pancreatic cancer with increased BMI at various time points throughout life, and further observed decreased survival from pancreatic cancer, with the strongest effect among resected patients. It should be noted that this sample was drawn from the same institution where one of the above mentioned surgical series was reported. Another hospital-based study has also shown a decreased survival among obese patients compared to normal weight among 475 patients with pancreatic cancer, although statistical significance was not reached (HR=1.62, 95% CI 0.76–3.44).20
We more fully examined the effect of BMI on pancreatic cancer survival utilizing the Mayo Clinic Pancreas Biospecimen Resource, a prospective patient series that employs ultra rapid recruitment methods.
Methods
The study was reviewed and approved by the Mayo Clinic Institutional Review Board, and written, informed consent was obtained on all subjects.
Patient recruitment
Pancreatic cancer patients were rapidly and systematically identified and approached, using methodology reported previously21 at Mayo Clinic Rochester, Mayo Clinic Arizona, or Mayo Clinic Florida between October 1, 2000 and Jan. 1, 2009. Of 2,746 adenocarcinoma patients identified during this time period, 1,898 consented to participate (69.1%). 1.9% were excluded for missing height, weight, or stage of pancreatic cancer, leaving 1,861 patients suitable for analysis. Only histologically (95%) or clinically (5%) confirmed adenocarcinoma cases providing consent were included in survival analyses. Clinically confirmed cases required a pancreatic mass on imaging consistent with adenocarcinoma, and symptoms typical of pancreatic adenocarcinoma (weight loss, abdominal pain, painless jaundice). All cases were reviewed by subspecialist physicians with expertise in pancreatic cancer (oncologist or surgeon) for coding as adenocarcinoma. At the time of enrollment, participants were asked to complete risk factor questionnaires including personal medical history, behaviors, family history, and usual adult height and weight (which were used for calculating BMI), and data from which Karnofsky performance score22 was determined. Fasting blood glucose was obtained from the electronic medical record for all subjects at study entry. When risk factor questionnaire information was not completed (N=629), the medical record was abstracted to ascertain weight at study entry, usual adult weight, recent weight loss, ever/never smoking status, BMI, prior diagnosis of diabetes, and family history of pancreatic cancer. We have previously reported an intermethod reliability study in which usual adult height and weight from 25 cases and 25 healthy controls was obtained from both questionnaires and abstracted from the medical record. Since usual adult weight was not usually available, weight at study entry plus reported recent weight loss was used. A high degree of intermethod reliability was noted (Pearson correlation coefficient > 0.93).23 Staging was recorded according to AJCC 6th e0taging criteria by a physician with expertise in gastrointestinal cancer. Patients were then grouped into surgically resected, locally advanced, and metastatic disease for survival analysis. Surgical patients were also subcategorized into stages IA, IB, IIA, and IIB. Vital status of subjects was collected by multiple sources as part of routine research followup, including periodic mailings, medical records, Tumor Registry, and death indexes from online services.
Statistical methods
Age was used as a continuous variable and defined as age in years at diagnosis of pancreatic cancer. Risk factor questionnaires provided self-report of diabetes (Y/N), cigarette smoking was recorded as ever/never, and also by typical packs-per-day for smoking intensity. BMI was calculated from self-reported usual adult height and weight. Weight loss was recorded as usual adult weight minus weight at study entry. Date of diagnosis was defined as date of tissue diagnosis for those with pathology-proven disease. For those who were clinically diagnosed, date of the first clinical diagnosis was used. Date of death or last known date alive was selected from the most current data among multiple sources as described in Methods. For the primary analysis, BMI was considered as a continuous variable. Secondary analyses also examined BMI categorized according to NIH guidelines of underweight (<18.5 kg/m2), normal weight (referent group, 18.5–24.99 kg.m2), overweight (25.0–29.99 kg/m2), obese class I (30.0–34.99 kg/m2) obese class II (35.0–39.99 kg/m2), and obese class III (≥40.0 kg/m2).24 In addition to age and sex, covariates showing associations (p < 0.05) in univariable analysis were considered for multivariable analysis.
Cox proportional hazards regression analyses were used to conduct comparisons for survival. Time to event was diagnosis of pancreatic cancer until death or last followup with individuals still alive at last followup being coded as censored for the event (death) as of that date. All analyses used SAS software, version 9.1.3.
Results
Median follow up for cases was 306 days. By the time of analysis, 1,527 patients (82.1%) were deceased. Table 1 shows the characteristics of patients included in the analysis. Patients who completed questionnaires were more likely to be female, older, earlier stage, not diabetic, and had longer survival, lower BMI, and more reported weight loss at study entry.
Table 1.
Characteristics of Pancreatic Adenocarcinoma Patients, Including Completion of Risk Factor Questionnaire
| Not completed (N=629) | Completed (N=1,232) | Total (N=1,861) | p* | |
|---|---|---|---|---|
| Sex | 0.029 | |||
| Male | 375 (59.6%) | 669 (54.3%) | 1,044 (56.1%) | |
| Age at time of pancreatic cancer diagnosis | 0.002 | |||
| N | 629 | 1,232 | 1,861 | |
| Median | 64.0 | 67.0 | 66.0 | |
| Q1, Q3 | 56.0, 73.0 | 59.0, 74.0 | 58.0, 74.0 | |
| Vital Status | 0.164 | |||
| Alive | 102 (16.2%) | 232 (18.8%) | 334 (17.9%) | |
| Dead | 527 (83.8%) | 1,000 (81.2%) | 1,527 (82.1%) | |
| Site of Tumor | 0.943 | |||
| Head | 341 (54.6%) | 700 (57.2%) | 1,041 (56.3%) | |
| Body | 87 (13.9%) | 165 (13.5%) | 252 (13.6%) | |
| Tail | 66 (10.6%) | 116 (9.5%) | 182 (9.8%) | |
| Head & Body | 43 (6.9%) | 80 (6.5%) | 123 (6.7%) | |
| Body & Tail | 37 (5.9%) | 79 (6.5%) | 116 (6.3%) | |
| NOS | 8 (1.3%) | 16 (1.3%) | 24 (1.3%) | |
| Uncinate Process | 28 (4.5%) | 45 (3.7%) | 73 (4%) | |
| Stage Group | <0.001 | |||
| Resectable | ||||
| IA | 12 (1.9%) | 17 (1.4%) | 29 (1.6%) | |
| IB | 12 (1.9%) | 55 (4.5%) | 67 (3.6%) | |
| IIA | 28 (4.5%) | 111 (9%) | 139 (7.5%) | |
| IIB | 93 (14.8%) | 232 (18.8%) | 325 (17.5%) | |
| Locally Advanced | 246 (39.1%) | 405 (32.9%) | 651 (35%) | |
| Metastatic | 238 (37.8%) | 412 (33.4%) | 650 (34.9%) | |
| Days Survival from Diagnosis | <0.001 | |||
| N | 629 | 1,232 | 1,861 | |
| Mean (SD) | 334.4 (384.51) | 511.9 (578.95) | 451.9 (528.02) | |
| Median | 231.0 | 338.0 | 306.0 | |
| Q1, Q3 | 107.0, 426.0 | 198.5, 569.5 | 166.0, 523.0 | |
| Range | (0.0–3,797.0) | (1.0–5,899.0) | (0.0–5,899.0) | |
| Diabetes (self-reported or reported in medical record) | 0.036 | |||
| Missing | 251 | 81 | 332 | |
| No | 245 (64.8%) | 812 (70.5%) | 1,057 (69.1%) | |
| Yes | 133 (35.2%) | 339 (29.5%) | 472 (30.9%) | |
| Continuous BMI (usual adult, kg/m2) | <0.001 | |||
| N | 629 | 1,232 | 1,861 | |
| Mean (SD) | 29.4 (6.58) | 28.1 (5.37) | 28.5 (5.83) | |
| Median | 28.2 | 27.4 | 27.6 | |
| Q1, Q3 | 24.6, 32.6 | 24.4, 30.7 | 24.4, 31.2 | |
| Range | (16.4–59.0) | (15.3–53.4) | (15.3–59.0) | |
| BMI by category(usual adult, kg/m2) | <0.001 | |||
| < 18.5 | 6 (1%) | 7 (0.6%) | 13 (0.7%) | |
| 18.5–24.99 (ref) | 166 (26.4%) | 368 (29.9%) | 534 (28.7%) | |
| 25.0–29.99 | 228 (36.2%) | 493 (40%) | 721 (38.7%) | |
| 30.0–34.99 | 123 (19.6%) | 238 (19.3%) | 361 (19.4%) | |
| 35.0–39.99 | 58 (9.2%) | 80 (6.5%) | 138 (7.4%) | |
| ≥ 40.0 | 48 (7.6%) | 46 (3.7%) | 94 (5.1%) | |
| Weight Loss (as a % of usual adult weight) | <0.001 | |||
| None | 145 (23.1%) | 211 (17.1%) | 356 (19.1%) | |
| >0, ≤10 % | 255 (40.5%) | 382 (31%) | 637 (34.2%) | |
| >10% | 229 (36.4%) | 639 (51.9%) | 868 (46.6%) | |
| Categorical FBG (mg/dL) | 0.110 | |||
| Missing | 159 (%) | 259 (%) | 418 | |
| <100 | 82 (17.4%) | 133 (13.7%) | 215 (14.9%) | |
| 100–125 | 177 (37.7%) | 349 (35.9%) | 526 (36.5%) | |
| 126–150 | 85 (18.1%) | 195 (20%) | 280 (19.4%) | |
| 151–200 | 75 (16%) | 199 (20.5%) | 274 (19%) | |
| >200 | 51 (10.9%) | 97 (10%) | 148 (10.3%) | |
| Performance Score (Karnofsky) | ||||
| 90–100 | -- | 252 (26.8%) | 252 (26.8%) | -- |
| 80 | -- | 315 (33.7%) | 315 (33.7%) | |
| 70 | -- | 257 (27.5%) | 257 (27.5%) | |
| 60 | -- | 83 (8.9%) | 83 (8.9%) | |
| <50 | -- | 28 (3.0%) | 28 (3.0%) | |
BMI = Body Mass Index, FBG = Fasting blood glucose,
comparison of subjects who did and did not complete risk factor questionnaires
Kaplan-Meier survival comparisons (Figure 1) showed an association of BMI with survival (chi square p=0.011). Median survival for each BMI category (kg/m2) was as follows: (0–18.49) 276 days, (18.5–24.99) 349 days, (25.0–29.99) 352 days, (30.0–34.99) 310 days, (35.0–39.99) 273 days, and (≥40.0) 246 days.
Figure 1.
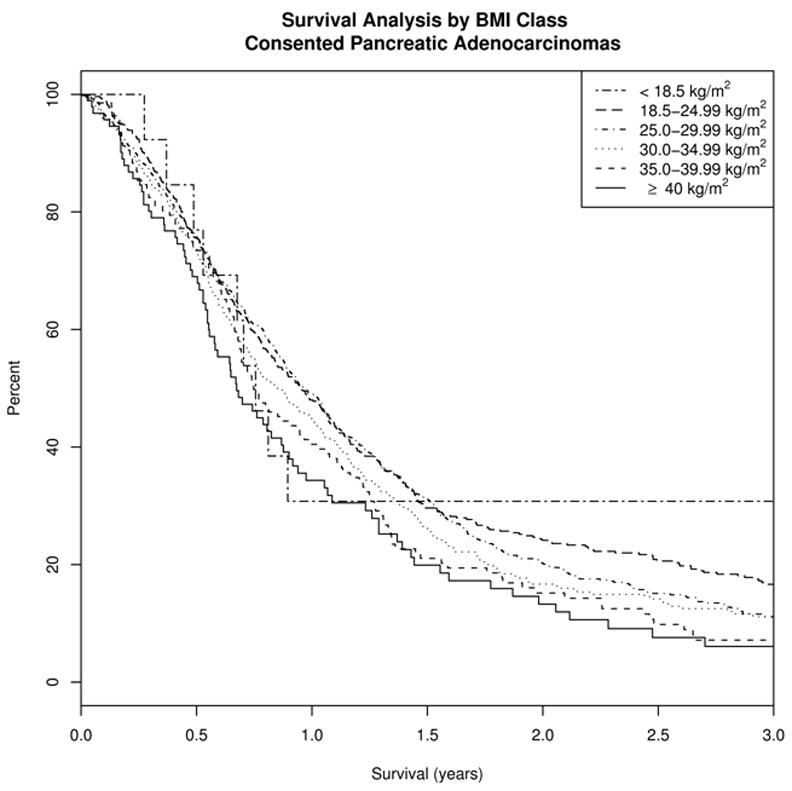
Unadjusted Kaplan-Meier analysis of survival among 1,861 pancreatic cancer patients by usual adult BMI category.
In multivariable survival analyses, increasing age (HR 1.017 per year, 95% confidence interval 1.012–1.022) and locally advanced (HR 2.99, 95% C.I. 2.60–3.43) or metastatic disease (HR 4.76, 95% CI 4.14–5.46) versus resectable disease were associated with decreased survival; ever/never smoking, tumor location (head vs body/tail), and family history of pancreatic cancer showed no association with survival in stepwise analysis and were not included in the final multivariable model. BMI was inversely associated with survival as a continuous variable in adjusted analysis (HR 1.019, p <0.001).
Analysis by usual adult BMI NIH category was also significantly associated with survival (p-trend <0.001), with a clear dose-dependent association with survival (first panel, Figure 2A). Adjusted hazard ratios for NIH BMI categories compared to the referent group of normal weight were underweight (HR 1.30, 95% CI 0.69–2.45), overweight (HR1.02, 95% CI 0.89–1.16), obese class I (HR 1.14, 95% CI 0.98–1.33), obese class II (1.32, 95% CI 1.08–1.62), and obese class III 1.60, 95% CI 1.26–2.04). Although the hazard ratio was increased for underweight persons, the sample size was small (N=13). For BMI above the normal range, there is a clear, steady decrease in survival with increasing BMI. A sensitivity analysis was performed including only biopsy-proven adenocarcinoma cases, and this did not alter the significance of the associations, with only minimal changes in HRs.
Figure 2.

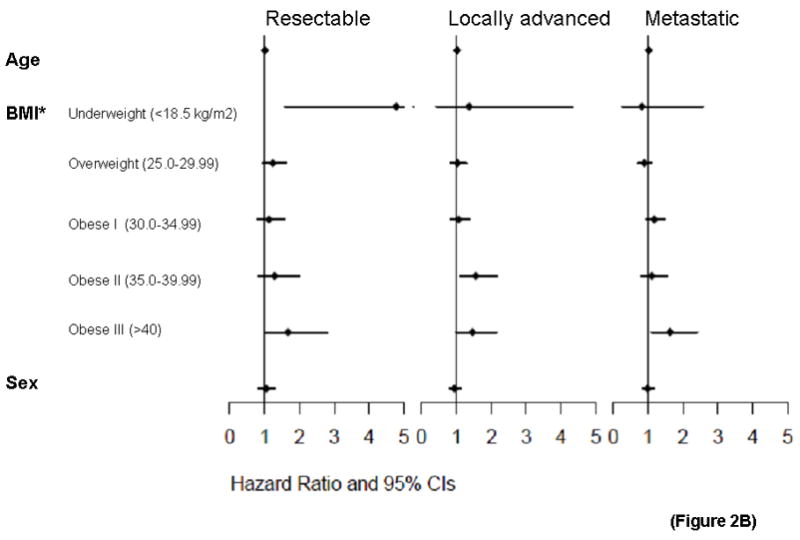
Figure 2A. BMI and survival of pancreatic cancer patients by completion of risk factor questionnaire. Forest plots of multivariable Cox regression survival associations by NIH BMI category for pancreatic cancer patients overall and risk factor questionnaire completion. *Referent group for BMI is 18.5–24.99 kg/m2. **Referent group for stage is resectable.
Figure 2B. BMI and survival of pancreatic cancer patients by stage. Forest plots within stage groupings for resectable, locally advanced, and metastatic patients at initial diagnosis of pancreatic cancer.
The dose-dependent association of usual adult BMI and survival was seen in patient groups who either completed or did not complete the questionnaire (Figure 2A, second and third panels). For those who completed questionnaires, adjusted analysis was also performed using self-reported Karnofsky performance score as a covariate. Performance score was significantly associated with survival (p<10−5), while the overall association for BMI remained (HR 1.014, p=0.023). Among stage subgroups, BMI was significantly associated with survival in patients presenting with locally advanced (HR 1.021, p=0.005) and metastatic (HR 1.018, p=0.011) disease, but not resected patients (HR 1.012, p=0.227), though the dose-dependent pattern appeared consistent for all 3 stage groupings (Figure 2B).
Since weight loss is a prominent feature in clinical presentation of pancreatic cancer, we evaluated its effects on survival. In multivariate analysis, weight loss as a percentage of body weight was also associated with decreased survival (HR 2.03, p =0.015). In weight loss categories (None, >0 and ≤10%, or >10%), there was a significant association (p=0.009) with decreased survival seen with higher weight loss, adjusted for age, stage, and sex.
To further investigate whether a hyperglycemic state accounted for our findings, fasting blood glucose (FBG) at the time of study recruitment was examined on 1,443 cases for whom it was available. When added to the overall model, a modest association of FBG and survival was seen (HR 1.01), though this did not reach statistical significance (p=0.096). Since many diabetic patients were likely already on medication to lower FBG, we also examined the subset of patients who self-reported no history of diabetes (N=833). There was no association of FBG and survival in this group (HR 1.00, p=0.419). Self-reported diabetes at time of study entry was also not associated with survival (HR 1.07, p=0.273). None of these additions to the model changed the association of BMI and survival (Figure 3).
Figure 3.
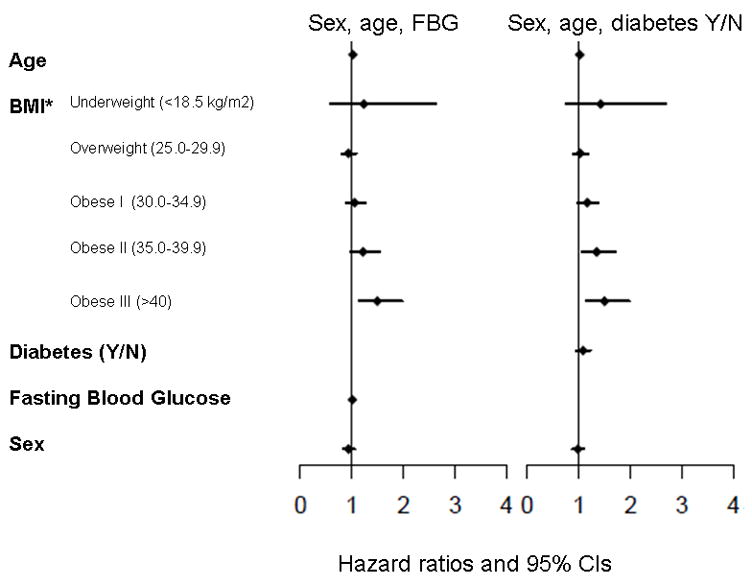
Incorporation of fasting blood glucose and self reported diabetes to models of pancreatic cancer survival with BMI, adjusted for stage. Forest plots of multivariable Cox regression survival associations with fasting blood glucose (FBG) or self-reported diabetes included as covariables. *Referent group for BMI is 18.5–24.99 kg/m2.
Discussion
In a clinic-based survival study, we observed that increasing BMI was strongly and consistently associated with a decreased survival from pancreatic cancer. The mechanism for this finding is not clearly evident, although circulating hyperinsulinemia has been hypothesized as one potential etiology.19 For this reason, we examined both self-reported diabetes and fasting blood glucose levels of patients at presentation to our center. However, diabetes and hyperinsulinemia did not appear to explain the effect of BMI on survival, leaving the explanation for this finding currently unknown. This is in distinction to a recent letter stating diabetes was associated with worsened survival in the Li et al paper.25
Higher BMI is well known to be associated with altered circulating levels of estrogens 26, 27 and insulin28. However, since the survival of women does not substantially differ from that of men in pancreatic cancer, it is difficult to conclude that estrogens contribute to poor survival. Hyperinsulinemia and associated factors are a potential contributor, as has been reported in one recent study of colorectal cancer.29 A recent large meta-analysis did not show any effect of diabetes on survival in pancreatic cancer patients.30 However, one study of 400 male Finnish smokers suggested higher insulin levels were associated with increased risk for pancreatic cancer.6 Obesity has been associated with low grade chronic inflammation, with possibly a shift toward a Th2 (tolerant) immune state, which has been associated with carcinogenesis31–33 and cancer progression34–37 Therefore, an alternate possibility is decreased immune function, which could lead to more rapid tumor progression and thereby poorer survival. A third possibility would be bias in treatment determinations, such as aggressiveness of therapy (multiple agents or modalities) or decreased dosing of chemotherapy in obese patients. Resources did not permit us to fully pursue this possibility
The strengths of our study include its large size, the inclusion of only specialist-verified adenocarcinoma, the ready availability of electronic medical records when questionnaires were not completed, and the completeness of our follow-up. The dose-dependent nature of our findings, the strength of the association, and the significance of the finding after adjusting for performance score add to the internal validity of this association.
There are several potential limitations to our study. We relied on self-reported usual adult BMI, which can be problematic since weight can vary throughout life, although we felt this was a superior measure than weight at study entry, since pancreatic cancer often causes dramatic weight loss, often just prior to diagnosis. It could be argued that BMI may affect stage at presentation, or likelihood of a patient undergoing surgery, thus influencing survival. However, we observed no differences in BMI between stage groupings: median usual adult BMI for resectable, locally advanced, and metastatic tumors were 27.9, 28.2, and 28.0 kg/m2, respectively (p=0.647). With regard to limitations of measures, BMI is but one measure of obesity, although it is perhaps the most widely accepted measure in clinical studies. FBG and self-report of diabetes are imprecise measures of hyperinsulinemia; more direct measures are required to further elucidate in this setting the relationship of BMI to hormonal changes in insulin and similar species, such as insulin-like growth factor and IGF-binding proteins. These parameters should be investigated in future studies.
Numerous studies comparing self reported to measured BMI have found that self-reported BMI is generally valid to use38–41, though subjects may underestimate weight, which in our study would bias toward the null. We believe that usual adult BMI is a reasonable surrogate for aggregate exposure to whatever risk high BMI imposes for a given individual over their lifetime, and has similar issues for accuracy and recall as seen for usual alcohol intake or cigarette use, commonly used in epidemiologic studies. Our study did not include therapies administered. However, given the minimal impact on survival of current therapies, and the nearly uniform use of gemcitabine-based regimens for locally advanced and metastatic disease, it could be argued that therapy differences would not notably affect our findings.
Future studies will be necessary to investigate this association of elevated BMI and survival. If the mechanism is ever clearly elucidated, this may lead to potential therapeutic targeting. For instance, since elevated levels of circulating insulin can activate IGF receptors42, blockade of these receptors through targeted therapy may represent a logical approach to improving outcomes for patients. We believe this association of BMI with survival provides an important clue to the understanding of why this cancer is so deadly and resistant to therapy. A thorough understanding of the mechanisms could lead to improving our care for these patients.
Conclusion
Increasing body mass index is associated with decreased survival in those diagnosed with pancreatic cancer, after adjusting for known confounders. Body-mass index should be considered as a covariate in prospective studies of pancreatic cancer. The mechanism of this finding requires further study.
Table 2.
Association of pancreatic cancer survival by usual adult BMI category.
| Subject group | Variable | Subcategory | N | HR (95% CI) | p-value |
|---|---|---|---|---|---|
| Overall | BMI (kg/m2) | < 18.5 | 13 | 1.30 (0.69–2.44) | <0.001 |
| 18.5–24.99 (ref) | 534 | 1.00 | |||
| 25.0–29.99 | 721 | 1.02 (0.89–1.16) | |||
| 30.0–34.99 | 361 | 1.14 (0.98–1.33) | |||
| 35.0–39.99 | 138 | 1.32 (1.08–1.62) | |||
| ≥ 40.0 | 94 | 1.60 (1.26–2.04) | |||
| Sex | Male | 1,044 | 0.99 (0.89–1.10) | 0.806 | |
| Age | Age at diagnosis | 1,861 | 1.02 (1.01–1.02) | <0.001 | |
| Surgical Stage | Resectable (ref) | 560 | 1.00 | <0.001 | |
| Locally advanced | 651 | 2.99 (2.60–3.43) | |||
| Metastatic | 650 | 4.76 (4.14–5.47) | |||
| Completed RFQ | BMI (kg/m2) | < 18.5 | 7 | 1.80 (0.80–4.07) | 0.009 |
| 18.5–24.99 (ref) | 368 | -- | |||
| 25.0–29.99 | 493 | 1.01 (0.86–1.18) | |||
| 30.0–34.99 | 238 | 1.12 (0.93–1.35) | |||
| 35.0–39.99 | 80 | 1.32 (1.02–1.72) | |||
| ≥ 40.0 | 46 | 1.67 (1.19–2.33) | |||
| Did not complete RFQ | BMI (kg/m2) | < 18.5 | 6 | 0.75 (0.27–2.07) | 0.222 |
| 18.5–24.99 (ref) | 166 | 1.00 | |||
| 25.0–29.99 | 228 | 1.05(0.84–1.33) | |||
| 30.0–34.99 | 123 | 1.23 (0.95–1.59) | |||
| 35.0–39.99 | 58 | 1.30 (0.93–1.80) | |||
| ≥ 40.0 | 48 | 1.43 (1.0–2.05) | |||
| Resectable | BMI (kg/m2) | < 18.5 | 4 | 4.78 (1.59–14.37) | 0.037 |
| 18.5–24.99 (ref) | 171 | 1.00 | |||
| 25.0–29.99 | 220 | 1.24 (0.95–1.62) | |||
| 30.0–34.99 | 103 | 1.13 (0.82–1.56) | |||
| 35.0–39.99 | 39 | 1.29 (0.84–1.99) | |||
| ≥ 40.0 | 23 | 1.67 (1.00–2.79) | |||
| Sex | Male | 297 | 1.05 (0.84–1.30) | 0.687 | |
| Age | Age at diagnosis | 560 | 1.01 (1.00, 1.02) | 0.072 | |
| Locally Advanced | BMI (kg/m2) | < 18.5 | 5 | 1.37 (0.43–4.32) | 0.067 |
| 18.5–24.99 (ref) | 179 | 1.00 | |||
| 25.0–29.99 | 254 | 1.03 (0.83–1.28) | |||
| 30.0–34.99 | 123 | 1.07 (0.83–1.38) | |||
| 35.0–39.99 | 50 | 1.56 (1.12–2.17) | |||
| ≥ 40.0 | 40 | 1.46 (0.99–2.16) | |||
| Sex | Male | 365 | 0.94 (0.79–1.12) | 0.509 | |
| Age | Age at diagnosis | 651 | 1.02 (1.01, 1.03) | <0.001 | |
| Metastatic | BMI (kg/m2) | < 18.5 | 4 | 0.82 (0.26–2.58) | 0.018 |
| 18.5–24.99 (ref) | 184 | 1.00 | |||
| 25.0–29.99 | 247 | 0.89 (0.72–1.09) | |||
| 30.0–34.99 | 135 | 1.1743 (0.93–1.48) | |||
| 35.0–39.99 | 49 | 1.105 (0.80–1.53) | |||
| ≥ 40.0 | 31 | 1.63 (1.10–2.40) | |||
| Sex | Male | 382 | 0.98 (0.83–1.16) | 0.824 | |
| Age | Age at diagnosis | 650 | 1.02(1.01–1.03) | <0.001 | |
| Overall model (including FBG) | BMI (kg/m2) | < 18.5 | 10 | 1.23 (0.58, 2.62) | 0.007 |
| 18.5–24.99 (ref) | 402 | 1.00 | |||
| 25.0–29.99 | 563 | 0.93 (0.80–1.08) | |||
| 30.0–34.99 | 284 | 1.05 (0.89–1.25) | |||
| 35.0–39.99 | 111 | 1.22 (0.97–1.53) | |||
| ≥ 40.0 | 73 | 1.49 (1.13–1.97) | |||
| Sex | Male | 834 | 0.93 (0.83, 1.05) | 0.251 | |
| Age | Age at diagnosis | 1443 | 1.02 (1.01–1.02) | <0.001 | |
| FBG | Fasting Blood | 1443 | 1.01 (1.00–1.02) | 0.082 | |
| Glucose/10 | |||||
| Overall model (including DM) | BMI (kg/m2) | < 18.5 | 12 | 1.42 (0.76, 2.68) | 0.009 |
| 18.5–24.99 (ref) | 438 | 1.00 | |||
| 25.0–29.99 | 604 | 1.03 (0.89–1.18) | |||
| 30.0–34.99 | 294 | 1.16 (0.98–1.37) | |||
| 35.0–39.99 | 107 | 1.35 (1.07–1.69) | |||
| ≥ 40.0 | 74 | 1.50 (1.13–1.98) | |||
| Sex | Male | 864 | 0.98 (0.87–1.10) | 0.721 | |
| Age | Age at diagnosis | 1529 | 1.02 (1.01–1.02) | <0.001 | |
| Diabetes | Yes | 472 | 1.08 (0.95–1.22) | 0.229 |
BMI= Body-Mass Index, FBG= fasting blood glucose, DM = self reported diabetes mellitus
Acknowledgments
Funding: Supported by: NIH grants SPORE P50CA102701, K07CA116303
We acknowledge Gloria Petersen, Ph.D. for allowing us to use the Mayo Clinic Pancreas SPORE Registry for this work, and for her guidance on this project.
Footnotes
Financial Disclosure: None of the authors have financial disclosures to report.
Presented in part at the 2009 Gastrointestinal Cancers Symposium, Jan. 15–17th, 2009, San Francisco, CA
References
- 1.Michaud DS, Giovannucci E, Willett WC, Colditz GA, Stampfer MJ, Fuchs CS. Physical Activity, Obesity, Height, and the Risk of Pancreatic Cancer. JAMA. 2001;286(8):921–29. doi: 10.1001/jama.286.8.921. [DOI] [PubMed] [Google Scholar]
- 2.Silverman DT, Swanson CA, Gridley G, et al. Dietary and nutritional factors and pancreatic cancer: a case-control study based on direct interviews. J Natl Cancer Inst. 1998;90(22):1710–9. doi: 10.1093/jnci/90.22.1710. [DOI] [PubMed] [Google Scholar]
- 3.Gapstur SM, Gann PH, Lowe W, Liu K, Colangelo L, Dyer A. Abnormal Glucose Metabolism and Pancreatic Cancer Mortality. JAMA. 2000;283(19):2552–58. doi: 10.1001/jama.283.19.2552. [DOI] [PubMed] [Google Scholar]
- 4.Coughlin SS, Calle EE, Patel AV, Thun MJ. Predictors of pancreatic cancer mortality among a large cohort of United States adults. Cancer Causes Control. 2000;11(10):915–23. doi: 10.1023/a:1026580131793. [DOI] [PubMed] [Google Scholar]
- 5.Patel AV, Rodriguez C, Bernstein L, Chao A, Thun MJ, Calle EE. Obesity, recreational physical activity, and risk of pancreatic cancer in a large U.S. Cohort. Cancer Epidemiol Biomarkers & Prev. 2005;14(2):459–66. doi: 10.1158/1055-9965.EPI-04-0583. [DOI] [PubMed] [Google Scholar]
- 6.Stolzenberg-Solomon RZ, Graubard BI, Chari S, et al. Insulin, Glucose, Insulin Resistance, and Pancreatic Cancer in Male Smokers. JAMA. 2005;294(22):2872–78. doi: 10.1001/jama.294.22.2872. [DOI] [PubMed] [Google Scholar]
- 7.Larsson SC, Orsini N, Wolk A. Body mass index and pancreatic cancer risk: A meta-analysis of prospective studies. Int J Cancer. 2007;120(9):1993–8. doi: 10.1002/ijc.22535. [DOI] [PubMed] [Google Scholar]
- 8.Zyromski NJ, Mathur A, Pitt HA, et al. Obesity potentiates the growth and dissemination of pancreatic cancer. Surgery. 2009;146(2):258–63. doi: 10.1016/j.surg.2009.02.024. [DOI] [PubMed] [Google Scholar]
- 9.Mathur A, Zyromski NJ, Pitt HA, et al. Pancreatic steatosis promotes dissemination and lethality of pancreatic cancer. J Am Coll Surg. 2009;208(5):989–94. doi: 10.1016/j.jamcollsurg.2008.12.026. discussion 94–6. [DOI] [PubMed] [Google Scholar]
- 10.Meyerhardt JA, Catalano PJ, Haller DG, et al. Influence of body mass index on outcomes and treatment-related toxicity in patients with colon carcinoma. Cancer. 2003;98(3):484–95. doi: 10.1002/cncr.11544. [DOI] [PubMed] [Google Scholar]
- 11.Freedland SJ, Aronson WJ, Kane CJ, et al. Impact of Obesity on Biochemical Control After Radical Prostatectomy for Clinically Localized Prostate Cancer: A Report by the Shared Equal Access Regional Cancer Hospital Database Study Group. J Clin Oncol. 2004;22(3):446–53. doi: 10.1200/JCO.2004.04.181. [DOI] [PubMed] [Google Scholar]
- 12.Donegan WL, Hartz AJ, Rimm AA. The association of body weight with recurrent cancer of the breast. Cancer. 1978;41(4):1590–4. doi: 10.1002/1097-0142(197804)41:4<1590::aid-cncr2820410449>3.0.co;2-n. [DOI] [PubMed] [Google Scholar]
- 13.Boyd NF, Campbell JE, Germanson T, Thomson DB, Sutherland DJ, Meakin JW. Body weight and prognosis in breast cancer. J Natl Cancer Inst. 1981;67(4):785–9. [PubMed] [Google Scholar]
- 14.Daling JR, Malone KE, Doody DR, Johnson LG, Gralow JR, Porter PL. Relation of body mass index to tumor markers and survival among young women with invasive ductal breast carcinoma. Cancer. 2001;92(4):720–9. doi: 10.1002/1097-0142(20010815)92:4<720::aid-cncr1375>3.0.co;2-t. [DOI] [PubMed] [Google Scholar]
- 15.Newman SC, Lees AW, Jenkins HJ. The effect of body mass index and oestrogen receptor level on survival of breast cancer patients. Int J Epidemiol. 1997;26(3):484–90. doi: 10.1093/ije/26.3.484. [DOI] [PubMed] [Google Scholar]
- 16.House MG, Fong Y, Arnaoutakis DJ, et al. Preoperative predictors for complications after pancreaticoduodenectomy: impact of BMI and body fat distribution. J Gastrointest Surg. 2008;12(2):270–8. doi: 10.1007/s11605-007-0421-7. [DOI] [PubMed] [Google Scholar]
- 17.Fleming JB, Gonzalez RJ, Petzel MQB, et al. Influence of Obesity on Cancer-Related Outcomes After Pancreatectomy to Treat Pancreatic Adenocarcinoma. Arch Surg. 2009;144(3):216–21. doi: 10.1001/archsurg.2008.580. [DOI] [PubMed] [Google Scholar]
- 18.Benns M, Woodall C, Scoggins C, McMasters K, Martin R. The Impact of Obesity on Outcomes Following Pancreatectomy for Malignancy. Ann Surg Oncol. 2009;16(9):2565–69. doi: 10.1245/s10434-009-0573-7. [DOI] [PubMed] [Google Scholar]
- 19.Li D, Morris J, Li J, et al. Body Mass Index and Risk, Age of Onset, and Survival in Pancreatic Cancer Patients. JAMA. 2009;301:2553–62. doi: 10.1001/jama.2009.886. [DOI] [PMC free article] [PubMed] [Google Scholar]
- 20.Olson SH, Chou JF, Ludwig E, et al. Allergies, obesity, other risk factors and survival from pancreatic cancer. Int J Cancer. doi: 10.1002/ijc.25240. (Published online Feb 8, 2010) [DOI] [PubMed] [Google Scholar]
- 21.McWilliams RR, Bamlet WR, Cunningham JM, et al. Polymorphisms in DNA repair genes, smoking, and pancreatic adenocarcinoma risk. Cancer Res. 2008;68(12):4928–35. doi: 10.1158/0008-5472.CAN-07-5539. [DOI] [PMC free article] [PubMed] [Google Scholar]
- 22.Karnofsky D, JHB . The clinical evaluation of chemotherapeutic agents in cancer. New York: Columbia University Press; 1949. [Google Scholar]
- 23.McWilliams RR, Bamlet WR, de Andrade M, Rider DN, Cunningham JM, Petersen GM. Nucleotide excision repair pathway polymorphisms and pancreatic cancer risk: evidence for role of MMS19L. Cancer Epidemiol Biomarkers Prev. 2009;18(4):1295–302. doi: 10.1158/1055-9965.EPI-08-1109. [DOI] [PMC free article] [PubMed] [Google Scholar]
- 24.Pi-Sunyer F, Becker D, Bouchard C, Carleton R, Colditz G, Dietz W. National Institutes of Health NHLaBI. Clinical Guidelines on the Identification, Evaluation, and Treatment of Overweigth and Obesity in Adults: The Evidence Report. 98–4083. 1998. p. xiv. [Google Scholar]
- 25.Li D, Hassan MM, Abbruzzese JL. Obesity and Survival Among Patients With Pancreatic Cancer--Reply. JAMA. 2009;302(16):1752-a-53. doi: 10.1001/jama.2009.1510. [DOI] [PubMed] [Google Scholar]
- 26.Hankinson SE, Willett WC, Manson JE, et al. Alcohol, Height, and Adiposity in Relation to Estrogen and Prolactin Levels in Postmenopausal Women. J Natl Cancer Inst. 1995;87(17):1297–302. doi: 10.1093/jnci/87.17.1297. [DOI] [PubMed] [Google Scholar]
- 27.Schneider G, Kirschrier MA, Berkowitz R, Ertel NH. Increased estrogen production in obese men. J Clin Endocrinol Metab. 1979;48:633–38. doi: 10.1210/jcem-48-4-633. [DOI] [PubMed] [Google Scholar]
- 28.Wing RR, Matthews KA, Kuller LH, et al. Environmental and familial contributions to insulin levels and change in insulin levels in middle-aged women. JAMA. 1992;268(14):1890–5. [PubMed] [Google Scholar]
- 29.Wolpin BM, Meyerhardt JA, Chan AT, et al. Insulin, the Insulin-Like Growth Factor Axis, and Mortality in Patients With Nonmetastatic Colorectal Cancer. J Clin Oncol. 2009;27(2):176–85. doi: 10.1200/JCO.2008.17.9945. [DOI] [PMC free article] [PubMed] [Google Scholar]
- 30.Barone BB, Yeh HC, Snyder CF, et al. Long-term all-cause mortality in cancer patients with preexisting diabetes mellitus: a systematic review and meta-analysis. JAMA. 2008;300(23):2754–64. doi: 10.1001/jama.2008.824. [DOI] [PMC free article] [PubMed] [Google Scholar]
- 31.Bais AG, Beckmann I, Lindemans J, et al. A shift to a peripheral Th2-type cytokine pattern during the carcinogenesis of cervical cancer becomes manifest in CIN III lesions. J Clin Pathol. 2005;58(10):1096–100. doi: 10.1136/jcp.2004.025072. [DOI] [PMC free article] [PubMed] [Google Scholar]
- 32.Whary MT, Sundina N, Bravo LE, et al. Intestinal Helminthiasis in Colombian Children Promotes a Th2 Response to Helicobacter pylori: Possible Implications for Gastric Carcinogenesis. Cancer Epidemiol Biomarkers Prev. 2005;14(6):1464–69. doi: 10.1158/1055-9965.EPI-05-0095. [DOI] [PubMed] [Google Scholar]
- 33.Pellegrini P, Berghella AM, Del Beato T, Cicia S, Adorno D, Casciani CU. Disregulation in TH1 and TH2 subsets of CD4+ T cells in peripheral blood of colorectal cancer patients and involvement in cancer establishment and progression. Cancer Immunol Immunother. 1996;42(1):1–8. doi: 10.1007/s002620050244. [DOI] [PMC free article] [PubMed] [Google Scholar]
- 34.Kusuda T, Shigemasa K, Arihiro K, Fujii T, Nagai N, Ohama K. Relative expression levels of Th1 and Th2 cytokine mRNA are independent prognostic factors in patients with ovarian cancer. Oncol Rep. 2005;13(6):1153–8. [PubMed] [Google Scholar]
- 35.Lee PP, Zeng D, McCaulay AE, et al. T helper 2-dominant antilymphoma immune response is associated with fatal outcome. Blood. 1997;90(4):1611–7. [PubMed] [Google Scholar]
- 36.Fantuzzi G. Adipose tissue, adipokines, and inflammation. J Allergy Clin Immunol. 2005;115(5):911–19. doi: 10.1016/j.jaci.2005.02.023. [DOI] [PubMed] [Google Scholar]
- 37.Hersoug LG, Linneberg A. The link between the epidemics of obesity and allergic diseases: does obesity induce decreased immune tolerance? Allergy. 2007;62(10):1205–13. doi: 10.1111/j.1398-9995.2007.01506.x. [DOI] [PubMed] [Google Scholar]
- 38.Elgar FJ, Stewart JM. Validity of self-report screening for overweight and obesity. Evidence from the Canadian Community Health Survey. Can J Public Health. 2008;99(5):423–7. doi: 10.1007/BF03405254. [DOI] [PMC free article] [PubMed] [Google Scholar]
- 39.Dekkers J, van Wier M, Hendriksen I, Twisk J, van Mechelen W. Accuracy of self-reported body weight, height and waist circumference in a Dutch overweight working population. BMC Med Res Methodol. 2008;8(1):69. doi: 10.1186/1471-2288-8-69. [DOI] [PMC free article] [PubMed] [Google Scholar]
- 40.Kovalchik S. Validity of adult lifetime self-reported body weight. Public Health Nutr. 2009;12(8):1072–77. doi: 10.1017/S1368980008003728. [DOI] [PubMed] [Google Scholar]
- 41.Spencer EA, Appleby PN, Davey GK, Key TJ. Validity of self-reported height and weight in 4808 EPIC-Oxford participants. Public Health Nutr. 2002;5(4):561–65. doi: 10.1079/PHN2001322. [DOI] [PubMed] [Google Scholar]
- 42.Steele-Perkins G, Turner J, Edman JC, et al. Expression and characterization of a functional human insulin-like growth factor I receptor. J Biol Chem. 1988;263(23):11486–92. [PubMed] [Google Scholar]