

Abstract
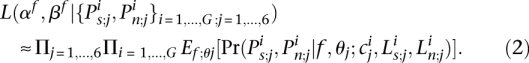
How much does the intensity of purifying selection vary among populations and species? How uniform are the shifts in selective pressures across the genome? To address these questions, we took advantage of a recent, whole-genome polymorphism data set from two closely related species of yeast, Saccharomyces cerevisiae and S. paradoxus, paying close attention to the population structure within these species. We found that the average intensity of purifying selection on amino acid sites varies markedly among populations and between species. As expected in the presence of extensive weakly deleterious mutations, the effect of purifying selection is substantially weaker on single nucleotide polymorphisms (SNPs) segregating within populations than on SNPs fixed between population samples. Also in accordance with a Nearly Neutral model, the variation in the intensity of purifying selection across populations corresponds almost perfectly to simple measures of their effective size. As a first step toward understanding the processes generating these patterns, we sought to tease apart the relative importance of systematic, genome-wide changes in the efficacy of selection, such as those expected from demographic processes and of gene-specific changes, which may be expected after a shift in selective pressures. For that purpose, we developed a new model for the evolution of purifying selection between populations and inferred its parameters from the genome-wide data using a likelihood approach. We found that most, but not all changes seem to be explained by systematic shifts in the efficacy of selection. One population, the sake-derived strains of S. cerevisiae, however, also shows extensive gene-specific changes, plausibly associated with domestication. These findings have important implications for our understanding of purifying selection as well as for estimates of the rate of molecular adaptation in yeast and in other species.
A striking observation to emerge from comparative genomics is that a large number of core proteins are preserved across the three domains of life (Koonin 2003). This observation highlights the pervasiveness and effectiveness of natural selection: Despite repeated, injurious mutations, core proteins remain virtually unchanged across organisms, because purifying selection eliminates deleterious changes from the population. At the same time, other proteins are markedly dissimilar across taxa (Amos et al. 2004), with whole families of proteins appearing and disappearing (Snel et al. 2002; Lynch 2007). So, while purifying selection can be extremely effective, it is also a dynamic force that varies across the genome and changes intensity over evolutionary time scales. These considerations raise a number of questions, notably: How quickly does the intensity of purifying selection change? How uniform are the shifts in selective pressures across the genome? Are they primarily driven by changes in the environment, which alter the nature of selective pressures at a subset of genes, or by demographic changes that shape the efficacy of purifying selection across the genome?
In principle, answers to these questions can be garnered by analyzing patterns of variation within and between species. Because purifying selection eliminates deleterious mutations that arise in a population, its signature is a reduction in the level of diversity within species, as well as a decrease in the rate of evolutionary change between species, relative to what is seen at neutral sites. Therefore, one way to characterize the intensity of purifying selection is to measure the strength of this effect as the fraction of mutations removed by selection (Halligan and Keightley 2006). In particular, this approach can be used to study purifying selection in protein-coding regions, under the simplifying assumption that synonymous mutations are neutral. The decrease in the number of amino acid substitutions due to selection can be estimated from the ratio of nonsynonymous to synonymous divergence between closely related species as 1-dN/dS. Similarly, the reduction in amino acid diversity can be estimated from the ratio of nonsynonymous to synonymous polymorphism levels, 1-pN/pS (henceforth we denote dN/dS as ω [Yang 1997] and pN/pS as f, following Smith and Eyre-Walker 2002). Both measures have been used widely in order to identify genomic regions that are likely important to organismal fitness (Dermitzakis et al. 2002; Frazer et al. 2003; Siepel et al. 2005; Woolfe et al. 2005; Molina and van Nimwegen 2008) as well as to quantify the intensity of purifying selection on coding and noncoding regions within a species (Fay et al. 2001; Keightley and Gaffney 2003; Halligan et al. 2004; Halligan and Keightley 2006; Haddrill et al. 2008). To date, divergence-based measures have been used much more extensively, as divergence data were more readily available than polymorphism data (Eyre-Walker et al. 2002; Keightley and Gaffney 2003; Halligan and Keightley 2006).
In a random mating population of constant size and under the assumptions of the Neutral theory—in which mutations either are so strongly deleterious that they contribute to neither polymorphism nor divergence, or neutral—the polymorphism and divergence-based measures are expected to be similar (Kimura 1983; Graur and Li 2000; Lynch 2007). But departures from these assumptions can lead to differences between the two measures. Notably, weakly deleterious mutations contribute much more to polymorphism than to divergence (Kimura 1983). Therefore, if many amino acid mutations are weakly deleterious, f is expected to be larger than ω (Ohta 1973, 1992). Nonequilibrium demographic processes and population structure also affect the two measures differently. For example, changes in the effective size of a population, Ne, can increase the efficacy of selection, rendering previously nearly and effectively neutral mutations more strongly deleterious (i.e., leading Ne|s| to exceed 1, where s is the selection coefficient) (Woolfit 2009). As polymorphism stems from the accumulation of mutations over the last ∼4Ne generations, whereas divergence reflects changes that accumulated since the time at which the species under consideration split, f will tend to capture the intensity of purifying selection in the relatively recent history of the population and ω its cumulative effects over a longer period.
In addition to reflecting the intensity of purifying selection on amino acid mutations in distinct ways, ω and f are differentially sensitive to other evolutionary forces. For instance, if many synonymous mutations are weakly selected—as indicated by studies of codon-usage bias in a range of species (Sharp et al. 1988)—then measures such as ω and, to a lesser extent, f, will tend to suggest a weaker intensity of purifying selection on nonsynonymous mutations than is actually the case (Eyre-Walker 2002). In addition, ω may suggest that purifying selection is weaker than it is if directional positive selection on amino acid mutations contributes substantially to divergence; f should be much less affected, as favorable mutations are unlikely to be sampled while polymorphic (Sawyer and Hartl 1992).
The use of a single measure such as f or ω collapses the effects of purifying selection into a single number. A second approach has been instead to quantify the effects of purifying selection by characterizing the full distribution of mutational selective effects (DME). Studies using this approach tend to estimate the DME of amino acid mutations by assuming a parametric family of distributions and fitting it to summaries of polymorphism data (e.g., the site-frequency spectrum) from a single species and to divergence from a closely related species (Sawyer et al. 1987; Sawyer and Hartl 1992; Templeton 1996; Bustamante et al. 2001; Fay et al. 2001; Piganeau and Eyre-Walker 2003; Wakeley 2003; Williamson et al. 2004; Eyre-Walker et al. 2006; Huerta-Sanchez et al. 2008). Recent extensions have also incorporated the effects of nonequilibrium demography into the inference scheme (Williamson et al. 2005; Keightley and Eyre-Walker 2007). Some studies took a slightly different approach, inferring the DME from multilocus polymorphism data in two closely related species of Drosophila, under the assumption that all changes in f between them reflect differences in their effective population size (Loewe and Charlesworth 2006; Loewe et al. 2006). While such model-based approaches to the study of purifying selection have the potential to describe the workings of purifying selection in great detail, they necessarily rely on strong assumptions, the realism and effects of which remain largely unknown.
Moreover, while many studies have examined how purifying selection varies among different genomic regions or estimated the DME at specific classes of sites (e.g., nonsynonymous sites), little or no attention has been paid to how the intensity of purifying selection changes among populations or species (but, see Boyko et al. 2008; Foxe et al. 2008). On theoretical grounds, the effective size of a species is expected to affect the intensity of selection (cf. Kimura 1983). In accordance with this prediction, Ohta and others found that ω increases with the generation time of a species, which is inversely correlated to population size (Ohta 1972; Li et al. 1987; Chao and Carr 1993; Ohta and Ina 1995; Keightley and Eyre-Walker 2000). Other studies have reported tentative evidence for a negative relationship between ω and measures of the extant effective population size, such as synonymous heterozygosity (Eyre-Walker et al. 2002; Eyre-Walker and Keightley 2007).
While most previous studies relied on divergence data, there are several advantages to studying these questions with polymorphism data. As described above, polymorphism-based measures such as f will be relatively insensitive to the confounding effects of adaptive evolution, in contrast to measures such as ω (McDonald and Kreitman 1991). Moreover, because f reflects the selective history over a more recent period, it is easier to relate to estimates of the current effective population size.
To examine the evolution of purifying selection, the ideal polymorphism data set would be genome-wide to allow one to determine whether changes in the intensity of purifying selection occur across genes or only at a subset, and collected in closely related species, which are likely more comparable with respect to other parameters. The recent publication of genome-wide polymorphism data from two closely related yeast species, S. cerevisiae and S. paradoxus, offers one of the first, if not the first, datasets of this kind (Liti et al. 2009). Yeast is also an interesting test case for several reasons. First, previous studies indicated the presence of clear population structure in both S. cerevisiae and S. paradoxus (Koufopanou et al. 2006; Liti et al. 2009), potentially allowing one to treat diversity patterns within a subpopulation as reflecting evolutionary forces in that population alone (Kimura and Maruyama 1971). Second, the comparison of S. cerevisiae, some strains of which were affected by human domestication (Fay and Benavides 2005), to the wild species S. paradoxus, may shed light on the effects of domestication at the genomic level. Third, accumulating functional genomics studies of S. cerevisiae (Wall et al. 2005; Drummond et al. 2006; Zhu et al. 2008) will make it possible to relate changes in purifying selection with functional attributes.
Two recent studies have used genome-wide variation data from one or two of these species in order to study the effects of natural selection on genome evolution (Doniger et al. 2008; Liti et al. 2009). Focusing on polymorphism from one species and divergence data, they found few or no genes with significant evidence of adaptive evolution (following the approach of McDonald and Kreitman [1991]). Instead, both studies reported extensive evidence for purifying selection, which was also supported by a comparison of the site-frequency spectrum at synonymous and nonsynonymous sites (Liti et al. 2009). These studies did not account for the population structure, but rather treated each species as a single, panmictic population. Here, we focused on the single nucleotide polymorphism (SNP) data from both yeast species with population structure as our starting point.
Results
The data set
Our analysis focused on resequencing polymorphism data in coding regions of two closely related yeast species, S. cerevisiae and S. paradoxus. The data set was generated by the Saccharomyces Genome Resequencing Project (Liti et al. 2009); we focused on the subset consisting of the genome-wide sequences from 16 strains of S. cerevisiae and 24 strains of S. paradoxus, covered to a depth of 1–3× by ABI resequencing (see Methods) and used orthologous open reading frames (ORFs) identified in both species by Kellis et al. (2003). After applying several quality control steps (see below and Methods), we retained 3132 protein-coding genes (of the 6610 identified in S. cerevisiae [http://www.yeastgenome.org]), which had been sequenced to an average sample size of approximately eight strains in S. cerevisiae and ∼13 strains in S. paradoxus.
Our analysis treats synonymous diversity as reflective of neutral polymorphism levels, even though selection for synonymous codon usage is well documented in yeast (Bennetzen and Hall 1982; Sharp et al. 1986, 1988; Akashi 2003; Qin et al. 2004). To assess the possible effects of this selection on synonymous diversity, we examined the correlation between levels of codon usage bias, measured by the codon adaptation index (CAI) (Sharp and Li 1987), and synonymous diversity in our samples (Supplemental Fig. 1). We did not find a significant correlation between the two (Supplemental Methods), leading us to conclude that, in this data set, statistics based on synonymous SNPs are not markedly affected by selection on synonymous codon usage. Nevertheless, out of precaution we removed genes with high CAI values (CAI > 0.5), which are known to be associated with high expression levels and are enriched for ribosomal genes (Sharp et al. 1986; Akashi 2003). This procedure left us with 3037 of 3132 genes.
The demographic structure of the two species
Throughout our study, we relied on the demographic analysis of the data set performed by Liti et al. (2009), the qualitative conclusions of which were confirmed by our own analysis (Supplemental Methods). Specifically, we focused on the 24 strains in S. paradoxus and 16 strains in S. cerevisiae found to be of “clear” origin, i.e., not mosaics or hybrids, by Liti et al. (2009). We also followed their assignment of these strains into distinct populations. Using both the program structure (Pritchard et al. 2000; Falush et al. 2003) and neighbor-joining trees (cf. Graur and Li 2000), they found three distinct populations in S. paradoxus, with consistent trees across the genome. In S. cerevisiae, five populations appear to be related by a consistent tree along the genome, corresponding to four nonadmixed clusters and one admixed cluster in the structure analysis (Liti et al. 2009). Overall, the classification of strains follows their “geographic” origin: In S. paradoxus, the three clusters consist of: (1) 15 strains from Europe, (2) five from North America, and (3) four from the Far East, while in S. cerevisiae, the five clusters correspond to (1) eight strains from Europe, including those derived from wine, (2) one from West Africa, (3) three derived from sake and palm wine (including one from the Ivory-Coast in Africa), (4) three from Malaysia, and (5) one from North America.
Patterns of genetic variation within and between populations
We considered the population structure as inducing a partition of the SNPs in our samples. A subset of SNPs is segregating within a population sample. A second set of SNPs is fixed for one allele in a sample from one population and for another allele in a second population sample. In this case, we inferred which allele is derived and assigned it to the population sample in which it appeared as fixed by using the consensus sequence of the other species as an outgroup (see Supplemental Methods for the construction of the consensus sequences). In an analogous manner, we assigned ancestral and derived states to SNPs at which one allele was fixed in samples from two populations but differed from a third, more distant population sample. Overall, we found 4040 SNPs segregating within population samples in S. cerevisiae and 12,975 in S. paradoxus, compared with 26,125 SNPs fixed among population samples in S. cerevisiae and 74,956 in S. paradoxus.
Additional classes of potential interest consist of SNPs that are shared among two or more populations. If there is little genetic exchange between populations and a small contribution of ancestral polymorphism, as the demographic analysis suggests, then we would expect to find relatively few shared SNPs. To examine whether this is the case, we focused on synonymous SNPs. In concordance with this expectation, we found few SNPs that are segregating in more than one population—20 such SNPs in S. cerevisiae and 53 in S. paradoxus—which is roughly an order of magnitude higher than the number expected by chance, assuming that the populations are completely independent (Supplemental Methods), but still negligible compared with the numbers of SNPs segregating in each population (i.e., <1.5% of the total number of segregating SNPs). In turn, when we examined the number of SNPs that are segregating in one population sample and fixed for the derived allele in another, which might also be considered as shared, we found substantially more than expected by chance. However, once we accounted for errors in the inference of the derived state due to a substitution on the lineage leading to the outgroup, the numbers of shared SNPs were similar to those expected by chance (Supplemental Methods). Although not definitive, these findings suggest that the populations identified by the demographic analysis are largely independently evolving. We therefore did not treat shared SNPs as a distinct category in our subsequent analyses. Moreover, we assumed that the patterns of polymorphism seen in a population reflect selection pressures in that population alone.
We note that a SNP could appear as fixed between populations either because a derived allele was fixed in one of the populations, or because an allele is segregating in a population, but we happened only to sample the derived allele. Considering the levels of synonymous heterozygosity in each population and assuming the standard neutral model, we calculated the number of segregating sites expected to appear as fixed in our samples (cf. Ewens 1979). Based on this calculation, we estimated that the fraction of segregating SNPs comprises 3%–8.5% of the SNPs that appear fixed in S. paradoxus population samples, 7.5% in the European S. cerevisiae population, 5.5% in the Malaysian population, and 43% in the sake-derived population (Supplemental Methods). These are likely to be overestimates, because the observed site-frequency spectra appear to be skewed toward rare alleles (Liti et al. 2009) relative to what is expected under the standard neutral model. Examining the site-frequency spectrum of SNPs from the European samples of S. cerevisiae and S. paradoxus (Supplemental Fig. 3) further suggests that the vast majority of SNPs that are fixed in these samples are fixed in the corresponding populations. An exception may be the sake-derived population of S. cerevisiae, in which a considerable fraction of SNPs that appear fixed may actually be segregating. Henceforth, we refer to this category as “fixed” SNPs, distinguishing them from “segregating” SNPs, i.e., cases where both alleles are found within the same population sample.
The relationship between demographic structure and the intensity of purifying selection
We considered several measures of the intensity of selection in a population, which differ in the summary of polymorphism on which they rely; all are cases of what was generally referred to as f in the introduction to this paper. For segregating SNPs, we used a measure based on heterozygosity, π (Tajima 1983), denoted fπ, as on average it should be insensitive to sample size differences among populations. Similar qualitative results, however, were obtained using a measure based on Watterson's θ (Watterson 1975), fθ (Supplemental Table 1). We also used a measure based on the average number of fixed SNPs, denoted fϕ.
The measures defined above can be viewed as parameters that describe the genome-wide ratio pN/pS (where p stands for the corresponding polymorphism statistic) expected over repeated realizations of both the evolutionary process and the sampling of individuals from the extant population. As we have noted, these measures reflect the combined action of multiple evolutionary processes, for which we have not provided a model. Nonetheless, we can associate a measure of uncertainty with our estimates of fπ, fθ, and fϕ by assuming that each gene is an independent draw from the evolutionary and sampling process (which is essentially equivalent to a standard ergodicity assumption [Crow and Kimura 1970]). Specifically, we estimated these parameters by treating all of the genes in our sample as a single, concatenated gene, and found approximate confidence intervals by bootstrapping over genes.
First, treating all of the SNPs within each species as if they come from a single population, as done in genomic analyses of yeast data to date (Doniger et al. 2008; Liti et al. 2009), we found a substantial (and significant) difference between the estimates of fπ in the two species: 0.18 in S. cerevisiae and 0.14 in S. paradoxus (see Table 1 for confidence intervals). When we excluded rare SNPs (i.e., singleton alleles)—a common practice intended to minimize the effect of weakly deleterious amino acid mutations (Fay et al. 2001, 2002; Sawyer et al. 2003; Bierne and Eyre-Walker 2004; Andolfatto 2005; Charlesworth and Eyre-Walker 2008)—the estimates in the two species became significantly lower, as expected, and more similar to one another: 0.15 and 0.13, respectively. These point estimates are similar to those obtained by Doniger et al. (2008), although the methodologies used are slightly different.
Table 1.
Different measures of the genome-wide intensity of purifying selection

The standard errors (based on bootstrapping) appear within parentheses. For additional measures see Supplemental Table 1.
Interestingly, we obtained a markedly different answer when we heeded the population structure in these species. When we analyzed purifying selection intensities by population, we found extensive variation in the average intensities within each of these species (Table 1): Using segregating SNPs from all frequency classes, fπ varies from 0.27 to 0.37 in S. cerevisiae and from 0.16 to 0.25 in S. paradoxus; using fϕ, the measure based on fixed SNPs, there is ∼1.7-fold variation in each of the species. Thus, while an analysis that ignores population structure would suggest that there are negligible genome-wide changes in the average intensity of purifying selection between the two species, taking the population structure into account reveals extensive variation among populations both within and between species. Moreover, it suggests that, given the extensive population structure of the two species, comparisons between species as a whole are not readily interpretable—as, for example, they would depend strongly on the number of strains taken from different populations within each species.
Contrasting the measure of purifying selection based on SNPs that are segregating, fπ, to the one based on fixed SNPs, fϕ, one can conceive of two opposing expectations: If a substantial number of the amino acid differences between populations reflect adaptations to their local environments, we might expect fϕ to exceed fπ. The idea being that locally beneficial amino acid mutations are likely to be rare compared with neutral mutations and to ascend rapidly in frequency and with higher probability of fixation, thus contributing considerably less to segregating than to fixed nonsynonymous SNPs (by the same logic that underlies the McDonald-Kreitman test) (McDonald and Kreitman 1991). In contrast, if slightly deleterious mutations contribute substantially to the amino acid SNPs segregating within populations, as expected under the Nearly Neutral theory, we might expect fπ to exceed fϕ, because alleles under weak purifying selection are less likely to become fixed than they are to segregate (Ohta 1974). Our observations support the latter expectation: In all of the populations that we examined, measures based on fixed SNPs are smaller than those based on segregating SNPs, i.e., fϕ < fπ (Table 1). (We note that since fϕ reflects changes over a different and likely longer period than fπ, in principle, other processes could account for this difference.)
In the European populations of both species, for which our sample sizes are largest, we also estimated fπ after excluding singleton alleles. We observed a slight reduction from 0.37 to 0.36 in S. cerevisiae (4%) and a more substantial reduction from 0.24 to 0.20 in S. paradoxus (18%) compared with when rare alleles are not excluded (Table 1). The estimates based on intermediate frequency alleles tend to be less precise, since they rely on smaller counts of polymorphic sites. Taking into account the uncertainty in these estimates, only the reduction in S. paradoxus appears to be significant. Together, these findings are consistent with the Nearly Neutral theory of molecular evolution, in which a substantial fraction of nonsynonymous segregating alleles are weakly deleterious. If this interpretation is correct, then the selective effects of nonsynonymous alleles are closer to neutral when they are fixed (Foxe et al. 2008). Of course, this interpretation does not exclude the possibility that some of the amino acid differences between populations reflect local adaptations, but it does suggest that their overall fraction is relatively small.
The Nearly Neutral theory also predicts that the efficacy of selection should increase with the effective population size (Ohta 1974) and, therefore, that we expect to find a greater intensity of purifying selection on amino acid mutations in populations with larger effective sizes. Could such demographic differences account for the variation in the intensity of purifying selection among populations? To examine this possibility, we calculated the average synonymous heterozygosity, πS, across the genome for each population and used it as a proxy for the effective population size, Ne. Since the expected neutral heterozygosity is ∼4Neu (cf. Ewens 1979), where u is the mutation rate, differences in synonymous heterozygosity should reflect differences in the effective populations size (assuming that the mutation rate does not vary among populations). Figure 1A shows the relationship between estimates of f based on segregating SNPs and the average synonymous heterozygosity among populations. In S. paradoxus, we observed a monotonic negative relationship between the two. In S. cerevisiae, the Malaysian population has a lower f estimate than does the European population, in spite of having lower heterozygosity. However, this estimate of f is imprecise (as evidenced by the wide confidence interval), and we cannot reject the possibility that the underlying intensity of purifying selection accords with the expected relationship to the effective population size. Thus, as far as we can tell, the relationship between the intensity of purifying selection among populations in each of the two species is in full agreement with the expectations of the Nearly Neutral theory. When we considered populations from both species jointly, we still found a marginally significant negative relationship, but it is no longer strictly monotonic (Spearman's ρ = −0.77, one-tailed P-value = 0.051 with six points).
Figure 1.

The relationship between the intensity of purifying selection and the effective population size. The intensity of purifying selection is measured as the genome-wide estimate of fπ; the two proxies used for the effective population size are the genome-wide average synonymous heterozygosity values,  (A) and
  (B), where
  is the average synonymous divergence (see text). Central 95th percentiles for the estimates, represented by the horizontal and vertical bars, were estimated by bootstrapping over genes. The dashed line in B shows the expected relationship between f and assuming a gamma-shaped distribution of mutational selective effects with a point mass at s = −∞ (see text and Methods). (C) Using the same distribution, the estimated fractions of effectively neutral, weakly deleterious, and strongly deleterious amino acid mutations in each population.
One possible explanation for the deviations from a strict negative relationship is that the mutation rate varies between S. cerevisiae and S. paradoxus. Because we know of no direct measurements of the mutation rate in S. paradoxus, we assessed this possibility indirectly. To control for differences in mutation rates between species, we normalized the heterozygosity by the synonymous divergence along the lineage leading to each species, dS, which should be proportional to the mutation rate (Fig. 1B). We note that this procedure relies on additional assumptions about which little is known, most notably that the generation times along the lineages leading to each of the extant species are similar. Using this proxy, we observed a clear negative relationship between estimates of f and the effective population size (Spearman's ρ = −0.94, one-tailed P-value = 0.0083 with six points) and a relationship that is strictly monotonic if the imprecise estimate for the Malaysian population of S. cerevisiae is ignored. To better assess the statistical significance of this relationship, we simulated datasets under the assumption that f is identical in all of the populations and used the resulting slope of the least squares fit as a test statistic (see Methods). We note that this procedure corrects for any artifacts that might arise from having πS appear in both axes (although these should be small, as evidenced by the relatively small horizontal standard errors in Fig. 1B). Based on 1000 simulations, we estimated that the probability of a negative relationship as steep as or steeper than observed is <10−3. This relationship supports the notion that demographic changes, notably changes in the effective population size, strongly affect the efficacy of selection, accounting for the differences in the intensity of purifying selection.
To examine this possibility in more detail, we used the relationship in Figure 1B to infer the distribution of scaled mutational selective effects (2Nes) in each population using an approach akin to that of Loewe and Charlesworth (2006). To this end, we assumed that all of the populations share the same distribution of mutational selective effects (DME) and that the differences in f among them result from changes in Ne alone (see Methods). The fit obtained using a gamma distribution plus a point mass at s = −∞ is shown as a dashed line in Figure 1B (two other fits are shown in Supplemental Fig. 4A). Figure 1C presents estimates of the fractions of effectively neutral (2Ne|s| < 1), weakly deleterious (1 < 2Ne|s| < 10), and strongly deleterious (10 < 2Ne|s|) amino acid mutations in each of the populations (shown only for the above distribution, but fairly similar for different choices [Supplemental Fig. 4B]). These types of inferences have important limitations, as discussed above. Nonetheless, we note that the proportion of weakly deleterious mutations remains fairly constant across populations, whereas, as expected based on the Nearly Neutral theory, the effectively neutral proportion decreases and the strongly deleterious proportion increases substantially with increasing effective population size, respectively.
Genome-wide versus gene-specific changes in purifying selection
To a first approximation, changes in the intensity of purifying selection acting on individual genes can be viewed either as caused by genome-wide changes in the efficacy of selection (e.g., due to a change in the effective population size) or by gene-specific responses to the environment. Thus far, our approach focused on the average differences between populations, but did not address the possibility of gene-specific changes. In particular, do all genes experience changes in purifying selection due to a genome-wide trend, or are there additional gene-specific changes in the intensity of purifying selection? And if so, how frequent or large are the gene-specific changes?
A simple approach to addressing these questions might be to estimate the intensity of purifying selection on each gene in two populations and examine their correlation across the genome. Figure 2A shows the scatter plot of such a comparison, for the estimates of f based on SNPs fixed in the European population of S. cerevisiae and the European population of S. paradoxus. Two observations emerge from this comparison: First, the correlation is significant, but is very low (Spearman's ρ = 0.24, one-tailed P-value < 10−23). Second, the per-gene estimates of f seem to be both biased and noisy, as indicated by the fact that the average of the estimates across genes is substantially higher than the genome-wide estimate obtained from collating all genes, and that many per-gene estimates exceed 1 (the highest possible value of the underlying parameter).
Figure 2.

Correlations between per-gene estimates of fϕ in two populations. (A) The estimates of fϕ for each gene in the European samples of S. cerevisiae and S. paradoxus. The dashed lines mark the range of possible values of the parameters. (B) A similar scatter plot generated by simulation, under a model where f for each gene is identical in the two populations.
The imprecision and bias of per-gene f estimates are to be expected. The observed numbers of synonymous and nonsynonymous SNPs in a gene are small and are expected to be highly variable due to the randomness of the mutation and coalescence processes across loci (Hudson 1990). Moreover, because the count of synonymous SNPs appears in the denominator of the estimator, this randomness should generate an upward bias (Smith and Eyre-Walker 2002). These considerations suggest that much of the variability in the scatter plot is introduced by noise in the estimates, and therefore, that the underlying correlation among genes in the two populations may, in fact, be much greater than suggested. Indeed, when we simulated polymorphism datasets that mimicked the observed one, but assuming that each gene has an identical intensity of purifying selection in the two populations (Fig. 2B; see the model below), we found similarly low correlations between the estimates in the two populations (average Spearman's ρ = 0.26, central 95th percentiles [0.22, 0.30] obtained in 1000 replicates of the datasets). Thus, in order to learn about changes in the intensity of purifying selection among genes, one must account for the stochasticity of the processes leading to counts of the SNPs.
To this end, we moved to inference. Because we are interested in studying changes in purifying selection between populations rather than its characteristics in a single population, we used the simplest model for purifying selection on a gene and reserved most of the parameters (i.e., the complexity) of the model to describing changes in it. Specifically, we followed the Neutral theory in assuming that nonsynonymous mutations are either strongly deleterious or strictly neutral. In the context of the model, f therefore denotes the neutral fraction of amino acid mutations in a gene.
Our model relates the counts of synonymous and nonsynonymous polymorphisms observed across genes in two populations to the genome-wide and gene-specific changes in the intensity of purifying selection between these populations (Fig. 3; see Methods). We started with a univariate distribution of f across genes (Fig. 3A). Given an f for a gene, we introduced a stochastic change to this value in each of the populations independently. This gene-specific change is realized through the application of a stochastic transformation to the univariate distribution, once for each population, resulting in a bivariate distribution of f (Fig. 3B). The genome-wide changes were then incorporated through a deterministic transformation that shifts the f values across all genes in one of the populations either upward or downward (Fig. 3C). The magnitudes of both gene-specific and genome-wide changes at any given gene depend on the value of f before the transformations, allowing for a dependency between the intensity of purifying selection on a gene and the extent to which it changes (Fig. 3D,E). The resulting bivariate distribution reflects the underlying intensity of purifying selection in the two populations.
Figure 3.

Our model for shifts between two populations in the intensity of purifying selection on a gene. See text for details. Subindices 1 and 2 refer to population 1 and 2, respectively. S(f) denotes the stochastic transformation and D(f) the deterministic transformation. Dark gray represents the central 50th percentiles of the probability mass, and light gray represents the central 95th percentiles. The arrows in D and E represent the values of f before and after the transformation.
To relate this distribution to the observed counts of polymorphisms, we needed to specify the distribution of neutral diversity levels, θ, across genes in the two populations. We described it by a bivariate distribution, which allows for a difference in the mean and variance of θ between populations (due, for example, to a difference in the effective population size) and for a correlation among homologous genes in the two populations (e.g., accounting for similarity in mutation rates and other locus-specific influences such as background selection [Charlesworth et al. 1993]) (Fig. 3F). We then obtained the probabilities of observing a given synonymous count at a gene (Fig. 3G) by assuming that the number of neutral mutations in a sample follows a Poisson distribution, the parameter of which depends on the sample size and θ (Hudson 1990) and for nonsynonymous sites, on the sample size, θ and f.
For each pair of populations that we compared, we estimated the 12 parameters of the model by maximum likelihood (ML). We summarized the results of each comparison in terms of estimates of three quantities of interest. (1) The genome-wide f in the two populations. (2) The difference between these values then reflects the genome-wide change (although the model for the genome-wide change includes additional parameters, which describe how the systematic change depends on f at a gene, we chose to focus on this simple summary, as it is readily comparable to the results of the previous section). (3) A summary, denoted R, that captures the correlation between the per-gene intensities of purifying selection in the two populations; it is the correlation coefficient between the underlying distributions of f in the two populations, before the application of the deterministic transformation (Fig. 3B; Methods). A value of 1 reflects a perfect correlation between per-gene f values, while a lower value of R indicates a greater effect of gene-specific changes between the populations.
We first applied the ML estimation to analyze changes in the intensity of purifying selection between populations in different species. To this end, we used only fixed SNPs, because per-gene counts of SNPs segregating within a population sample were too small to allow for reliable estimation (data not shown). The ML-estimates of the genome-wide f are very similar to those that we estimated more simply above using the concatenation of genes. This is to be expected as, given the large number of genes analyzed, precise estimation of the genome-wide average does not require the application of a likelihood framework. However, the concordance of the two approaches is reassuring, as it suggests that the model describes the data appropriately.
To further evaluate whether the model is reasonable, we performed a goodness-of-fit test on 10 summaries of the data. Results are shown in Figure 4 for the model describing changes between the European samples of S. cerevisiae and S. paradoxus. As can be seen, the model provides an adequate fit to the statistics examined. Similar results were obtained for the other comparisons (Supplemental Table 2).
Figure 4.

Testing the fit of the model for the European populations of S. cerevisiae and S. paradoxus. We compared five summaries of the distribution of observed synonymous polymorphism levels, pS, and nonsynonymous polymorphism levels, pN, to what is expected under the model with the ML-parameter estimates (based on 1000 simulated data sets; gray lines are the observed; black bars are the histogram of simulated values). Shown are results for the mean and standard deviation in each population as well as the correlation between the two populations; below each histogram are the P-values associated with the observed values. Similar fits were obtained for the other pairs of populations (Supplemental Table 2).
Given the reasonable fit of the model, we turned to estimates of the extent of gene-specific changes in the intensity of purifying selection between populations (Fig. 5A). In the comparison between the European populations of S. cerevisiae and S. paradoxus, we estimated a correlation, R, of 0.92 between the underlying f values (with a central 80th percentiles [0.82, 0.98]), suggesting few gene-specific changes in purifying selection between the two populations. We arrived at similar findings based on all of the possible comparisons between the European, Malaysian, or North American populations of S. cerevisiae and the European or North American populations of S. paradoxus (Fig. 5A). This conclusion differs markedly from the one reached on the basis of the correlation between the naïve per-gene estimates of f in the two populations (Fig. 2), underscoring how important it is to account for the stochasticity in the processes underlying such data. Taken together, our results suggest that, for most of the populations, there is little evidence for substantial gene-specific changes in the intensity of purifying selection. Strikingly, however, we found markedly lower correlations when we compared the sake population sample of S. cerevisiae with both the European ( , central 80th percentiles [0.49, 0.77]) and the North American (
 , central 80th percentiles [0.53, 0.76]) populations of S. paradoxus. These findings suggest that the sake population is an outlier, in having experienced more substantial gene-specific changes in the intensity of purifying selection than the other populations.
Figure 5.

Correlation between the intensity of purifying selection on a gene in different populations between species (A) and within species (B). The number of gray squares represents the sample size in each population. (A) The estimated correlation coefficient in the comparison between population samples from S. cerevisiae and S. paradoxus. The gray arrows point to the sister population that was used to call SNPs as fixed (see Methods). (B) The estimated correlation coefficient based on fixed SNPs between two populations, X and Y, and fixed SNPs between the common ancestor of these populations and a third population, Z, from the same species. See text for further details. The central 80th percentiles of the correlation coefficient (in gray) were estimated by parametric bootstrap (with 100 replicates).
Next, we applied the likelihood estimation to populations within the same species. In these comparisons, it is problematic to use an outgroup to infer the derived allele, as errors induce spurious correlations between the polymorphism levels of different populations, which, in turn, lead to an overestimation of the correlation R (data not shown). To circumvent this problem, we used SNPs fixed between two populations, X and Y, without inferring their derived state, and compared them with SNPs fixed for the same allele in these two populations, but fixed for another allele in a third outgroup population, Z (Fig. 5B). Assuming a fixed tree along the genome, the first set of SNPs can be viewed as alleles that fixed on the branches between the common ancestor of X and Y and the extant X or Y populations, while the second set is composed of alleles that fixed on the branch between the common ancestor of lineages in X and Y and lineages in population Z; the idea being that if population X or Y experienced substantial gene-specific changes in purifying selection relative to population Z (or vice versa), this should result in a low correlation between the underlying f values.
We estimated the correlation for two interspecies comparisons (Fig. 5B). In S. paradoxus, we took the Far Eastern and European populations as X and Y and the North American population as Z. We found  (central 80th percentiles [0.92, 0.99]), which is consistent with the results of the intraspecies comparisons and suggests few gene-specific changes in purifying selection between these populations. In S. cerevisiae, we took the sake and North American populations as X and Y and the European population as Z. Here, in contrast, we found a markedly lower correlation
  (central 80th percentiles [0.49, 0.76]). This lends further support to our findings based on intraspecies comparisons, again suggesting that the sake population has experienced substantial gene-specific changes in the intensity of purifying selection.
Discussion
Our goal was to study how the intensity of purifying selection varies between populations and species by taking advantage of a recent, genome-wide polymorphism data set in two closely related species, S. cerevisiae and S. paradoxus. Previous analyses of these data (Liti et al. 2009) as well as our own follow-up analysis (Supplemental Methods) suggest that there are several populations within each species and that the vast majority of SNPs in our sample are private to one of them. We therefore heeded this population structure in subsequent analyses. Doing so, we found that in accordance with the Nearly Neutral theory, the genome-wide ratio of nonsynonymous to synonymous polymorphism levels decreases as polymorphisms of increasingly higher frequency are considered. Also consistent with this theory, we found that genome-wide measures of the intensity of purifying selection increase nearly monotonically with proxies of the effective population sizes. These findings suggest that demographic factors, such as changes in the effective population size, have a marked genome-wide effect on the intensity of purifying selection both within and between these species. To tease apart the contribution of such genome-wide shifts and gene-specific changes, we developed a model-based approach and estimated parameters of the model using maximum likelihood. Our inference suggested that most populations of yeast experienced relatively few gene-specific changes, with most differences reflecting genome-wide trends. The notable exception was the sake-derived sample of S. cerevisiae, which seems to have undergone extensive gene-specific changes in comparison to other populations in its own species and to S. paradoxus.
The high level of gene-specific changes in the sake-derived strains is intriguing. One hypothesis is that the domestication of the sake population involved dramatic changes in the environmental conditions of the strains, relaxing selective pressures on specific pathways associated with the conditions experienced in the wild and leading to a number of gene-specific changes, while imposing strong constraints on new and possibly more narrowly defined functions. However, this hypothesis raises the question of why we did not find a similar pattern in the European sample that has also experienced recent domestication, likely independently from that of the sake population (Fay and Benavides 2005; Legras et al. 2007). In this respect, it is interesting to consider recent results by Kvitek et al. (2008). This study examined the response of S. cerevisiae isolates from European vineyards, commercial sake production, and wild strains from diverse environments to a range of stresses. The sake-derived strains varied greatly in their growth rate in response to different stresses, being extremely resilient to a subset and highly sensitive to others, while, in contrast, the vineyard strains grew moderately well in most of the environments examined (Kvitek et al. 2008). These results are broadly consistent with relaxed selection on specific pathways in the sake population, with less of a dramatic change in the nature of purifying selection acting on the vineyard population. We caution, however, that the sake-derived sample is unusual in harboring a large fraction of polymorphisms that appear fixed, likely due to the combination of a small sample size and close relatedness to the North American population. Although this property is unlikely to account for our finding, the question of the selective pressures acting on sake would best be pursued by collecting a larger population sample.
Limitations of the current model
While the qualitative conclusion that there are more gene-specific changes in the sake-derived isolates is well supported statistically, estimates of the extent of gene-specific changes need to be taken with a grain of salt. For one, we focused only on genes conserved enough between species to be aligned accurately. Given that genes for which reliable alignments were not found tend to be more divergent, this likely leads to an underestimate of the extent of gene-specific change. On the other hand, differences between the true systematic change and the form allowed in our model will tend to inflate the estimate of the stochastic component, leading us to overestimate gene-specific changes. We might also overestimate the gene-specific changes because we reduced the DMEs in a protein to the fraction of amino acid mutations that are neutral. For example, if two genes have different DMEs, but happen to have a similar value of f for a given Ne, they will have different values of f at another Ne, even when there has not been a change in the relative importance of these genes to the organism. Finally, even if all gene-specific changes are induced by shifts in specific selective pressures, we may have misspecified the form of such changes. For example, a more realistic description might be a bimodal distribution, where some sets of genes become immaterial to the organism, while the importance of others remains unchanged. The last three limitations stem from simplifying modeling assumptions that we made in an attempt at a reasonable compromise between computational complexity, statistical power, and model flexibility, but could be overcome by extending the model.
Implications for the study of adaptive evolution
Independent of our model and its potential limitations, we found that the genome-wide intensity of purifying selection varies extensively among populations and increases with proxies for the effective population size. These results likely reflect a substantial class of weakly deleterious amino acid mutations in both yeast species (as also found by Connallon and Knowles 2007; Doniger et al. 2008; Liti et al. 2009), such that differences in the effective size of populations can lead to substantial changes in the intensity of purifying selection among them. Importantly, this implies that plausible demographic processes can cause marked changes in the intensity of purifying selection over a relatively short evolutionary time span. That such variation in intensity across structured populations and over time is probable is an important finding in its own right and carries profound implications for widely used tests for adaptive evolution.
Indeed, the McDonald-Kreitman test and its extensions (McDonald and Kreitman 1991; Bierne and Eyre-Walker 2004; Welch 2006) rely on estimates of f based on polymorphism in one species to predict ω between that species and a closely related one in the absence of adaptive evolution. A value of ω significantly over that of f is interpreted as evidence for adaptive evolution (as adaptive mutations should contribute much more to divergence than to polymorphism) (McDonald and Kreitman 1991). Similarly, the values of f and ω can be used jointly to estimate the fraction of advantageous amino acid fixations (Sawyer and Hartl 1992; Charlesworth 1994; Eyre-Walker 2006; Sella et al. 2009). Both the test of neutrality and the estimation procedure implicitly assume that f, which reflects polymorphism patterns that have accumulated in the past ∼4Ne generations, is a good proxy for the intensity of purifying selection over the longer evolutionary time in which the divergence between species has accumulated (McDonald and Kreitman 1991; Fay et al. 2001; Eyre-Walker 2002; Williamson et al. 2005; Welch 2006). That the violation of this assumption would undermine the interpretation of the test was already noted in the original study (McDonald and Kreitman 1991) and was elaborated on by Ohta (1993) shortly afterward; similarly, that it may bias estimates of the fraction of beneficial amino acid fixations was pointed out by a number of other investigators (e.g., Eyre-Walker 2002). The possibility that f may change among populations or across time was also clear, although the extent of the problem was hard to quantify because of the dependence on the largely unknown DMEs. Our findings suggest that, in yeast at least, and in other species in which weakly deleterious mutations contribute substantially to amino acid variation, it may be a serious concern. For example, Figure 1B indicates that an order of magnitude change in the effective size of populations during divergence (as seems plausible, e.g., Chen and Li 2001; Piganeau and Eyre-Walker 2009) could cause am approximately twofold change in the genome-wide f. Importantly, such a change would be enough to account for the high rates of adaptive amino acid evolution estimated, for example, in Drosophila (Eyre-Walker 2006; Sella et al. 2009), even in the absence of any actual adaptation.
Our findings also raise a second issue concerning the implementation of McDonald-Kreitman-based methodologies: If f varies extensively among populations from the same species, such that the outcome of tests strongly depends on the population sample used to measure polymorphism levels, what is the optimal choice, if there is one (see Wakeley 2003 for treatment of a related problem in a specific model of population structure)? Previous studies that applied the McDonald-Kreitman test to yeast data ignored the population structure. For example, Doniger et al. (2008) used polymorphism data from three strains of S. cerevisiae of diverse origins (lab, vineyard, and Oak tree strains) and divergence data between S. cerevisiae and S. paradoxus, finding essentially no genes with evidence of adaptive evolution. In turn, Liti et al. 2009 studied the same data set as examined here, but using polymorphism data from all of the S. cerevisiae strains. After excluding rare SNPs, they again found no genes with evidence of adaptive evolution after correcting for multiple testing.
To illustrate how the choice of population sample could affect the outcome of McDonald-Kreitman tests in more detail, we performed an analysis of protein-coding genes along the S. paradoxus lineage. Divergence along the lineage leading to S. paradoxus from its common ancestor with S. cerevisiae was estimated using S. mikitae as an outgroup, and polymorphism levels were measured in two different ways: (1) using all of the strains within the species, i.e., ignoring the population structure, and (2) using only SNPs that are segregating within the well-defined European population (for which the sample size is largest). We down-sampled the sample from the whole species to control for differences in sample size (see Methods) and excluded singletons (following Bierne and Eyre-Walker 2004; Proschel et al. 2006). We then calculated the one-tailed P-values testing the null hypothesis of neutrality (i.e., ω = f) for each gene. If the null hypothesis were valid, we would expect the distribution of P-values to be approximately uniform (Schweder and Spjotvoll 1982). Figure 6 shows the two distributions that we obtained, based on the different sampling strategies. Visual inspection of these histograms leads to two observations. First, in both distributions, the density increases toward 1, suggesting that weakly deleterious mutations make a major contribution to the nonsynonymous polymorphism in many, if not all of the genes. This is consistent with our findings and those of others (Doniger et al. 2008; Liti et al. 2009), confirming that slightly deleterious mutations can mask the signal of adaptations in McDonald-Kreitman tests and cause a substantial underestimate of the number of genes experiencing adaptive evolution (Charlesworth 1996; Templeton 1996; Fay et al. 2001). Second, in the European population sample, there is no evidence for a mass near 0 (i.e., no low P-values indicative of positive selection). In contrast, the distribution based on the entire population sample has an excess of P-values near 0 (dashed rectangle in Fig. 6B), suggesting the existence of genes that have experienced positive selection. Using different methods, we estimated the number to be between 25 and 35 out of the 1727 genes examined (see Methods).
Figure 6.

Histograms of P-values across 1727 genes obtained for the McDonald-Kreitman test based on SNP data in S. paradoxus, using two different sampling strategies. P-values for each gene were classified into 20 bins of width 0.05, and smoothed using LOWESS (Cleveland and Devlin 1988). Note that we used a different scale on the y-axes of the two histograms. While near 0, no excess of P-values is observed using SNPs segregating in the European sample (A), such an excess (highlighted by the dashed rectangle) is observed using SNPs from the entire population sample (B). This excess provides evidence for the existence of genes that experienced adaptive evolution, and allows us to estimate a lower bound on their number.
These findings can be explained as follows. In S. paradoxus, the genome-wide estimate of ω is greater than measures of f based on SNPs fixed in the European and Far Eastern samples and only slightly smaller than measures of f based on SNPs fixed in the North American—two classes that together comprise more than 60% of the SNPs in the whole population sample—while ω is much smaller than measures of f based on SNPs from all other segregating and fixed classes (Supplemental Table 1). These observations explain both why there are no genes with evidence of positive selection when SNPs segregating in the European sample are considered, as well as why a number of genes do show such evidence when the entire population sample is used. Since measures of f based on the whole population sample better mask the contribution of weakly deleterious mutations, one might argue that this choice is preferable when the goal is to estimate the number of genes that experienced positive selection. While this happens to be the choice made in previous yeast studies (Doniger et al. 2008; Liti et al. 2009), it is important to note that our conclusion is highly dependent on the specific sampling scheme and thus will not hold generally.
Conclusions
Our study is only a first step in exploring the evolution of purifying selection among populations and species and its implications for the study of adaptive evolution. In this respect, our understanding would greatly benefit from examining closely related species in other taxa, which should be possible in the near future as genome-wide polymorphism datasets in many species become readily available (e.g., in humans [http://www.1000genomes.org] and Drosophila [http://www.dpgp.org]). One can then examine whether the intensity of purifying selection is similarly affected by changes in the effective population size, in turn informing us about the distribution of mutational fitness effects in different taxa. One can also inquire whether the paucity of gene-specific changes in the intensity of purifying selection is specific to yeast or holds for other taxa as well.
It may also be worthwhile to explore extensions to the model that we used to tease apart genome-wide and gene-specific changes. We noted a number of potential limitations stemming from simplifying assumptions of the current implementation, which could be further explored. For example, it would be interesting to examine whether other forms for gene-specific changes might better fit the data, and to incorporate more complex distributions of mutational fitness effects. Another promising direction would be to explore the functional basis for changes in the intensity of purifying selection. Yeast is a particularly appropriate taxon in this regard, as a wealth of functional data exists, notably for S. cerevisiae (http://www.yeastgenome.org) (Drummond et al. 2006; Kvitek et al. 2008; Zhu et al. 2008), with more forthcoming. Thus, one could ask how the average intensity of purifying selection varies among broad functional classes (as done with divergence data [Fraser and Hirsh 2004; Wall et al. 2005; Drummond et al. 2006]) or whether changes in the intensity of purifying selection between populations differ among classes. One might also extend our model by incorporating parameters for the functional characteristics of a gene in order to gain a better understanding of how changes in purifying selection relate to gene function. It would be interesting to see, for example, whether genes that show shifts in the intensity of purifying selection in the sake-derived strains stand out in functional assays such as those of Kvitek et al. (2008).
Methods
The data set
We used the genome-wide resequencing data set of 34 aligned strains of S. cerevisiae and 38 aligned strains of S. paradoxus that were generated by the Saccharomyces Genome Resequencing Project (SGRP) (http://www.sanger.ac.uk/research/projects/genomeinformatics/sgrp.html). These data were collected by a combination of ABI and Illumina GA (Solexa) sequencing. To avoid the problems of integrating data collected using different technologies, we focused on ABI-sequenced reads and considered only the raw (nonimputed) data. This resulted in the exclusion of four S. cerevisiae strains and eight S. paradoxus strains. We also excluded 14 S. cerevisiae and six S. paradoxus strains with unclear demographic origin (Liti et al. 2009; Supplemental Methods).
We focused exclusively on protein-coding regions, using the alignments of 4125 genes between S. cerevisiae and S. paradoxus strains obtained by Kellis et al. (2003), based on both synteny and nucleotide-level alignments. To reduce biases caused by the unusual behavior of small groups of genes, we filtered out mitochondrial genes (31), genes containing introns (296), genes with extremely high codon-usage bias (175, CAI > 0.5; Supplemental Methods), and genes that appear to have introgressed from another yeast species (14) (Liti et al. 2006). This procedure left us with 3037 genes out of 6610 identified in S. cerevisiae (http://www.yeastgenome.org).
To minimize the effects of sequencing errors that arise from low read coverage, we applied two filters to the sequence data. First, we used only nucleotides that were classified as high quality by Liti et al. (2009). Second, we classified an ORF in a given strain as invalid if it contained internal stop codons, indels, or clusters of dense SNPs, as these are likely to reflect sequencing or alignment problems (Supplemental Methods). We then analyzed valid nucleotides in valid ORFs.
Estimating levels of synonymous and nonsynonymous polymorphism and divergence
Given that we classified SNPs as synonymous and nonsynonymous, we included in our analysis only biallelic polymorphic codons, in which the two alleles were separated by a single mutation (thereby removing <0.2% of the observed SNPs). The partition of strains into populations, based on the demographic analysis of Liti et al. (2009), induced a further classification of the SNPs in our sample. Specifically, we classified them as segregating in a population if they were found segregating within the sample from that population. They were classified as fixed in a population if the sample from that population was fixed for one allele, whereas the sample from a second population was fixed for an alternative allele, and a comparison with an outgroup suggested that the former was derived. The list of populations and the second population to which they were compared is as follows: In S. cerevisiae, European vs. Malaysian, West African vs. Malaysian, Sake vs. North American, Malaysian vs. European, North American vs. Malaysian; in S. paradoxus, Far Eastern vs. European, North American vs. European, and European vs. Far Eastern for the genome-wide estimates and vs. North American for the likelihood analysis (due to statistical power considerations). The derived states of SNPs were inferred using the reference genome for the European population of the other species as an outgroup (see Supplemental Methods for the construction of these reference genomes). In the few cases where the outgroup genome did not resolve which allele was derived (∼8%), either because it had a third allele at that codon or because it was not covered in the sequencing, the SNPs were excluded from the analyses (with the exception of the interspecies likelihood analyses that did not require this information).
To obtain measures of synonymous and nonsynonymous polymorphism, we calculated the number of synonymous and nonsynonymous sites by applying the yn00 model from PAML with default parameters (Yang 1997; Yang and Nielsen 2000) to the reference genomes of the two species constructed by the SGRP (using the European reference genomes yielded similar results). We also used this software to estimate the synonymous and nonsynonymous divergence along the lineages leading from the common ancestor of S. cerevisiae and S. paradoxus to each of these species, using the sequenced genome of S. mikitae as an outgroup (Kellis et al. 2003).
Assessing the significance of the relationship between f and Ne
Our goal was to use simulations in order to assess how often a relationship as strong as or stronger than observed is obtained under a model in which f does not depend on the effective population size. As a first step, we inferred the distribution of θ (i.e., the probability of observing a SNP at a neutral site with sample size two) across genes in each of the populations, as well as the distribution of f across genes, assuming that it is identical in all populations. To that end, we assumed a gamma distribution of θ values across genes in each of the populations, i.e., that θj ∼ Γ(αj, βj), where j = 1,…,6. We also took a gamma distribution of f values across genes, shared by all populations, such that f ∼ Γ(αf, βf). We further assumed that the number of synonymous SNPs observed at a gene follows a Poisson distribution,  ∼ Poisson(cji ·
  · θji) and that the number of nonsynonymous SNPs follows a Poisson distribution
  ∼ Poisson(cji ·
  · fi · θji) that is independent of the number of synonymous SNPs, where and denote the numbers of synonymous and nonsynonymous sites in gene i for which we have polymorphism data in population j, and cji is Watterson's correction for the sample size at gene i in population j (cf. Ewens 1979).
For population j, the parameters of the θ distribution were estimated by maximizing the likelihood of the observed counts of synonymous SNPs, , across genes i = 1,…,G, i.e., by maximizing
In turn, we estimated the parameters of the f distribution by maximizing the likelihood:
 |
Note that we made the simplifying assumption that the f values for a given gene are drawn independently in different populations. For further discussion of these modeling assumptions, see the section on the model for shifts in the intensity of purifying selection.
Based on the inferred distributions of θ and f and the Poisson sampling model, we simulated 1000 datasets of synonymous and nonsynonymous SNPs across genes in the six populations. The datasets were generated to mimic the observed samples, except for a conservative assumption that our sample size equals two across genes and populations. For each data set, we then generated a graph similar to Figure 1B (using the same dS estimates as in the original graph). Using the slope of the least square fit as a test statistic, we found a mean of −0.17, a lower 5 percentile of −2.5, and a minimum of −7.3, whereas the value for the observed data was −47.5. In other words, the probability of a relationship this steep or steeper is likely much smaller than 10−3 under a model with no relationship between f and the effective population size.
Inferring the distribution of deleterious selection coefficients based on the relationship between f and Ne
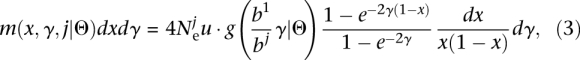
We assumed that all of the populations share the same distribution of amino acid mutational selective effects (DME) and that the differences in f among them result from changes in Ne alone. We further assumed that the effective size of population j, Nej, is proportional to our proxy  . We formalized these assumptions by writing the distribution of scaled selection coefficients g(γ) in terms of the first population, where γ = Ne1s, and the distribution for population j as
  , where γ = 2Nejs. To indicate that these distributions are members of a parametric family with a set of parameters Θ, we use the notation g (γ|Θ). In order to relate f in the different populations with the DME, we used the Poisson random field model (Sawyer and Hartl 1992). In this model, the density of mutant alleles with a scaled selection coefficient γ that are at population frequency x is given by
 |
where u(γ) is the rate at which mutations with coefficient γ arise. From this expression, we obtained the density of mutant alleles with a scaled selection coefficient γ and population frequency x
 |
where u denotes the overall mutation rate. The expected f as a function of bj is then given by:
 |
We considered four parametric families of DMEs: a gamma, a gamma with a point mass at γ = 0, a gamma with a point mass at γ = −∞, and a gamma with two point masses at γ = 0 and −∞. The parameters for these distributions were estimated by weighted nonlinear least squares fit of fΘ(bj) to the points in Figure 1B, where the points were weighted by their estimated variance on the y-axis. (For the distributions with point masses, we took the appropriate limits of Equation 4). For the gamma distribution, we obtained shape and scale parameters of 0.63 and 30, respectively; for the gamma with a point mass at γ = 0, we obtained shape and scale parameters of 0.96 and 30, respectively, with 12.6% of the probability mass at γ = 0; for the gamma with a point mass at γ = −∞, we obtained shape and scale parameters of 0.355 and 30, respectively, with 41% of the probability mass at γ = −∞; and for gamma with two point masses at γ = 0 and −∞, the fit was the same as that with the point mass at γ = −∞ (i.e., no mass at γ = 0). The fit provided by these distributions is shown in Supplemental Figure 4A.
The model for shifts in the intensity of purifying selection between populations
We developed a model that relates changes in the intensity of purifying selection between two populations to the numbers of synonymous and nonsynonymous polymorphic sites in samples from these populations (Fig. 3). Previous studies (notably Loewe and Charlesworth 2006; Loewe et al. 2006) have used the distribution of selection coefficients of new mutations to model changes in the genome-wide intensity of purifying selection. While these methods relied on an explicit “biological” model, they are forced to make strong assumptions. For example, they assumed that all changes in the efficacy of selection are genome-wide, thereby ignoring the possibility of gene-specific changes. For our purposes, we instead chose a descriptive model with relatively few parameters (see further discussion in the main text).
Specifically, the intensities of purifying selection were described in terms of a distribution over genes of the fractions of neutral amino acid mutations in the two populations. We began from a univariate gamma distribution of neutral fractions f ∼ Γ(μ, σ2) (Fig. 3A), which is defined in terms of the expectation μ and variance σ2 rather than the shape and scale parameters. The family of gamma distributions was chosen because of its flexibility and its ability to provide a good fit to the distribution of f estimates (data not shown). We note that although f is restricted to [0,1] and the gamma distribution has an infinite tail, this tail has negligible weight in the range of parameters that we investigated, and could therefore be ignored.
To account for gene-specific changes in the intensity of purifying selection between the two populations, we introduced a stochastic transformation, S, that operates on the univariate distribution of f (Fig. 3D). To each value, f, this stochastic transformation associates Beta-distributed values f′ = S(f) such that f′|f ∼ Beta(a, b), where the shape and scale parameters a and b are determined by the following requirements:
- The first two moments of the conditional distribution are linear functions of f, i.e.,
This allows for the changes in the intensity of purifying selection in a gene to depend on the intensity of selection that the gene experienced before the transformation.
- The first two moments of the entire distribution of f remain invariant under the stochastic transformation, i.e.,
This minimizes the change that the stochastic transformation causes to the overall distribution of f, approximating a model where the gene-specific changes do not alter the overall characteristics of purifying selection in the genome, which are assumed to be in a steady state. From these requirements, it follows that the expectation of the conditional distribution takes the form E(f′|f) = μ + e1 · (f − μ), where e1 = (σ2 − v0 − v1 · μ)1/2/σ, thus reducing the number of free parameters to two, v0, and v1. These relationships have an intuitive interpretation: To maintain the invariance of the second moment in f, the stochastic transformation has to offset the dispersion that it causes by pushing f values toward the mean.
Given f, we took two conditionally independent copies of this two-parameter stochastic transformation, S(f), in order to obtain a bivariate distribution of neutral fractions in the two populations (Fig. 3B). Denoting these two copies as (f′, f2), their joint distribution is given by:
where g stands for the probability density function of the indicated variable.
To introduce genome-wide, systematic differences in the intensity of purifying selection between populations, we then introduced a deterministic transformation, D (Fig. 3E). The deterministic transformation was modeled as a quadratic, with three parameters, D(f) = D0 + D1f + D2f 2 truncated to [0,1], a form that allows the degree of change to depend on the intensity of purifying selection before the genome-wide change. We applied the deterministic transformation to the distribution of f values in one population, which yields f1 = D(f′) = D[S(f)] and f2 = S(f) (Fig. 3C). Overall, the distribution of neutral fractions in the two populations, (f1, f2), has seven parameters: two for the univariate distribution (μ, σ2), two for the stochastic transformation (v0, v1), and three for the deterministic transformation (D0, D1, D2).
To connect the underlying distribution of intensities of purifying selection at a gene with the observed per-gene counts of synonymous and nonsynonymous SNPs in the two populations, we modeled the probability of observing a synonymous or nonsynonymous SNP. We assumed that each gene is an independently evolving, nonrecombining locus, assumptions that appear reasonable for yeast where most recombination events occur outside of coding regions (Gerton et al. 2000). We then modeled the probabilities of observing a SNP at a neutral site in the two populations, (θ1, θ2), as a bivariate gamma distribution of the form (Fig. 3F):
with the independent random variables Yj ∼ Γ[αj − ρ·(α1 · α2)1/2,1], j = 1, 2 and Y0 ∼ Γ[ρ · (α1 · α2)1/2,1]. The marginals of this bivariate distribution, which represent the θ values in each of the populations, are gamma distributed with shape and scale parameters αj, βj and the correlation coefficient between them is ρ (Schmeiser and Lal 1982). This family of bivariates allows for non-negative correlations in the range [0, min(α1,α2)/(α1 · α2)1/2], which approaches the full non-negative range [0,1] when the marginal distributions have a similar shape parameter. Overall, this family of bivariate distributions has five parameters. The choice of this bivariate family has several advantages. The gamma marginal distributions allow for considerable flexibility in describing the distribution of polymorphism levels per gene in each population and, indeed, this distribution fits the data well (data not shown). (We note that although we denoted the probability of observing a SNP at a neutral site by θ—suggesting that we are considering only SNPs segregating within the population—this parameter is also used to describe the probability of observing fixed SNPs, in which case, it reflects 2Tu, where T is the time to the common ancestor of a lineage from each population.) In turn, the correlation coefficient, ρ, between neutral polymorphism levels in the two populations allows us to account for similarities in the effective population size and mutation rates between orthologous genes (e.g., whether similar chromosomal locations and recombination rates leads to similar effects of background selection [Charlesworth et al. 1993]).
Next, we related the distributions of f and θ to the observed numbers of synonymous and nonsynonymous SNPs, and , at gene i (i = 1,…,G) in population j = 1, 2 through Poisson sampling (Fig. 3G):
 |
where (f1i, f2i) are independently distributed for each gene i according to the distribution of (f1, f2), and denote the number of synonymous and nonsynonymous sites of gene i, for which we have polymorphism data in population j, which we estimated directly for each gene using PAML (Yang 1997; Yang and Nielsen 2000), and cji is Watterson's correction for the sample size at gene i in population j (cf. Ewens 1979). In summary, our 12-parameter model describes the probability of observing the synonymous and nonsynonymous SNP counts at a gene in two populations, as a function of gene-specific (two parameters) and genome-wide (three parameters) changes in the intensity of purifying selection (and of other parameters), and the model can therefore be used as a basis for inference.
Estimating the parameters of the model using maximum-likelihood
To infer the 12 parameters of the model (jointly denoted Θ), we maximized their likelihood given the numbers of synonymous and nonsynonymous SNPs observed at genes in two populations. The likelihood function took the following form:
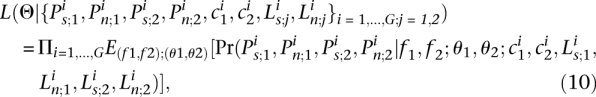 |
where the expectation was taken over the bivariate distributions of f and θ.
We used the standard maximization algorithms from MATLAB Optimization Toolbox to find the parameters that maximize the likelihood function. The evaluation of the likelihood function was performed by numerical integration (as the function has no analytical closed form). To control for unsuccessful runs of the maximization routine, we discarded runs that met at least one of the following conditions:
The MATLAB routine indicated that the maximization has failed.
One of the parameters other then ρ, v0, and v1 was estimated as lying on the boundary of the search space. This criterion was used because the ranges of the search space for these parameters were chosen to be very large, such that their boundary values were highly unlikely.
-
The first moments of the inferred marginal distributions of f and θ deviate by more than 33% from the genome-wide values obtained concatenating all genes. This criterion was used because the maximization generally yielded genome-wide average estimates that were very close to those estimated directly, and the examination of a few cases where this was not the case revealed the estimates to be unreliable.
For each comparison, the reliability of the maximization was assessed by performing parametric bootstrap, then applying the estimation method to 100 simulated datasets in order to verify that the estimates were similar to those obtained from the actual data.
Confidence intervals
We also used parametric bootstrapping in order to obtain confidence intervals. Specifically, we generated 100 datasets under a model with the ML estimates by simulation, applied the likelihood maximization to these simulated datasets, and measured the mean and central 80th percentiles associated with the parameter estimates.
McDonald-Kreitman tests
For each gene, we built 2 × 2 contingency tables of the numbers of synonymous and nonsynonymous substitutions and polymorphisms. The numbers of substitutions along the lineage leading to S. paradoxus from its common ancestor with S. cerevisiae was estimated using the yn00 model with default parameters from PAML (Yang 1997; Yang and Nielsen 2000) and S. mikitae as an outgroup. The numbers of polymorphic sites were measured based on two different population samples: (1) using all of the strains within the species, i.e., ignoring the population structure, and (2) using only SNPs that are segregating within the well-defined European population (the population for which the sample size is largest). To control for the effects of having different sample sizes, we down-sampled the sample from the whole species, such that the number of codons covered to any given sample size equaled that of the European sample. Next, we counted the number of synonymous and nonsynonymous sites segregating in each of the samples, excluding singleton SNPs from the counts (following Bierne and Eyre-Walker 2004; Proschel et al. 2006). We then calculated the P-value for one-tailed Fisher's exact test of the null hypothesis of neutrality (i.e., ω = f).
Estimating the number of genes that have experienced positive selection
Our estimates of a lower bound on the number of genes that experienced adaptive evolution rely on the premise that the genes in our sample represent a mixture of two sets: one that adheres to the assumptions of the nearly neutral theory, and another that experienced adaptive evolution. While the precise form of the distributions of P-values under the McDonald-Kreitman test associated with each set is unknown, we can make some plausible assumptions about them. Given the evidence that we found for pervasive slightly deleterious amino acid mutations, we can assume that, near 0, the “nearly neutral” density of P-values increases with the P-value. The “adaptive” density, in contrast, could exhibit a peak near 0 and is expected to decrease with the P-value to the right of that peak. Thus, if we observe a local minimum near 0 in the density of P-values, we can infer the existence of genes that experienced adaptive evolution. Specifically, if this minimum is obtained at a P-value of p0, where the density is D(p0), then a lower bound on the number of genes that experienced adaptive evolution is given by  . In reality, estimates of this bound may be noisy because of the statistical problems of estimating minima with a finite sample. In estimating p0 and D(p0), we therefore relied on smoothed P-value histograms, which reduce these errors by “borrowing information” from neighboring points. The histogram of P-values was calculated using 20 bins of equal size, followed by two alternative smoothing schemes. In the first, we used LOWESS smoothing with a window size of five bins (Cleveland and Devlin 1988) and estimated that there are 25 genes that experienced adaptive evolution. In the second, we used least-squares to fit a quadratic to the histogram in the range [0,0.25]; by this approach, we found 35 genes to have experienced adaptive evolution. Regardless of which approach is most reliable, our qualitative point—that there is evidence for a subset of genes under adaptive evolution based on one population sample but not the other—is apparent from the histograms in Figure 6.
Acknowledgments
We thank the Saccharomyces Genome Resequencing Project for access to prepublished data and David Carter for help with the dataset. We thank Gil McVean, Dick Hudson, Matthew Stephens, and members of the Sella lab for helpful discussions. This work was funded by an NSF pre-doctoral fellowship to K.B., a Rosalind Franklin Award to M.P, and a Flegg fellowship, Israel Science Foundation grant (no. 1435/07), and NIH grant GM083228 to G.S. M.P. is a Howard Hughes Medical Institute Early Career Scientist.
Footnotes
[Supplemental material is available online at http://www.genome.org.]
Article published online before print. Article and publication date are at http://www.genome.org/cgi/doi/10.1101/gr.108993.110.
References
- Akashi H 2003. Translational selection and yeast proteome evolution. Genetics 164: 1291–1303 [DOI] [PMC free article] [PubMed] [Google Scholar]
- Amos LA, van den Ent F, Lowe J 2004. Structural/functional homology between the bacterial and eukaryotic cytoskeletons. Curr Opin Cell Biol 16: 24–31 [DOI] [PubMed] [Google Scholar]
- Andolfatto P 2005. Adaptive evolution of non-coding DNA in Drosophila. Nature 437: 1149–1152 [DOI] [PubMed] [Google Scholar]
- Bennetzen JL, Hall BD 1982. Codon selection in yeast. J Biol Chem 257: 3026–3031 [PubMed] [Google Scholar]
- Bierne N, Eyre-Walker A 2004. The genomic rate of adaptive amino acid substitution in Drosophila. Mol Biol Evol 21: 1350–1360 [DOI] [PubMed] [Google Scholar]
- Boyko AR, Williamson SH, Indap AR, Degenhardt JD, Hernandez RD, Lohmueller KE, Adams MD, Schmidt S, Sninsky JJ, Sunyaev SR, et al. 2008. Assessing the evolutionary impact of amino acid mutations in the human genome. PLoS Genet 4: e1000083 doi: 10.1371/journal.pgen.1000083 [DOI] [PMC free article] [PubMed] [Google Scholar]
- Bustamante CD, Wakeley J, Sawyer S, Hartl DL 2001. Directional selection and the site-frequency spectrum. Genetics 159: 1779–1788 [DOI] [PMC free article] [PubMed] [Google Scholar]
- Chao L, Carr DE 1993. The molecular clock and the relationship between population-size and generation time. Evolution 47: 688–690 [DOI] [PubMed] [Google Scholar]
- Charlesworth B 1994. The effect of background selection against deleterious mutations on weakly selected, linked variants. Genet Res 63: 213–227 [DOI] [PubMed] [Google Scholar]
- Charlesworth B 1996. Background selection and patterns of genetic diversity in Drosophila melanogaster. Genet Res 68: 131–149 [DOI] [PubMed] [Google Scholar]
- Charlesworth J, Eyre-Walker A 2008. The McDonald-Kreitman test and slightly deleterious mutations. Mol Biol Evol 25: 1007–1015 [DOI] [PubMed] [Google Scholar]
- Charlesworth B, Morgan MT, Charlesworth D 1993. The effect of deleterious mutations on neutral molecular variation. Genetics 134: 1289–1303 [DOI] [PMC free article] [PubMed] [Google Scholar]
- Chen FC, Li WH 2001. Genomic divergences between humans and other hominoids and the effective population size of the common ancestor of humans and chimpanzees. Am J Hum Genet 68: 444–456 [DOI] [PMC free article] [PubMed] [Google Scholar]
- Cleveland WS, Devlin SJ 1988. Locally weighted regression—an approach to regression-analysis by local fitting. J Am Stat Assoc 83: 596–610 [Google Scholar]
- Connallon T, Knowles LL 2007. Recombination rate and protein evolution in yeast. BMC Evol Biol 7: 235 doi: 10.1186/1471-2148-7-235 [DOI] [PMC free article] [PubMed] [Google Scholar]
- Crow JF, Kimura M 1970. An introduction to population genetics theory. Harper & Row, New York [Google Scholar]
- Dermitzakis ET, Reymond A, Lyle R, Scamuffa N, Ucla C, Deutsch S, Stevenson BJ, Flegel V, Bucher P, Jongeneel CV, et al. 2002. Numerous potentially functional but non-genic conserved sequences on human chromosome 21. Nature 420: 578–582 [DOI] [PubMed] [Google Scholar]
- Doniger SW, Kim HS, Swain D, Corcuera D, Williams M, Yang SP, Fay JC 2008. A catalog of neutral and deleterious polymorphism in yeast. PLoS Genet 4: e1000183 doi: 10.1371/journal.pgen.1000183 [DOI] [PMC free article] [PubMed] [Google Scholar]
- Drummond DA, Raval A, Wilke CO 2006. A single determinant dominates the rate of yeast protein evolution. Mol Biol Evol 23: 327–337 [DOI] [PubMed] [Google Scholar]
- Ewens WJ 1979. Mathematical population genetics. Springer-Verlag, Berlin/New York [Google Scholar]
- Eyre-Walker A 2002. Changing effective population size and the McDonald-Kreitman test. Genetics 162: 2017–2024 [DOI] [PMC free article] [PubMed] [Google Scholar]
- Eyre-Walker A 2006. The genomic rate of adaptive evolution. Trends Ecol Evol 21: 569–575 [DOI] [PubMed] [Google Scholar]
- Eyre-Walker A, Keightley PD 2007. The distribution of fitness effects of new mutations. Nat Rev Genet 8: 610–618 [DOI] [PubMed] [Google Scholar]
- Eyre-Walker A, Keightley PD, Smith NG, Gaffney D 2002. Quantifying the slightly deleterious mutation model of molecular evolution. Mol Biol Evol 19: 2142–2149 [DOI] [PubMed] [Google Scholar]
- Eyre-Walker A, Woolfit M, Phelps T 2006. The distribution of fitness effects of new deleterious amino acid mutations in humans. Genetics 173: 891–900 [DOI] [PMC free article] [PubMed] [Google Scholar]
- Falush D, Stephens M, Pritchard JK 2003. Inference of population structure using multilocus genotype data: Linked loci and correlated allele frequencies. Genetics 164: 1567–1587 [DOI] [PMC free article] [PubMed] [Google Scholar]
- Fay JC, Benavides JA 2005. Evidence for domesticated and wild populations of Sacchoromyces cerevisiae. PLoS Genet 1: 66–71 [DOI] [PMC free article] [PubMed] [Google Scholar]
- Fay JC, Wyckoff GJ, Wu CI 2001. Positive and negative selection on the human genome. Genetics 158: 1227–1234 [DOI] [PMC free article] [PubMed] [Google Scholar]
- Fay JC, Wyckoff GJ, Wu CI 2002. Testing the neutral theory of molecular evolution with genomic data from Drosophila. Nature 415: 1024–1026 [DOI] [PubMed] [Google Scholar]
- Foxe JP, Dar VU, Zheng H, Nordborg M, Gaut BS, Wright SI 2008. Selection on amino acid substitutions in Arabidopsis. Mol Biol Evol 25: 1375–1383 [DOI] [PMC free article] [PubMed] [Google Scholar]
- Fraser HB, Hirsh AE 2004. Evolutionary rate depends on number of protein-protein interactions independently of gene expression level. BMC Evol Biol 4: 13 doi: 10.1186/1147-2148-4-13 [DOI] [PMC free article] [PubMed] [Google Scholar]
- Frazer KA, Elnitski L, Church DM, Dubchak I, Hardison RC 2003. Cross-species sequence comparisons: A review of methods and available resources. Genome Res 13: 1–12 [DOI] [PMC free article] [PubMed] [Google Scholar]
- Gerton JL, DeRisi J, Shroff R, Lichten M, Brown PO, Petes TD 2000. Global mapping of meiotic recombination hotspots and coldspots in the yeast Saccharomyces cerevisiae. Proc Natl Acad Sci 97: 11383–11390 [DOI] [PMC free article] [PubMed] [Google Scholar]
- Graur D, Li W-H 2000. Fundamentals of molecular evolution. Sinauer Associates, Sunderland, MA [Google Scholar]
- Haddrill PR, Bachtrog D, Andolfatto P 2008. Positive and negative selection on noncoding DNA in Drosophila simulans. Mol Biol Evol 25: 1825–1834 [DOI] [PMC free article] [PubMed] [Google Scholar]
- Halligan DL, Keightley PD 2006. Ubiquitous selective constraints in the Drosophila genome revealed by a genome-wide interspecies comparison. Genome Res 16: 875–884 [DOI] [PMC free article] [PubMed] [Google Scholar]
- Halligan DL, Eyre-Walker A, Andolfatto P, Keightley PD 2004. Patterns of evolutionary constraints in intronic and intergenic DNA of Drosophila. Genome Res 14: 273–279 [DOI] [PMC free article] [PubMed] [Google Scholar]
- Hudson RR 1990. Gene genealogies and the coalescent process. In Oxford surveys in evolutionary biology, Vol. 1, pp. 1–14 Oxford University Press, Oxford, UK [Google Scholar]
- Huerta-Sanchez E, Durrett R, Bustamante CD 2008. Population genetics of polymorphism and divergence under fluctuating selection. Genetics 178: 325–337 [DOI] [PMC free article] [PubMed] [Google Scholar]
- Keightley PD, Eyre-Walker A 2000. Deleterious mutations and the evolution of sex. Science 290: 331–333 [DOI] [PubMed] [Google Scholar]
- Keightley PD, Eyre-Walker A 2007. Joint inference of the distribution of fitness effects of deleterious mutations and population demography based on nucleotide polymorphism frequencies. Genetics 177: 2251–2261 [DOI] [PMC free article] [PubMed] [Google Scholar]
- Keightley PD, Gaffney DJ 2003. Functional constraints and frequency of deleterious mutations in noncoding DNA of rodents. Proc Natl Acad Sci 100: 13402–13406 [DOI] [PMC free article] [PubMed] [Google Scholar]
- Kellis M, Patterson N, Endrizzi M, Birren B, Lander ES 2003. Sequencing and comparison of yeast species to identify genes and regulatory elements. Nature 423: 241–254 [DOI] [PubMed] [Google Scholar]
- Kimura M 1983. The neutral theory of molecular evolution. Cambridge University Press, Cambridge, New York [Google Scholar]
- Kimura M, Maruyama T 1971. Pattern of neutral polymorphism in a geographically structured population. Genet Res 18: 125–131 [DOI] [PubMed] [Google Scholar]
- Koonin EV 2003. Comparative genomics, minimal gene-sets and the last universal common ancestor. Nat Rev Microbiol 1: 127–136 [DOI] [PubMed] [Google Scholar]
- Koufopanou V, Hughes J, Bell G, Burt A 2006. The spatial scale of genetic differentiation in a model organism: The wild yeast Saccharomyces paradoxus. Philos Trans R Soc B-Biol Sci 361: 1941–1946 [DOI] [PMC free article] [PubMed] [Google Scholar]
- Kvitek DJ, Will JL, Gasch AP 2008. Variations in stress sensitivity and genomic expression in diverse S. cerevisiae isolates. PLoS Genet 4: e1000223 doi: 10.1371/journal.pgen.1000223 [DOI] [PMC free article] [PubMed] [Google Scholar]
- Legras JL, Merdinoglu D, Cornuet JM, Karst F 2007. Bread, beer and wine: Saccharomyces cerevisiae diversity reflects human history. Mol Ecol 16: 2091–2102 [DOI] [PubMed] [Google Scholar]
- Li WH, Tanimura M, Sharp PM 1987. An evaluation of the molecular clock hypothesis using mammalian DNA sequences. J Mol Evol 25: 330–342 [DOI] [PubMed] [Google Scholar]
- Liti G, Barton DB, Louis EJ 2006. Sequence diversity, reproductive isolation and species concepts in Saccharomyces. Genetics 174: 839–850 [DOI] [PMC free article] [PubMed] [Google Scholar]
- Liti G, Carter DM, Moses AM, Warringer J, Parts L, James SA, Davey RP, Roberts IN, Burt A, Koufopanou V, et al. 2009. Population genomics of domestic and wild yeasts. Nature 458: 337–341 [DOI] [PMC free article] [PubMed] [Google Scholar]
- Loewe L, Charlesworth B 2006. Inferring the distribution of mutational effects on fitness in Drosophila. Biol Lett 2: 426–430 [DOI] [PMC free article] [PubMed] [Google Scholar]
- Loewe L, Charlesworth B, Bartolome C, Noel V 2006. Estimating selection on nonsynonymous mutations. Genetics 172: 1079–1092 [DOI] [PMC free article] [PubMed] [Google Scholar]
- Lynch M 2007. The origins of genome architecture Sinauer Associates, Sunderland, MA [Google Scholar]
- McDonald JH, Kreitman M 1991. Adaptive protein evolution at the Adh locus in Drosophila. Nature 351: 652–654 [DOI] [PubMed] [Google Scholar]
- Molina N, van Nimwegen E 2008. Universal patterns of purifying selection at noncoding positions in bacteria. Genome Res 18: 148–160 [DOI] [PMC free article] [PubMed] [Google Scholar]
- Ohta T 1972. Population size and rate of evolution. J Mol Evol 1: 305 doi: 10.1007/BFQ1653959 [PubMed] [Google Scholar]
- Ohta T 1973. Slightly deleterious mutant substitutions in evolution. Nature 246: 96–98 [DOI] [PubMed] [Google Scholar]
- Ohta T 1974. Mutational pressure as main cause of molecular evolution and polymorphism. Nature 252: 351–354 [DOI] [PubMed] [Google Scholar]
- Ohta T 1992. The nearly neutral theory of molecular evolution. Annu Rev Ecol Syst 23: 263–286 [Google Scholar]
- Ohta T 1993. An examination of the generation-time effect on molecular evolution. Proc Natl Acad Sci 90: 10676–10680 [DOI] [PMC free article] [PubMed] [Google Scholar]
- Ohta T, Ina Y 1995. Variation in synonymous substitution rates among mammalian genes and the correlation between synonymous and nonsynonymous divergences. J Mol Evol 41: 717–720 [DOI] [PubMed] [Google Scholar]
- Piganeau G, Eyre-Walker A 2003. Estimating the distribution of fitness effects from DNA sequence data: Implications for the molecular clock. Proc Natl Acad Sci 100: 10335–10340 [DOI] [PMC free article] [PubMed] [Google Scholar]
- Piganeau G, Eyre-Walker A 2009. Evidence for variation in the effective population size of animal mitochondrial DNA. PLoS ONE 4: e4396 doi: 10.1371/journal.pone.0004396 [DOI] [PMC free article] [PubMed] [Google Scholar]
- Pritchard JK, Stephens M, Donnelly P 2000. Inference of population structure using multilocus genotype data. Genetics 155: 945–959 [DOI] [PMC free article] [PubMed] [Google Scholar]
- Proschel M, Zhang Z, Parsch J 2006. Widespread adaptive evolution of Drosophila genes with sex-biased expression. Genetics 174: 893–900 [DOI] [PMC free article] [PubMed] [Google Scholar]
- Qin H, Wu WB, Comeron JM, Kreitman M, Li WH 2004. Intragenic spatial patterns of codon usage bias in prokaryotic and eukaryotic genomes. Genetics 168: 2245–2260 [DOI] [PMC free article] [PubMed] [Google Scholar]
- Sawyer SA, Hartl DL 1992. Population genetics of polymorphism and divergence. Genetics 132: 1161–1176 [DOI] [PMC free article] [PubMed] [Google Scholar]
- Sawyer SA, Dykhuizen DE, Hartl DL 1987. Confidence interval for the number of selectively neutral amino acid polymorphisms. Proc Natl Acad Sci 84: 6225–6228 [DOI] [PMC free article] [PubMed] [Google Scholar]
- Sawyer SA, Kulathinal RJ, Bustamante CD, Hartl DL 2003. Bayesian analysis suggests that most amino acid replacements in Drosophila are driven by positive selection. J Mol Evol 57: S154–S164 [DOI] [PubMed] [Google Scholar]
- Schmeiser BW, Lal R 1982. Bivariate gamma-random vectors. Oper Res 30: 355–374 [Google Scholar]
- Schweder T, Spjotvoll E 1982. Plots of P-values to evaluate many tests simultaneously. Biometrika 69: 493–502 [Google Scholar]
- Sella G, Petrov DA, Przeworski M, Andolfatto P 2009. Pervasive natural selection in the Drosophila genome? PLoS Genet 5: e1000495 doi: 10.1371/journal.pgen.1000495 [DOI] [PMC free article] [PubMed] [Google Scholar]
- Sharp PM, Li WH 1987. The rate of synonymous substitution in enterobacterial genes is inversely related to codon usage bias. Mol Biol Evol 4: 222–230 [DOI] [PubMed] [Google Scholar]
- Sharp PM, Tuohy TM, Mosurski KR 1986. Codon usage in yeast: Cluster analysis clearly differentiates highly and lowly expressed genes. Nucleic Acids Res 14: 5125–5143 [DOI] [PMC free article] [PubMed] [Google Scholar]
- Sharp PM, Cowe E, Higgins DG, Shields DC, Wolfe KH, Wright F 1988. Codon usage patterns in Escherichia coli, Bacillus subtilis, Saccharomyces cerevisiae, Schizosaccharomyces pombe, Drosophila melanogaster and Homo sapiens; a review of the considerable within-species diversity. Nucleic Acids Res 16: 8207–8211 [DOI] [PMC free article] [PubMed] [Google Scholar]
- Siepel A, Bejerano G, Pedersen JS, Hinrichs AS, Hou MM, Rosenbloom K, Clawson H, Spieth J, Hillier LW, Richards S, et al. 2005. Evolutionarily conserved elements in vertebrate, insect, worm, and yeast genomes. Genome Res 15: 1034–1050 [DOI] [PMC free article] [PubMed] [Google Scholar]
- Smith NG, Eyre-Walker A 2002. Adaptive protein evolution in Drosophila. Nature 415: 1022–1024 [DOI] [PubMed] [Google Scholar]
- Snel B, Bork P, Huynen MA 2002. Genomes in flux: The evolution of archaeal and proteobacterial gene content. Genome Res 12: 17–25 [DOI] [PubMed] [Google Scholar]
- Tajima F 1983. Evolutionary relationship of DNA sequences in finite populations. Genetics 105: 437–460 [DOI] [PMC free article] [PubMed] [Google Scholar]
- Templeton AR 1996. Contingency tests of neutrality using intra/interspecific gene trees: The rejection of neutrality for the evolution of the mitochondrial cytochrome oxidase II gene in the hominoid primates. Genetics 144: 1263–1270 [DOI] [PMC free article] [PubMed] [Google Scholar]
- Wakeley J 2003. Polymorphism and divergence for island-model species. Genetics 163: 411–420 [DOI] [PMC free article] [PubMed] [Google Scholar]
- Wall DP, Hirsh AE, Fraser HB, Kumm J, Giaever G, Eisen MB, Feldman MW 2005. Functional genomic analysis of the rates of protein evolution. Proc Natl Acad Sci 102: 5483–5488 [DOI] [PMC free article] [PubMed] [Google Scholar]
- Watterson GA 1975. On the number of segregating sites in genetical models without recombination. Theor Popul Biol 7: 256–276 [DOI] [PubMed] [Google Scholar]
- Welch JJ 2006. Estimating the genomewide rate of adaptive protein evolution in Drosophila. Genetics 173: 821–837 [DOI] [PMC free article] [PubMed] [Google Scholar]
- Williamson S, Fledel-Alon A, Bustamante CD 2004. Population genetics of polymorphism and divergence for diploid selection models with arbitrary dominance. Genetics 168: 463–475 [DOI] [PMC free article] [PubMed] [Google Scholar]
- Williamson SH, Hernandez R, Fledel-Alon A, Zhu L, Nielsen R, Bustamante CD 2005. Simultaneous inference of selection and population growth from patterns of variation in the human genome. Proc Natl Acad Sci 102: 7882–7887 [DOI] [PMC free article] [PubMed] [Google Scholar]
- Woolfe A, Goodson M, Goode DK, Snell P, McEwen GK, Vavouri T, Smith SF, North P, Callaway H, Kelly K, et al. 2005. Highly conserved non-coding sequences are associated with vertebrate development. PLoS Biol 3: 116–130 [DOI] [PMC free article] [PubMed] [Google Scholar]
- Woolfit M 2009. Effective population size and the rate and pattern of nucleotide substitutions. Biol Lett 5: 417–420 [DOI] [PMC free article] [PubMed] [Google Scholar]
- Yang Z 1997. PAML: A program package for phylogenetic analysis by maximum likelihood. Comput Appl Biosci 13: 555–556 [DOI] [PubMed] [Google Scholar]
- Yang Z, Nielsen R 2000. Estimating synonymous and nonsynonymous substitution rates under realistic evolutionary models. Mol Biol Evol 17: 32–43 [DOI] [PubMed] [Google Scholar]
- Zhu J, Zhang B, Smith EN, Drees B, Brem RB, Kruglyak L, Bumgarner RE, Schadt EE 2008. Integrating large-scale functional genomic data to dissect the complexity of yeast regulatory networks. Nat Genet 40: 854–861 [DOI] [PMC free article] [PubMed] [Google Scholar]