

Abstract
The demographic tendency in industrial countries to delay childbearing, coupled with the maternal age effect in common chromosomal aneuploidies and the risk to the fetus of invasive prenatal diagnosis, are potent drivers for the development of strategies for noninvasive prenatal diagnosis. One breakthrough has been the discovery of differentially methylated cell-free fetal DNA in the maternal circulation. We describe novel bisulfite conversion- and methylation-sensitive enzyme digestion DNA methylation-related approaches that we used to diagnose Turner syndrome from first trimester samples. We used an X-linked marker, EF3, and an autosomal marker, RASSF1A, to discriminate between placental and maternal blood cell DNA using real-time methylation-specific PCR after bisulfite conversion and real-time PCR after methylation-sensitive restriction digestion. By normalizing EF3 amplifications versus RASSF1A outputs, we were able to calculate sex chromosome/autosome ratios in chorionic villus samples, thus permitting us to correctly diagnose Turner syndrome. The identification of this new marker coupled with the strategy outlined here may be instrumental in the development of an efficient, noninvasive method of diagnosis of sex chromosome aneuploidies in plasma samples.
Aneuploidies, ie, an abnormal number of chromosomes, are responsible for a range of genetic disorders. The most frequent aneuploidies compatible with life are represented by trisomy 21 causing Down syndrome, trisomy 13 causing Patau syndrome, trisomy 18 causing Edwards syndrome, and sex chromosome aneuploidies.
Sex chromosome aneuploidies include 45,X causing Turner syndrome (1/2500 living females), 47,XXX associated with triple X syndrome (1/1000 live births), 47,XXY associated with Klinefelter syndrome (prevalence 1/500 live males) (for prevalence and incidence data refer to http://www.orpha.net/consor/cgi-bin/index.php, last accessed on March 9, 2010) and the 47,XYY karyotype (the incidence generally reported is 1/1000 live births). Compared to trisomy 21, 13, and 18, sex chromosome aneuploidies show less severe clinical phenotypes, but taken together, the incidence of sex chromosome aneuploidies is high and, in the case of 47,XXX, 47,XXY and 47,XYY, this is largely underestimated. Moreover, although the mortality in utero of fetuses with Turner syndrome is high, most fetuses with other sex chromosome aneuploidies survive to term.1 Major malformations may occur in Turner syndrome, but not in the XXY Klinefelter, XXX and XYY syndromes.2
To date, conventional prenatal diagnosis of genetic disorders has been based on the analysis of fetal cells obtained using invasive procedures such as amniocentesis and chorionic villus sampling (CVS). These techniques are very reliable, but the downside is that both are associated with a small but significant risk of fetal loss, ie, in the order of 0.5 to 1.0% of cases. For this reason, invasive prenatal diagnosis is offered only if the perceived risk of abnormal pregnancy, estimated by maternal age, ultrasonography and other noninvasive methods, exceeds the miscarriage risk.3
Several groups have investigated noninvasive methods of prenatal diagnosis.3 Attempts have been made to isolate fetal nucleated cells from maternal blood4,5,6 but their rarity and the possibility of cells persistent from previous pregnancies have so far made this strategy unreliable.
Recent strategies for noninvasive prenatal diagnosis (NIPD) have been based on the observation in 1948 of the presence of cell free circulating nucleic acid in blood plasma7 and the increase in this plasma DNA in cancer.8,9,10 More recently, Lo et al11 demonstrated the presence of male fetal DNA in maternal plasma, by amplifying Y specific sequences. Moreover, it was found that cell free fetal DNA (cffDNA) in maternal plasma is fragmented12 and the half-life is in the order of 16 minutes after delivery.13 The amount of cffDNA in maternal plasma DNA ranges between approximately 3 to 6% with a mean of 25.4 genome copies/ml of maternal plasma during early pregnancy.14 cffDNA from maternal plasma has been successfully used to determine fetal rhesus D (RhD) blood type,15 for determination of fetal sex,14,16,17 thus limiting the need for invasive diagnosis in cases of sex specific pathologies as well as for the identification of some fetal disorders due to paternal genetic mutations or recessive conditions where parents are compound heterozygotes.18,19 However, the presence of a great excess of free maternal DNA complicates the use of such methods.14
The most important source of cffDNA released in maternal plasma during pregnancy appears to be the placenta,20,21 whereas it has been suggested that the cell free maternal DNA (cfmDNA) originates from hematopoietic cells.22 On the basis of the placental origin of free fetal nucleic acids (cffDNA and cffRNA23) and the finding of a chromosome 21 placenta-specific mRNA marker in maternal plasma,24 an approach based on RNA-SNP allelic ratio has been reported, to detect aneuploidies of this chromosome.24 Recently, Lo and co-workers25 reported the use of digital PCR to determine the over-representation of chromosome 21 in trisomy 21 samples in mixtures of placental and maternal blood cell DNA, using samples containing at least 25% of fetal DNA, a concentration many fold higher than that present in a first trimester maternal plasma sample. A similar strategy, based on microfluidic digital PCR platform has been applied by Fan and co-workers26 in the set-up of diagnosis of chromosome number abnormalities, on amniotic fluid and CVS samples.
Recently, high throughput technologies, such as those based on parallel DNA-sequencing27 are being applied to NIPD strategies. Read depth analysis was used to successfully identify chromosome 13, 18, and 21 aneuploidies of the fetus.28 Chiu and co-workers29 also applied high throughput DNA-sequencing to quantify the amount of unique chromosome 21 sequences from plasma (maternal and fetal), revealing a potential trisomy. However, high throughput DNA-sequencing is still costly and difficult to manage in a routine laboratory, due to the large bioinformatic and computer resources required for analysis. For the foreseeable future, it may be difficult to translate this approach for widespread noninvasive diagnosis of aneuploidies.
Strategies exploiting differential DNA methylation may also be used to discriminate tissues/cells of different origin. DNA methylation, the major post-biosynthetic modification found throughout mammalian genomes, is involved in many important biological phenomena, such as X chromosome inactivation and genomic imprinting, and in controlling tissue-specific expression in adult somatic tissues.30,31,32
Differential DNA methylation between maternal and fetal DNA has been investigated for use in NIPD. Differential methylation between fetal CVS and maternal blood cell DNA was first reported in 200233 and three years later the first universal epigenetic marker of fetal DNA in maternal plasma, SERPINB5 was described. The promoter region of SERPINB5 is hypomethylated in placenta and hypermethylated in maternal blood cells. Fetal SERPINB5 was distinguished from maternal SERPINB5 in maternal plasma DNA34 after bisulfite modification35 and methylation specific PCR.36 Subsequently, the application of bisulfite-independent methods were also reported.37,38
Despite the appeal of using epigenetic differences between maternal and fetal DNA to develop NIPD for aneuploidies, the search for chromosome specific markers is challenging: this is particularly true for X linked sequences. An alternative high-throughput approach for identifying chromosome specific methylated markers is based on immunoprecipitation of methylated DNA (MeDiP39) coupled with high resolution tiling oligonucleotide array analysis. More than 2000 differentially methylated regions between placenta and maternal blood cells, on respectively chromosome 13, 18, 21, X and Y, both in non-genic regions and in the CpG islands have been recently reported using this approach.40
Taking advantage of these latter data, we selected three putative X-linked markers that are differentially methylated between placenta and maternal blood cell DNA, and after further validation we developed a NIPD strategy to determine copy number of fetal sex chromosomes.
Materials and Methods
DNA Samples Collection
Pregnant women with singleton pregnancies were recruited from the Laboratory of Cytogenetics and Prenatal Diagnosis at the University Federico II, Naples, Italy. After informed consent was obtained, placenta and peripheral maternal blood samples were collected from first trimester subjects, recruited among women undergoing chorionic villus sampling for prenatal diagnosis, or third trimester subjects undergoing elective caesarean delivery.
Maternal peripheral blood samples were collected just before the obstetric procedures.
Sample Processing and DNA Extraction
One to two hours after collection, blood samples were centrifuged at 1000 × g for 10 minutes at 4°C. The plasma portion was recovered and recentrifuged at 14,700 × g for 10 minutes at 4°C. DNA from peripheral blood cells was extracted using the Wizard Genomic DNA purification Kit (Promega Corporation, Madison, WI). DNA from third trimester placental tissues was extracted incubating the tissue in lysis solution (100 mmol/L Tris-Hcl pH 8.5, 5 mmol/L EDTA pH 8, 0.2% SDS, 200 mmol/L NaCl, and 0.1 mg/ml proteinase K) at 64°C overnight. After a centrifugation for 1 minute at 12,000 × g the supernatant was precipitated with 1 volume of isopropanol, centrifuged for 1 minute at 12,000 × g and the DNA pellet washed with 70% ethanol, dried and resuspended in TE 1× (10 mmol/L Tris-HCl, 1 mmol/L EDTA ph 8). Ten μg of DNA were incubated with 30 μg of RNase A (Roche, Mannheim, Germany) in a final volume of 30 μl for 1 hour at 37°C, then purified using phenol/chloroform extraction. DNA from first trimester placenta (CVS) was extracted using the Wizard Genomic DNA purification Kit (Promega Corporation). DNA from maternal plasma was extracted with the QIAamp DSP Virus Kit (Qiagen, Hilden, Germany) following the manufacturer's instructions. Starting from 0.5 ml of plasma, the final elution was carried out in 25 μl of elution buffer.
Bisulfite Conversion and Sequencing
One μg of maternal blood cell and placental DNA and 10 μl of plasma DNA were bisulfite-converted using the EpiTect Bisulfite Kit (Qiagen). Samples were eluted in a final volume of 20 μl. One μl of bisulfite-converted first and third trimester maternal blood cell and placenta DNA was amplified using nested PCR carried out on Gradient PCR Express (Hybaid, Middlesex, UK). EF3 marker was amplified using EF3F1 and EF3R1 primers for the first step and EF3F2 and EF3R2 for the second step (Table 1).
Table 1.
The Primers Used for Bisulfite Sequencing, RT-MSP, Control RT, PCR, and RT after Methylation-Sensitive Digestions
| Primer name | Nucleotidic sequence | Product length |
|---|---|---|
| EF3F1 | 5′-TTGGTTTGGTTTTTTGGTGAG-3′ | 694 bp |
| EF3R1 | 5′-CAAAACAAAAACAAACAAAAATC-3′ | |
| EF3F2 | 5′-GATTTAGGGTTGTTATTATGTT-3′ | 498 bp |
| EF3R2 | 5′-CTATTATCAACTTTTAAACAA-3′ | |
| mMSP-EF3F1C | 5′-AAGTCGTATGGGTAAAGTTTTTGTCTC-3′ | 179 bp |
| mMSP-EF3R2G | 5′-CAAAAAACCCACCCCAACCCGCG-3′ | |
| MSP-C+-EF3F2 | 5′-GGGTTGGGTTGAGATATAATATATGTT-3′ | 242 bp |
| MSP-C+-EF3R1 | 5′-ACTCAACCAAATACACTATTATCAACTT-3′ | |
| mMSP-RASSF1AF | 5′-TTATCGTTTTTAGTTCGCGGGGTTC-3′ | 99 bp |
| mMSP-RASSF1AR3 | 5′-CGCGCGCACTACAAACCTTTACG-3′ | |
| C+RASSF1AF1bis | 5′-GTGATAGAATGTAAAGAATGAATAAGGGGT-3′ | 113 bp |
| C+RASSF1AR1bis | 5′-AATCTTAAACTCCTAACCTCAAATAATCCA-3′ | |
| EF3-AciI-digest F1 | 5′-CCCACCTTGCAAAGAAGAAA-3′ | 162 bp |
| EF3-AciI-digest R1 | 5′-CCGTCCACAATGACAAACAT-3′ | |
| EF3-AciI-digest R3 | 5′-TGCAACCGCTTTCAGACTCA-3′ | |
| RassF1A AciI F | 5′-GACCTCTGTGGCGACTTCAT-3′ | 233 bp |
| RassF1A AciI R | 5′-GGAGTGCGACAAGGGATAAA-3′ | |
| RassF1A AciI R4 | 5′-ACCATTTTCGCGCACTCTTC-3′ | |
| GAPDH F | 5′-ACATGTTCCAATATGATTCCA-3′ | 291 bp and 162 bp |
| GAPDH R | 5′-TGGACTCCACGACGTACTCAG-3′ |
The sequence of each primer and the lengths of the PCR products are indicated. The primer EF3-AciI-digest F1 coupled with the primer EF3-AciI-digest R3 provides a 190-bp PCR product. The primer RassF1A AciI F coupled with the primer RassF1A AciI R4 gives a 214-bp PCR product.
Reactions were performed in presence of 0.2 mmol/L each dNTP, 0.15 μmol/L (first step) or 0.3 μmol/L (second step) of each primer, 0.5 units of Amplitaq DNA polymerase (Applied Biosystem, Nieuwerkerk, The Netherlands) using the buffer recommended by the manufacturer. The second step was carried out using 1 μl of the first step product as template. The thermal cycling conditions were: 95°C for 3 minutes, followed by 95°C for 30 seconds, 52°C for 45 seconds, and 72°C for 45 seconds for 25 (first step) or 35 (second step) cycles.
PCR products were run on agarose gels and recovered using QIAquick Gel Extraction Kit (Qiagen), following the manufacturer's instructions. Purified PCR products were cloned in the pCR2.1 cloning vector using TA Cloning Kit (Invitrogen Corporation, Carlsbad, CA) and sequenced by using the dye terminator method (PRIMM facility, Naples, Italy).
Real Time Methylation-Specific PCR on Bisulfite-Converted DNA
Real-time methylation-specific PCR (RT-MSP) of EF3 and RASSF1A markers was performed on 10 ng of CVS and maternal blood cell bisulfite converted DNA, in a final volume of 20 μl in presence of 0.15 μmol/L of each primer and 1× iQ SYBR Green Supermix (Bio-Rad, Hercules, CA) using DNA Engine Opticon 2 System (Bio-Rad) with mMSP-EF3F1C and mMSP-EF3R2G primer pair (EF3) or mMSP-RASSF1AF and mMSP-RASSF1AR3 primers (RASSF1A) (Table 1). The control primers were MSP-C+-EF3F2 and MSP-C+-EF3R1 (EF3) and C+RASSF1AF1bis and C+RASSF1AR1bis (RASSF1A) (Table 1). The real-time PCR protocol for EF3 marker was 4 minutes at 95°C followed by 15 seconds at 95°C, 20 seconds at 60°C (for RT-MSP) or 58°C (for control RT) and 20 seconds at 72°C for 32 cycles and for RASSF1A marker was 4 minutes at 95°C followed by 15 seconds at 95°C, 20 seconds at 60°C (for RT- MSP) or 62°C (for control RT) and 20 seconds at 72°C for 35 cycles.
RT-MSP of EF3 and RASSF1A on plasma samples were performed with the same primers previously described, using 8 μl of 1:4 dilution of converted plasma DNA, extracted from first trimester pregnancies, containing approximately 16 pg of fetal DNA and 309 pg of maternal DNA. For this reason, RT-MSP was carried out, separately, also on 16 pg of CVS converted DNA and 309 pg of converted maternal blood DNA, respectively as positive and negative controls. Reactions were performed in the same conditions previously illustrated except for the cycles number (47 for EF3 and 48 for RASSF1A).
At the end of each RT-MSP experiment, the melting curve of each PCR product was checked to confirm the purity and all products were analyzed by agarose gel electrophoresis to verify the amplicon size.
The sex chromosomes/autosomes (SC/A) ratio was calculated as the concentration fold change following RT-MSP of EF3 and RASSF1A markers. Ten ng of bisulfite converted DNA extracted from CVS of five Turner cases (45,X; samples T1, T2, T3, T4, and T5) and four normal euploid individuals as controls (N6, N7, N8 and N9) were amplified using methylation specific primers in the same conditions before described, but using the CFX96 Real-Time System (Bio-Rad). The thermal cycling protocol was 4 minutes at 95°C followed by 15 seconds at 95°C, 20 seconds at 62°C or 64°C (for EF3 or RASSF1A, respectively), and 20 seconds at 72°C for 37 cycles.
In all RT-MSP experiments, samples were present in triplicate and each experiment was performed three times (technical replicates). SC/A ratio was calculated using the 2−ΔΔCt method,41 where N8 has been considered as reference sample (fold change = 1, omitted in the graphic representation) to whom compare all of the other samples.
Analysis of DNA Digested with Methylation Sensitive Restriction Enzymes
One μg of CVS and maternal blood cell DNA was digested with 10 U of AciI enzyme (New England Biolabs, Ipswich, MA) for 4 hours at 37°C, then adding 10 U of enzyme and incubating for a further 4 hours, and finally adding another 20 U and incubating overnight. Fifty ng of each digested DNA was subject to PCR to amplify EF3 and RASSF1A markers and glyceraldehyde-3-phosphate dehydrogenase (GAPDH) genomic region, using EF3-AciI-digestF1 and EF3-AciI-digestR1 primers (EF3), RassF1A AciI F and RassF1A AciI R primers (RASSF1A), and GAPDH F and GAPDH R primers (GAPDH) (Table 1). The reactions were performed in presence of 0.2 mmol/L each dNTP, 0.3 μmol/L (EF3 and RASSF1A) or 0.2 μmol/L (GAPDH) of each primer, 1.5 mmol/L MgCl2, 0.5 U of EuroTaq DNA Polymerase (Euroclone, UK), and 1× reaction buffer in a final volume of 10 μl. The thermal cycling protocol was: 4 minutes at 95°C, followed by 30 seconds at 95°C, 45 seconds at 60°C and 45 seconds at 72°C for 27 (EF3), 33 (RASSF1A), or 35 (GAPDH) cycles and 5 minutes of final extension at 72°C. PCR products were analyzed by agarose gel electrophoresis.
The same methylation-sensitive assay was performed on maternal plasma by digesting 10 μl of plasma DNA obtained from a first trimester pregnancy. Two hundred fifty pg of CVS DNA and 4750 pg of maternal blood cell DNA were also digested as positive and negative controls, respectively. DNA samples were incubated with 10 U of Aci I enzyme (New England Biolabs) in a final volume of 20 μl for 6 hours at 37°C, then 10 U of Aci I were added and the samples were incubated overnight. Subsequently, DNAs were precipitated with ethanol, sodium acetate, and magnesium chloride and digested with 10 U of HpaII for 6 hours at 37°C in a volume of 20 μl, then 10 U of enzyme were added and the digestion was continued overnight.
To amplify the EF3 and RASSF1A markers and GAPDH genomic region PCR reactions were carried out using 1 μl (EF3 and GAPDH) and 2 μl (RASSF1A) of plasma, CVS and blood digested DNAs using the same conditions as described above, except for 37 (EF3), 45 (GAPDH), or 50 cycles (RASSF1A).
All PCR reactions were carried out using Gradient PCR Express (Hybaid, UK).
SC/A ratio was obtained by real time and calculated, with the 2−ΔΔCt method.41 In all real time experiments samples were present in triplicate and each experiment was performed three times. Two μg of DNA extracted from CVS of four Turner cases (45,X; samples T1, T2, T3 and T4; the DNA sample from T5 previously used was not available at the time of this experiment) and four normal euploid controls (N6, N7, N8 and N9, N8 as reference sample) were digested with 10 U of AciI enzyme (New England Biolabs) in a volume of 30 μl for 4 hours at 37°C, then 10 U of enzyme were added and the mixtures were incubated overnight. DNAs were then precipitated with ethanol, sodium acetate, and glycogen and digested with 10 U of HpaII for 6 hours at 37°C in a volume of 30 μl, then 10 U of enzyme were added and the digestion was continued overnight. Four μl of a 1:7 dilution of each digested DNA was subject to real-time PCR using EF3-AciI-digest F1 and EF3-AciI-digest R3 primers (EF3) and RassF1A AciI F and RassF1A AciI R4 primers (RASSF1A) (Table 1). Reactions were performed in a final volume of 20 μl in the presence of 0.15 μmol/L of each primer and 1× iQ SYBR Green Supermix (Bio-Rad) using the CFX96 Real-Time System (Bio-Rad). The thermal cycling protocol was 4 minutes at 95°C followed by 15 seconds at 95°C, 20 seconds at 60°C, and 20 seconds at 72°C for 40 cycles.
All primers cited in this paragraph were designed using the primer3 web site (http://frodo.wi.mit.edu/primer3/, last accessed on March 9, 2010).
Statistical Analysis
We used χ2 test (2 × 2 contingency table, http://faculty.vassar.edu/lowry/VassarStats.html, last accessed on April 20, 2010) to measure statistical significance of differential methylation frequencies at each CpG site of EF3 and RASSF1A markers, from placenta and blood DNAs.
Mann-Whitney nonparametric test (Minitab 15 statistical software) was used to assess statistical significance of SC/A ratios calculated as fold changes of EF3 marker in Turner and normal euploid samples either after RT-MSP and Real Time after methylation sensitive digestion experiments. Statistical analysis was performed comparing samples within the group of controls (N6, N7, and N9) and the group of Turner samples (T1, T2, T3, T4; T5 sample is enclosed only for the RT-MSP experiment), between the two groups ( vs
vs  ) and between each Turner sample and the group of controls.
Results
Selection of X Chromosome Markers and Characterization of their Methylation Status
A series of X chromosome DNA sequences differentially methylated between placenta (both first and third trimester) and maternal blood cells by MeDiP-chip were reported by Papageorgiou and co-workers,40 half of them showing hypomethylation in placenta and hypermetylation in maternal blood cells, the other half showing the opposite methylation profile. Among them, we selected two regions hypomethylated in placenta and hypermethylated in maternal blood cells (EF1 and EF2) located in a region containing clusters of genes escaping X inactivation.40,42 A third region showing an opposite methylation profile (EF3) was also selected.40 Preliminary characterization of the first two markers after sodium bisulfite conversion revealed only a weak differential methylation status (data not shown) and these markers were not studied further.
EF3 is positioned between 2.624.944 bp and 2.626.149 bp (Figure 1A) in the pseudoautosomal 1 (PAR1) region of the chromosome X, in intron 1 of the CD99 gene. It shows a 100% homology to the Y chromosome. Because of the scarce number of CpGs in this region, it is not recognized as a canonical CpG island in the UCSC genome browser, CpG island searcher and CpG plot (http://genome.ucsc.edu/, last accessed on March 9, 2010, http://cpgislands.usc.edu/, last accessed on March 9, 2010, http://www.ebi.ac.uk/Tools/emboss/cpgplot/index.html, last accessed on March 9, 2010).
Figure 1.
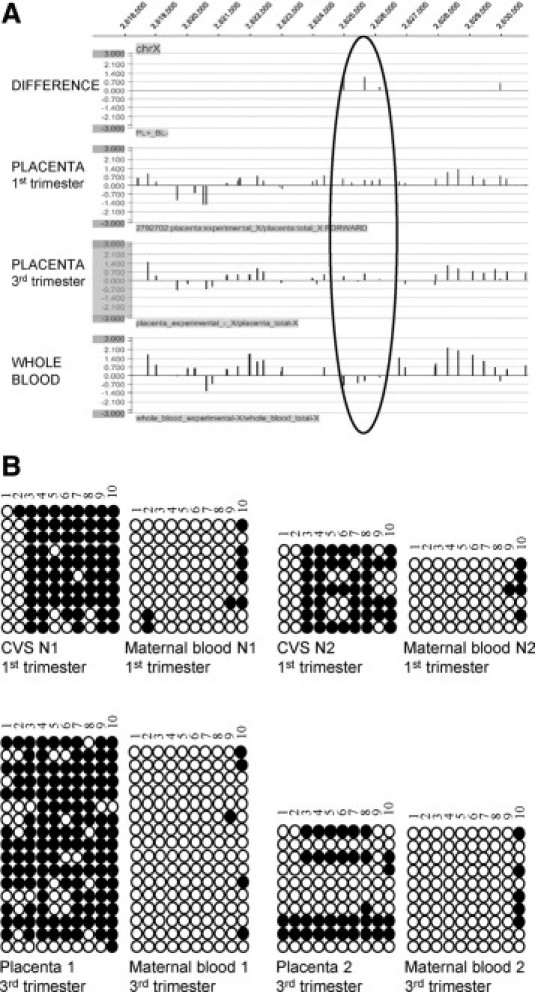
Analysis of the differential methylation status of the EF3 marker between placenta (first and third trimester) and whole blood. A: Differential methylation status analyzed by MeDiP-chip of the X chromosome genomic region indicated at the top. The black circle indicates the position of the region (2.624.944 bp to 2.626.149 bp, EF3) used for further analysis. Methylation differences between third-trimester placenta and whole blood and individual methylation status of whole blood, first-, and third-trimester placental DNA samples are indicated. B: Analysis of the methylation status of the EF3 sequence after bisulfite conversion of first- (up) and third- (down) trimester placental and maternal blood cell DNA. Two placental-maternal blood pairs were analyzed for each trimester [pairs N1 (46,XY) and N2 (46,XY) for the first trimester and pairs 1 (46,XX) and 2 (46,XY) for the third trimester]. Each row of circles indicates a single clone analyzed, while each column represents a single CpG site. Empty circles indicate unmethylated cytosines, whereas black circles represent methylated cytosines. CVS: chorionic villus sample.
Analysis of the methylation status of the EF3 marker in two first trimester and two third trimester placenta-maternal blood cell DNA pairs revealed a strong hypermethylation in placenta in relation to maternal blood cell DNA, especially in first trimester pregnancies (Figure 1B). The proportion of the methylated and unmethylated clones at each CpG site for first and third trimester pregnancies is shown in Table 2. Statistically significant (χ2 test, P < 0.0001) differences were found at several CpG sites in both samples.
Table 2.
Summary of Bisulfite Analysis of the EF3 Marker
| Number of clones at designed CpG sites |
|||||||||||
|---|---|---|---|---|---|---|---|---|---|---|---|
| First trimester samples | Methylation status | 1 | 2 | 3 | 4 | 5 | 6 | 7 | 8 | 9 | 10 |
| I Pla | M | 0 | 1 | 17 | 17 | 11 | 13 | 15 | 15 | 13 | 15 |
| I Pla | U | 17 | 16 | 0 | 0 | 6 | 4 | 2 | 2 | 4 | 2 |
| I Mat | M | 0 | 2 | 0 | 0 | 0 | 0 | 0 | 0 | 2 | 9 |
| I Mat | U | 15 | 13 | 15 | 15 | 15 | 15 | 15 | 15 | 13 | 6 |
| χ2 | 28.11 | 28.11 | 12.06 | 16.28 | 21.5 | 21.5 | 10.35 | ||||
| P | ns | ns | <.0001 | <.0001 | 0.000515 | <.0001 | <.0001 | <.0001 | 0.001295 | ns | |
| Number of clones at designed CpG sites |
|||||||||||
|---|---|---|---|---|---|---|---|---|---|---|---|
| Third trimester samples | Methylation status | 1 | 2 | 3 | 4 | 5 | 6 | 7 | 8 | 9 | 10 |
| III Pla | M | 13 | 11 | 18 | 20 | 16 | 15 | 19 | 17 | 17 | 20 |
| III Pla | U | 14 | 16 | 9 | 7 | 11 | 12 | 8 | 10 | 10 | 7 |
| III Mat | M | 0 | 0 | 0 | 0 | 0 | 0 | 0 | 0 | 1 | 9 |
| III Mat | U | 26 | 26 | 26 | 26 | 26 | 26 | 26 | 26 | 25 | 17 |
| χ2 | 14.09 | 11 | 23.36 | 27.86 | 19.35 | 17.5 | 25.54 | 21.3 | 18.09 | 6.81 | |
| P | 0.000174 | 0.000911 | <.0001 | <.0001 | <.0001 | <.0001 | <.0001 | <.0001 | <.0001 | 0.009065 | |
The proportion of methylated (M) and unmethylated (U) clones at each CpG site of the EF3 sequence during the first and the third trimester of pregnancy was compared between placental and maternal blood cell DNA. I Pla: first-trimester placental tissue; I Mat: first-trimester maternal blood cells; III Pla: third-trimester placental tissue; III Mat: third-trimester maternal blood cells. The χ2 analysis refers to the comparison within an individual CpG site. Bold numbers relative to first-trimester samples indicate the positions of the CpG sites used to design real-time MSP oligonucleotides. ns: not significant.
EF3 Discriminates CVS versus Maternal Blood Cell DNA by Real Time Methylation-Specific PCR
To further characterize the methylation status of the EF3 marker and develop a strategy for selectively amplifying placenta specific sequences, methylation-specific primers were designed on bisulfite converted sequence of EF3. In particular, primers were designed specifically on CpG 3 and CpG 4 (forward primer) and on CpG 8 (reverse primer), as these CpGs showed the greatest differential methylation status between CVS and maternal blood cell DNA (see Table 2). To enhance the specificity of primer annealing, a deliberate mismatch was inserted near the 3′ end of forward and reverse primers.43 RT-MSP was carried out on four different first trimester CVS-maternal blood cell DNA pairs. To check the amount and the quality of all templates, a control real-time PCR was performed using a primer pair that amplifies both methylated and unmethylated templates, designed on the bisulfite converted EF3 sequence, but not containing any CpGs. As illustrated in Figure 2A, RT-MSP was successful on CVS samples, but negative (no amplification) in maternal blood cell DNA samples, whereas control primers correctly amplified all templates. Since EF3 is located in the PAR1 region, it is 100% homologous to the Y chromosome and is likely to show the same hypermethylation as the X chromosome in placental DNA. For these reasons, we cannot distinguish between XY and XX fetuses when using the EF3 marker alone, since the amplification of the methylated EF3 marker may result from both the X and the Y chromosome.
Figure 2.
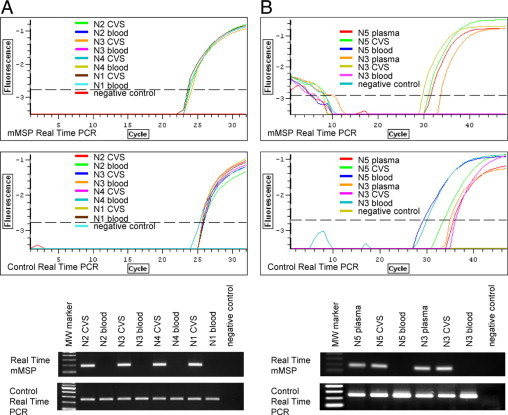
Real-time MSP to amplify methylated sequences (placental) of the EF3 marker. A: Real-time MSP performed on four first trimester CVS-maternal blood DNA pairs [N2 (46,XY), N3 (46,XY), N4 (46,XY), and N1 (46, XY)] after bisulfite conversion. B: Real-time MSP to selectively amplify methylated sequences (fetal) of the EF3 marker from maternal plasma DNA. Reactions were performed on DNA extracted from first-trimester maternal plasma, CVS, and maternal blood cells after bisulfite conversion of DNAs from two pregnancies (N5 and N3). Primer pairs are the same used in A. The quality and the amount of all templates have been checked by amplifying samples with a primer pair specific for both methylated and unmethylated templates (control real-time PCR). Upper panels indicate fluorescence curves, whereas lower panels represent electrophoretic analysis of real-time products. MW marker: molecular weight marker. CVS: chorionic villus sample.
EF3 Discriminates cffDNA versus cfmDNA in Maternal Plasma Samples
To verify that MSP primers for EF3 could discriminate between cffDNA and cfmDNA in maternal plasma samples, the same RT-MSP experiment was set up on DNA extracted from maternal plasma, CVS and maternal blood cells of two pregnancies. In particular, RT-MSP of EF3 marker on bisulfite converted plasma DNA samples was carried out assuming that the mean yield of DNA extracted per 0.5 ml of plasma is 10 ng, of which 5% is of fetal origin, as suggested by Legler et al44 and assuming that the yield of DNA after bisulfite conversion is 65%. To verify the fetal origin of the RT-MSP product from maternal plasma samples we amplified plasma DNA, the corresponding amounts of maternal blood cell DNA and CVS DNA as negative and positive controls respectively.
As shown in Figure 2B, the RT-MSP product is visible only in maternal plasma and CVS DNA samples, whereas it is completely absent in maternal blood cell DNA. All tested samples showed PCR products using nondiscriminating control primers.
RASSF1A as Normalization Marker
To quantify the fetal sex chromosome copy number in maternal plasma for NIPD of sex chromosome aneuploidies, we used the autosomal RASSF1A gene located on chromosome 3. RASSF1A promoter hypermethylation in placenta in relation to maternal blood cell DNA has been recently reported.45 By comparing concentrations of RT-MSP fetal templates of the RASSF1A promoter to EF3 in maternal plasma, the sex chromosome copy number can be estimated.
RASSF1A primers were designed based on the methylation comparison between maternal blood cell and CVS DNA of first trimester pregnancies (Table 3) from the bisulfite sequencing data published by Chiu et al.45 RASSF1A RT-MSP analysis of four first trimester CVS maternal blood cell DNA pairs showed selective amplification only from CVS DNA, whereas the product was absent from maternal blood cell DNA used as template; nondiscriminating primers showed amplification of product from all analyzed samples (Figure 3A).
Table 3.
Summary of Bisulfite Analysis of the RASSF1A Marker
| Number of clones at designed CpG sites |
|||||||||||||||
|---|---|---|---|---|---|---|---|---|---|---|---|---|---|---|---|
| First trimester samples | Methylation status | +157 | +168 | +170 | +177 | +182 | +188 | +195 | +207 | +222 | +225 | +229 | +246 | +248 | +250 |
| I Pla | M | 54 | 55 | 53 | 55 | 50 | 34 | 53 | 49 | 51 | 46 | 58 | 58 | 57 | 56 |
| I Pla | U | 6 | 5 | 7 | 5 | 10 | 26 | 7 | 11 | 9 | 14 | 2 | 2 | 3 | 4 |
| I Mat | M | 0 | 0 | 0 | 0 | 0 | 0 | 0 | 0 | 0 | 0 | 0 | 0 | 0 | 1 |
| I Mat | U | 60 | 60 | 60 | 60 | 60 | 60 | 60 | 60 | 60 | 60 | 60 | 60 | 60 | 59 |
| χ2 | 94.58 | 97.88 | 91.38 | 97.88 | 82.32 | 44.69 | 91.38 | 79.47 | 85.25 | 71.39 | 108.42 | 108.42 | 104.8 | 97.44 | |
| P | <.0001 | <.0001 | <.0001 | <.0001 | <.0001 | <.0001 | <.0001 | <.0001 | <.0001 | <.0001 | <.0001 | <.0001 | <.0001 | <.0001 | |
The proportion of methylated (M) and unmethylated (U) clones at each CpG site of the RASSF1A sequence during the first trimester of pregnancy was compared between placental and maternal blood DNA. I Pla: first-trimester placental tissue; I Mat: first-trimester maternal blood cells. The χ2 analysis refers to the comparison within an individual CpG site. Bold numbers indicate the positions of the CpG sites used to design real-time MSP oligonucleotides. ns: not significant.
Figure 3.
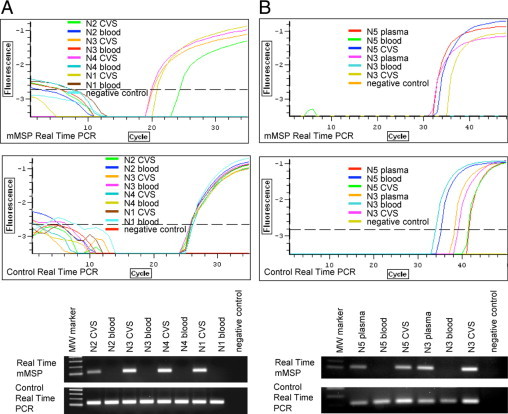
Real-time MSP to amplify methylated sequences (placental) of the RASSF1A marker. A: Real-time MSP carried out on four first trimester CVS-maternal blood DNA pairs [N2 (46,XY), N3 (46,XY), N4 (46,XY), and N1 (46,XY)] after bisulfite conversion. The forward primer has been designed on CpG +157, +168, +170, and +177, while the reverse primer has been designed on CpG +229, +246, +248, and +250 (see Table 3). B: Real-time MSP to selectively amplify methylated sequences (fetal) of RASSF1A marker from maternal plasma. Reactions were performed on DNA extracted from first-trimester maternal plasma, CVS, and maternal blood cells after bisulfite conversion of two pregnancies (N5 and N3). Primer pairs are the same used in A. The quality and the amount of all templates have been checked by amplifying samples with a primer pair specific for both methylated and unmethylated templates (control real-time PCR). Upper panels indicate fluorescence curves, whereas lower panels represent electrophoretic analysis of real-time products. MW marker: molecular weight marker. CVS: chorionic villus sample.
To assess the capacity of the RASSF1A marker to discriminate between cffDNA and cfmDNA in maternal plasma, a real-time MSP was performed using sodium bisulfite converted DNA from maternal plasma, CVS and maternal blood (as described for EF3 marker). As illustrated in Figure 3B, the RT-MSP product is visible in both plasma and CVS DNA samples, but it is absent from maternal blood cell DNA, while control nondiscriminating primers amplified all DNA templates.
Detection of the Sex Chromosomes/Autosomes Ratio (SC/A Ratio) in CVS of Turner Pregnancies after Bisulfite Conversion
On the basis of the previously reported evidences, EF3 and RASSF1A markers should be used to estimate sex chromosomes/autosomes copy number ratio (SC/A ratio).
We performed the RT-MSP of the EF3 and RASSF1A markers on five Turner syndrome CVS samples and four different normal euploid controls (all from first trimester pregnancies) and used RASSF1A for normalization. As illustrated in Figure 4, single samples within the group of normal euploid controls do not show significantly different EF3 fold changes, normalized with RASSF1A; the same was observed within the group of Turner individuals (average respectively of 0.84 ± 0.23 and 0.37 ± 0.083). Conversely, the comparison of the two groups ( vs ) does show a significant different fold change (P = 0.0001). Furthermore, EF3 fold changes associated to each Turner individual are significantly different from the controls (P < 0.027).
Figure 4.
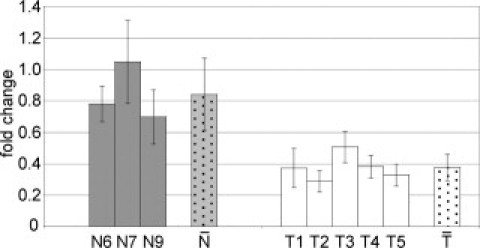
Detection of sex chromosomes/autosomes ratio in CVS of 45,X pregnancies after bisulfite conversion. Real-time MSP of the EF3 marker, normalized with RASSF1A. Reactions were performed on first-trimester CVS samples from four euploid individuals (N6, N7, N8, and N9) and five Turner (45,X) samples (T1, T2, T3, T4, and T5). One euploid individual was used as reference sample in the 2−ΔΔCt calculations, and each of the four euploid samples gave similar results. We reported the graphic results based on the reference euploid sample N8 (fold change = 1, omitted in the figure) that gave the least significant P value. Each Turner sample resulted statistically different from euploid controls (P = 0.0265 for T1, P = 0.0162 for T2, P = 0.0265 for T3, P = 0.0162 for T4, and P = 0.0162 for T5). Gray and white dotted bars ( vs ) indicate, respectively, the average fold changes for euploid and Turner samples (the two groups are significantly different with P = 0.0001).
Alternative to Bisulfite Treatment: Differential Detection of EF3 Sequences after Digestion with a Methylation Sensitive Restriction Enzyme
CpG 3 and 4 of EF3 marker are included in two restriction sites recognized by AciI methylation sensitive enzyme. Moreover, RASSF1A marker contains several AciI sites in its CpG island (Figure 5A). Four CVS and four maternal blood cell DNA samples from first trimester pregnancies were digested with AciI enzyme and amplified with EF3 and RASSF1A primer pairs. PCR products of both markers were visible only in CVS DNA samples (Figure 5B). To eliminate the maternal EF3 and RASSF1A sequences from maternal plasma, we performed restriction digestions with the AciI enzyme on maternal plasma DNA extracted from a first trimester pregnancy. To enhance the efficacy of restriction digestion of the EF3 marker, we performed an additional digestion using HpaII, another methylation sensitive enzyme, which recognizes a site on CpG 5 of EF3. Appropriate negative (maternal blood cell DNA) and positive (CVS DNA) controls of the same pregnancy were also digested and amplified. For both the EF3 and RASSF1A markers, amplification after restriction digestion was detectable only from CVS and maternal plasma samples, while it was completely absent from digested maternal blood cell DNA (Figure 5C).
Figure 5.
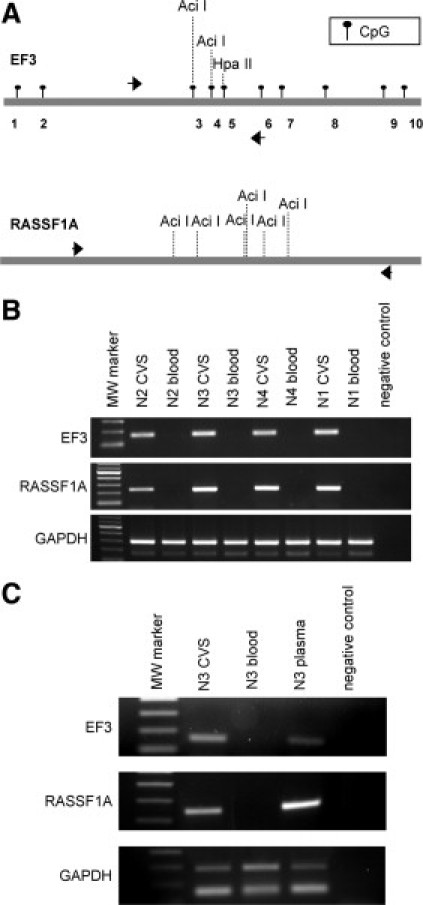
Differential detection of the EF3 and RASSF1A sequences after methylation-sensitive restriction digestion. A: Schematic representation of the EF3 and the RASSF1A sequences. The localization of CpG sites of the EF3 marker are indicated by black circles, whereas the positions of CpG sites of the RASSF1A were omitted. Black arrows represent the position of the primers used to amplify the EF3 and RASSF1A DNA after methylation-sensitive digestion. The positions of AciI and HpaII restriction sites used to discriminate between CVS and maternal blood cell DNA are reported. B: PCR of the EF3 and RASSF1A markers and the GAPDH genomic region after methylation-sensitive restriction digestion with the AciI enzyme of four CVS and maternal blood cell DNA pairs [N2 (46,XY), N3 (46,XY), N4 (46,XY), and N1 (46,XY)]. The primer pair used to amplify GAPDH provides two amplification products, the longer representing GAPDH gene (291 bp) and the shorter corresponding to pseudogene (162 bp). C: PCR of the EF3 and RASSF1A markers and the GAPDH genomic region after methylation-sensitive restriction digestion of maternal plasma, CVS, and maternal blood cell DNA of one first-trimester pregnancy [N3 (46,XY)], using the AciI and HpaII restriction enzymes. The primer pairs used are the same as illustrated in (C).
Detection of the SC/A Ratio in CVS of Turner Pregnancies after Methylation-Sensitive Restriction Digestion
We performed real-time experiments of the EF3 and RASSF1A markers on CVS DNA extracted from four Turner syndrome and four different normal euploid controls (all from first trimester pregnancies) after digestion with AciI and HpaII restriction enzymes. As depicted in Figure 6, single samples within the group of normal euploid controls do not show significantly different EF3 fold changes, normalized with RASSF1A; the same was observed within the group of Turner individuals (average respectively of 1.13 ± 0.21 and 0.44 ± 0.17). On the contrary, the comparison of the two groups shows a significant different fold change (P = 0.0003). Additionally, each Turner fold change is significantly different from the controls (P < 0.027).
Figure 6.
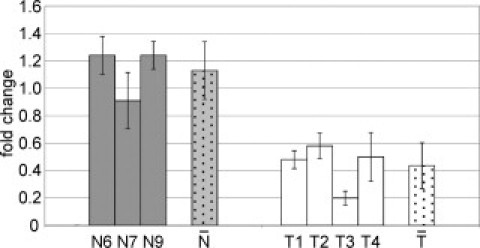
Detection of sex chromosomes/autosomes ratio in CVS of 45,X pregnancies after methylation-sensitive restriction digestion. Real-time PCR after methylation-sensitive restriction digestion. Same samples and calculations as in Figure 4, except that the Turner (45,X) T5 sample was omitted. (P = 0.0162 for T1, P = 0.0265 for T2, P = 0.0162 for T3, and P = 0.0265 for T4). Gray and white dotted bars ( vs ) indicate, respectively, the average fold changes for euploid and Turner samples (the two groups are significantly different with P = 0.0003).
Discussion
Several efforts have been made in the last decade to implement noninvasive methods of prenatal diagnosis, eg, to detect aneuploidies compatible with life early in the first trimester of pregnancy, avoiding risks associated with invasive methodologies. Recently, the use of free fetal nucleic acids contained in the maternal plasma have been investigated.11,23 On the one hand, methods using mRNA of fetal origin contained in maternal plasma are subject to difficulties related to the instability of RNA and the need of heterozygous fetuses. Moreover, both alleles are not always equally expressed. On the other hand, work with cffDNA in the maternal plasma is extremely difficult due to its scarcity and the presence of a vast excess of cfmDNA making the enrichment of fetally derived free DNA problematic.12,46,47 High throughput sequencing has been investigated recently as a method for NIPD using cffDNA in the maternal plasma. Massively parallel sequencing followed by read-depth analysis has been shown, at least in proof of principle to identify trisomies in the fetus.28,29 Nevertheless, this technique, while potentially powerful, is technically and bioinformatically demanding and costly, at present limiting its use in routine diagnostics. An alternative strategy using cffDNA for NIPD, exploits the differential methylation of DNA of placental origin,20,21 compared to maternal DNA in the circulation (assumed to be mainly from maternal hematopoietic cells).22 Hypomethylation of the promoter region of the SERPINB5 gene in placenta with respect to maternal blood cells has recently been exploited for NIPD.34
Following on from these studies, our interest has focused on the identification and characterization of fetal specific epigenetic markers to detect X chromosome aneuploidies starting from maternal plasma. Our work initially used the known correlation between DNA methylation and gene expression. Bioinformatic search of differentially methylated promoters of genes showing differential expression between placenta and maternal blood cells revealed only a small number of candidate loci (not shown). We focused on the direct analysis of the methylation status, independently of the involvement of gene expression, by high throughput genomic analysis. The novelties of this strategy are: i) the non-biased identification of differentially methylated regions, through immunoprecipitation of methylated DNA followed by hybridization to a high resolution DNA microarray (MeDiP-chip) containing sequences of chromosomes X, Y, 13, 21, and 1840; ii) the simple quantification of the sex chromosome number using a combination of a sex chromosome and an autosomal, differentially methylated, markers (SC/A ratio).
A number of MeDiP-derived, X linked sequences were selected. Their differential methylation status between maternal blood cell and placenta DNA was verified by RT-MSP. Not all of the markers chosen were satisfactory for the development of a NIPD for X chromosome aneuploidies; however, the original identification of a large number of markers facilitated this approach.40
We have chosen EF3 as the marker for NIPD, as it is hypermetylated in placenta compared to maternal blood cells, with strong differential methylation between the two tissues, in both first and third trimester of pregnancy. In this context it is important to note that the strong differential methylation of EF3 was not associated with a conventional canonical CpG island region. This is an additional reason to perform genome-wide, instead of gene/CpG island-based, search of epigenetic biomarkers.
From its nature of being a PAR1 specific marker, EF3 shows 100% of homology between X and Y chromosomes. Accordingly, the analysis of the methylation status of this marker in 46,XY male and 46,XX female CVS revealed exclusively hypermethylated sequences, suggesting that the methylation status is the same for both the X and Y chromosomes. Therefore, discrimination between different sex chromosome karyotypes will require concomitant quantitative amplification of Y specific markers.
For EF3 use in NIPD we propose to simultaneously analyze RASSF1A, an autosomal marker insensitive to the number of sex chromosomes. In CVS of five 45,X samples we found that using this method the SC/A ratio approached the expected 0.5 value. The gap between observed and predicted results has been due, in our opinion, mainly to the interindividual variability in DNA methylation of the chosen markers. This phenomenon is widely debated: in a recent study the authors found significant interindividual variability in the level of methylation for specific Alu elements among the members of 48 three-generation families.48 Furthermore, whereas EF3 can efficiently discriminate between fetal and maternal blood cell DNA, in an all or none fashion and its discrimination is complete not only in third trimester but, more importantly, also in first trimester samples. However, the autosomal universal RASSF1A marker, in our hands revealed interindividual differences (not shown) which may be reduced by the use of several controls and/or by the identification of new universal markers, exploiting the power of genome wide techniques such as the above mentioned MeDiP.40 We further performed EF3 and RASSF1A amplification on DNA digested with methylation sensitive restriction enzymes that selectively discriminate between free fetal and maternally derived DNA: as shown in Figure 6. Using this method we were able to determine that the SC/A ratio in Turner CVS samples was approaching the expected 0.5 values.
Our strategies rely on the current methods to analyze and measure DNA methylation, which were initially based on the use of enzymes that can distinguish between methylated and unmethylated recognition sites in the sequence of interest. This approach has many drawbacks, such as the number of restriction sites in genome that can be targets for the restriction enzyme and the incomplete restriction-enzyme cutting.49 However, even methods defined as the “gold standard” in DNA methylation analysis ie, bisulfite sequencing,50 have their limitations such as the laborious experimental procedure and the possibility of an incomplete DNA conversion.
Nonetheless, either using bisulfite or methylation sensitive based strategies, we were able to determine the SC/A ratio of Turner samples. Discrepancies in EF3 fold changes may be directly related to the different techniques applied before RT-PCR experiments which, as discussed before, have technical limitations even if at different levels.
In conclusion, we have characterized the first sex chromosome specific epigenetic marker capable of being used for determining the number of sex chromosomes of the fetus from a maternal blood sample. EF3 represents an ideal marker for the development of a routine, rapid and cheap diagnostic NIPD assay of sex chromosome aneuploidies. Moreover, EF3 may also identify PAR1 deletions, often responsible of severe syndromes such as Leri-Weill dyschondrosteosis, caused by the lack of the SHOX gene.51 Furthermore, the strategy outlined here for EF3 identification may be applicable, besides the sex chromosomes, to other regions with similar properties thus enabling the noninvasive diagnosis, in plasma samples, of trisomies of chromosomes 13, 18, and 21 or even for microdeletion and microduplication syndromes.
Acknowledgements
We thank Dr. Aurora Storlazzi for helpful suggestions and critical reading of the manuscript, Dr. Vincenzo Cirigliano for his help in the initial phases of the work, Dr. Massimo Ferrara for the management and cryoconservation of the cells from CVS at the Laboratory of Cytogenetics and Prenatal Diagnosis of the University of Naples Federico II, and Ms. Anna Aliperti for expert secretarial assistance.
Footnotes
Supported by the SAFE Network of Excellence European Commission Funded 6th Framework Package Project Number: LSHB-CT-2004-503243 to F.D.R., M.H., P.C.P., and M.D.E. N.P.C. is funded by the Wellcome Trust (grant number WT077008).
None of the authors disclosed any relevant financial relationships.
References
- 1.Kim YJ, Park SY, Han JH, Kim MY, Yang JH, Choi KH, Kim YM, Kim JM, Ryu HM. Parental decisions of prenatally detected sex chromosome abnormality. J Korean Med Sci. 2002;17:53–57. doi: 10.3346/jkms.2002.17.1.53. [DOI] [PMC free article] [PubMed] [Google Scholar]
- 2.Bender BG, Linden MG, Robinson A. Neuropsychological impairment in 42 adolescents with sex chromosome abnormalities. Am J Med Genet. 1993;48:169–173. doi: 10.1002/ajmg.1320480312. [DOI] [PubMed] [Google Scholar]
- 3.Lo YM. Noninvasive prenatal detection of fetal chromosomal aneuploidies by maternal plasma nucleic acid analysis: a review of the current state of the art. BJOG. 2009;116:152–157. doi: 10.1111/j.1471-0528.2008.02010.x. [DOI] [PubMed] [Google Scholar]
- 4.Cheung MC, Goldberg JD, Kan YW. Prenatal diagnosis of sickle cell anaemia and thalassaemia by analysis of fetal cells in maternal blood. Nat Genet. 1996;14:264–268. doi: 10.1038/ng1196-264. [DOI] [PubMed] [Google Scholar]
- 5.Bianchi DW, Flint AF, Pizzimenti MF, Knoll JH, Latt SA. Isolation of fetal DNA from nucleated erythrocytes in maternal blood. Proc Natl Acad Sci USA. 1990;87:3279–3283. doi: 10.1073/pnas.87.9.3279. [DOI] [PMC free article] [PubMed] [Google Scholar]
- 6.Herzenberg LA, Bianchi DW, Schroder J, Cann HM, Iverson GM. Fetal cells in the blood of pregnant women: detection and enrichment by fluorescence-activated cell sorting. Proc Natl Acad Sci USA. 1979;76:1453–1455. doi: 10.1073/pnas.76.3.1453. [DOI] [PMC free article] [PubMed] [Google Scholar]
- 7.Mandel P, Metais P. Les acides nucleiques du plasma sanguin chez l'homme. CR Seances Soc Biol Fil. 1948;142:241–243. [PubMed] [Google Scholar]
- 8.Leon SA, Shapiro B, Sklaroff DM, Yaros MJ. Free DNA in the serum of cancer patients and the effect of therapy. Cancer Res. 1977;37:646–650. [PubMed] [Google Scholar]
- 9.Sorenson GD, Pribish DM, Valone FH, Memoli VA, Bzik DJ, Yao SL. Soluble normal and mutated DNA sequences from single-copy genes in human blood. Cancer Epidemiol Biomarkers Prev. 1994;3:67–71. [PubMed] [Google Scholar]
- 10.Vasioukhin V, Anker P, Maurice P, Lyautey J, Lederrey C, Stroun M. Point mutations of the N-ras gene in the blood plasma DNA of patients with myelodysplastic syndrome or acute myelogenous leukaemia. Br J Haematol. 1994;86:774–779. doi: 10.1111/j.1365-2141.1994.tb04828.x. [DOI] [PubMed] [Google Scholar]
- 11.Lo YM, Corbetta N, Chamberlain PF, Rai V, Sargent IL, Redman CW, Wainscoat JS. Presence of fetal DNA in maternal plasma and serum. Lancet. 1997;350:485–487. doi: 10.1016/S0140-6736(97)02174-0. [DOI] [PubMed] [Google Scholar]
- 12.Chan KC, Zhang J, Hui AB, Wong N, Lau TK, Leung TN, Lo KW, Huang DW, Lo YM. Size distributions of maternal and fetal DNA in maternal plasma. Clin Chem. 2004;50:88–92. doi: 10.1373/clinchem.2003.024893. [DOI] [PubMed] [Google Scholar]
- 13.Lo YM, Zhang J, Leung TN, Lau TK, Chang AM, Hjelm NM. Rapid clearance of fetal DNA from maternal plasma. Am J Hum Genet. 1999;64:218–224. doi: 10.1086/302205. [DOI] [PMC free article] [PubMed] [Google Scholar]
- 14.Lo YM, Tein MS, Lau TK, Haines CJ, Leung TN, Poon PM, Wainscoat JS, Johnson PJ, Chang AM, Hjelm NM. Quantitative analysis of fetal DNA in maternal plasma and serum: implications for noninvasive prenatal diagnosis. Am J Hum Genet. 1998;62:768–775. doi: 10.1086/301800. [DOI] [PMC free article] [PubMed] [Google Scholar]
- 15.Lo YM, Hjelm NM, Fidler C, Sargent IL, Murphy MF, Chamberlain PF, Poon PM, Redman CW, Wainscoat JS. Prenatal diagnosis of fetal RhD status by molecular analysis of maternal plasma. N Engl J Med. 1998;339:1734–1738. doi: 10.1056/NEJM199812103392402. [DOI] [PubMed] [Google Scholar]
- 16.Sekizawa A, Kondo T, Iwasaki M, Watanabe A, Jimbo M, Saito H, Okai T. Accuracy of fetal gender determination by analysis of DNA in maternal plasma. Clin Chem. 2001;47:1856–1858. [PubMed] [Google Scholar]
- 17.Costa JM, Benachi A, Gautier E. New strategy for prenatal diagnosis of X-linked disorders. N Engl J Med. 2002;346:1502. doi: 10.1056/NEJM200205093461918. [DOI] [PubMed] [Google Scholar]
- 18.Ding C, Chiu RW, Lau TK, Leung TN, Chan LC, Chan AY, Charoenkwan P, Ng IS, Law HY, Ma ES, Xu X, Wanapirak C, Sanguansermsri T, Liao C, Ai MA, Chui DH, Cantor CR, Lo YM. MS analysis of single-nucleotide differences in circulating nucleic acids: Application to noninvasive prenatal diagnosis. Proc Natl Acad Sci USA. 2004;101:10762–10767. doi: 10.1073/pnas.0403962101. [DOI] [PMC free article] [PubMed] [Google Scholar]
- 19.Chiu RW, Lau TK, Leung TN, Chow KC, Chui DH, Lo YM. Prenatal exclusion of beta thalassaemia major by examination of maternal plasma. Lancet. 2002;360:998–1000. doi: 10.1016/s0140-6736(02)11086-5. [DOI] [PubMed] [Google Scholar]
- 20.Flori E, Doray B, Gautier E, Kohler M, Ernault P, Flori J, Costa JM. Circulating cell-free fetal DNA in maternal serum appears to originate from cyto- and syncytio-trophoblastic cells. Case report. Hum Reprod. 2004;19:723–724. doi: 10.1093/humrep/deh117. [DOI] [PubMed] [Google Scholar]
- 21.Alberry M, Maddocks D, Jones M, Abdel Hadi M, Abdel-Fattah S, Avent N, Soothill PW. Free fetal DNA in maternal plasma in anembryonic pregnancies: confirmation that the origin is the trophoblast. Prenat Diagn. 2007;27:415–418. doi: 10.1002/pd.1700. [DOI] [PubMed] [Google Scholar]
- 22.Lui YY, Chik KW, Chiu RW, Ho CY, Lam CW, Lo YM. Predominant hematopoietic origin of cell-free DNA in plasma and serum after sex-mismatched bone marrow transplantation. Clin Chem. 2002;48:421–427. [PubMed] [Google Scholar]
- 23.Ng EK, Tsui NB, Lau TK, Leung TN, Chiu RW, Panesar NS, Lit LC, Chan KW, Lo YM. mRNA of placental origin is readily detectable in maternal plasma. Proc Natl Acad Sci USA. 2003;100:4748–4753. doi: 10.1073/pnas.0637450100. [DOI] [PMC free article] [PubMed] [Google Scholar]
- 24.Lo YM, Tsui NB, Chiu RW, Lau TK, Leung TN, Heung MM, Gerovassili A, Jin Y, Nicolaides KH, Cantor CR, Ding C. Plasma placental RNA allelic ratio permits noninvasive prenatal chromosomal aneuploidy detection. Nat Med. 2007;13:218–223. doi: 10.1038/nm1530. [DOI] [PubMed] [Google Scholar]
- 25.Lo YM, Lun FM, Chan KC, Tsui NB, Chong KC, Lau TK, Leung TY, Zee BC, Cantor CR, Chiu RW. Digital PCR for the molecular detection of fetal chromosomal aneuploidy. Proc Natl Acad Sci USA. 2007;104:13116–13121. doi: 10.1073/pnas.0705765104. [DOI] [PMC free article] [PubMed] [Google Scholar]
- 26.Fan HC, Blumenfeld YJ, El-Sayed YY, Chueh J, Quake SR. Microfluidic digital PCR enables rapid prenatal diagnosis of fetal aneuploidy. Am J Obstet Gynecol. 2009;200:e541–e547. doi: 10.1016/j.ajog.2009.03.002. [DOI] [PMC free article] [PubMed] [Google Scholar]
- 27.Mardis ER. Next-generation DNA sequencing methods. Annu Rev Genomics Hum Genet. 2008;9:387–402. doi: 10.1146/annurev.genom.9.081307.164359. [DOI] [PubMed] [Google Scholar]
- 28.Fan HC, Blumenfeld YJ, Chitkara U, Hudgins L, Quake SR. Noninvasive diagnosis of fetal aneuploidy by shotgun sequencing DNA from maternal blood. Proc Natl Acad Sci USA. 2008;105:16266–16271. doi: 10.1073/pnas.0808319105. [DOI] [PMC free article] [PubMed] [Google Scholar]
- 29.Chiu RW, Chan KC, Gao Y, Lau VY, Zheng W, Leung TY, Foo CH, Xie B, Tsui NB, Lun FM, Zee BC, Lau TK, Cantor CR, Lo YM. Noninvasive prenatal diagnosis of fetal chromosomal aneuploidy by massively parallel genomic sequencing of DNA in maternal plasma. Proc Natl Acad Sci USA. 2008;105:20458–20463. doi: 10.1073/pnas.0810641105. [DOI] [PMC free article] [PubMed] [Google Scholar]
- 30.Robertson KD, Wolffe AP. DNA methylation in health and disease. Nat Rev Genet. 2000;1:11–19. doi: 10.1038/35049533. [DOI] [PubMed] [Google Scholar]
- 31.Scarano MI, Strazzullo M, Matarazzo MR, D'Esposito M. DNA methylation 40 years later: its role in human health and disease. J Cell Physiol. 2005;204:21–35. doi: 10.1002/jcp.20280. [DOI] [PubMed] [Google Scholar]
- 32.Matarazzo MR, De Bonis ML, Gregory RI, Vacca M, Hansen RS, Mercadante G, D'Urso M, Feil R, D'Esposito M. Allelic inactivation of the pseudoautosomal gene SYBL1 is controlled by epigenetic mechanisms common to the X and Y chromosomes. Hum Mol Genet. 2002;11:3191–3198. doi: 10.1093/hmg/11.25.3191. [DOI] [PubMed] [Google Scholar]
- 33.Poon LL, Leung TN, Lau TK, Chow KC, Lo YM. Differential DNA methylation between fetus and mother as a strategy for detecting fetal DNA in maternal plasma. Clin Chem. 2002;48:35–41. [PubMed] [Google Scholar]
- 34.Chim SS, Tong YK, Chiu RW, Lau TK, Leung TN, Chan LY, Oudejans CB, Ding C, Lo YM. Detection of the placental epigenetic signature of the maspin gene in maternal plasma. Proc Natl Acad Sci USA. 2005;102:14753–14758. doi: 10.1073/pnas.0503335102. [DOI] [PMC free article] [PubMed] [Google Scholar]
- 35.Frommer M, McDonald LE, Millar DS, Collis CM, Watt F, Grigg GW, Molloy PL, Paul CL. A genomic sequencing protocol that yields a positive display of 5-methylcytosine residues in individual DNA strands. Proc Natl Acad Sci USA. 1992;89:1827–1831. doi: 10.1073/pnas.89.5.1827. [DOI] [PMC free article] [PubMed] [Google Scholar]
- 36.Herman JG, Jen J, Merlo A, Baylin SB. Hypermethylation-associated inactivation indicates a tumor suppressor role for p15INK4B. Cancer Res. 1996;56:722–727. [PubMed] [Google Scholar]
- 37.Chan KC, Ding C, Gerovassili A, Yeung SW, Chiu RW, Leung TN, Lau TK, Chim SS, Chung GT, Nicolaides KH, Lo YM. Hypermethylated RASSF1A in maternal plasma: a universal fetal DNA marker that improves the reliability of noninvasive prenatal diagnosis. Clin Chem. 2006;52:2211–2218. doi: 10.1373/clinchem.2006.074997. [DOI] [PubMed] [Google Scholar]
- 38.Old RW, Crea F, Puszyk W, Hulten MA. Candidate epigenetic biomarkers for non-invasive prenatal diagnosis of Down syndrome. Reprod Biomed Online. 2007;15:227–235. doi: 10.1016/s1472-6483(10)60713-4. [DOI] [PubMed] [Google Scholar]
- 39.Weber M, Davies JJ, Wittig D, Oakeley EJ, Haase M, Lam WL, Schubeler D. Chromosome-wide and promoter-specific analyses identify sites of differential DNA methylation in normal and transformed human cells. Nat Genet. 2005;37:853–862. doi: 10.1038/ng1598. [DOI] [PubMed] [Google Scholar]
- 40.Papageorgiou EA, Fiegler H, Rakyan V, Beck S, Hulten M, Lamnissou K, Carter NP, Patsalis PC. Sites of differential DNA methylation between placenta and peripheral blood: molecular markers for noninvasive prenatal diagnosis of aneuploidies. Am J Pathol. 2009;174:1609–1618. doi: 10.2353/ajpath.2009.081038. [DOI] [PMC free article] [PubMed] [Google Scholar]
- 41.Livak KJ, Schmittgen TD. Analysis of relative gene expression data using real-time quantitative PCR and the 2−Delta Delta C(T) method. Methods. 2001;25:402–408. doi: 10.1006/meth.2001.1262. [DOI] [PubMed] [Google Scholar]
- 42.Carrel L, Willard HF. X-inactivation profile reveals extensive variability in X-linked gene expression in females. Nature. 2005;434:400–404. doi: 10.1038/nature03479. [DOI] [PubMed] [Google Scholar]
- 43.Newton CR, Graham A, Heptinstall LE, Powell SJ, Summers C, Kalsheker N, Smith JC, Markham AF. Analysis of any point mutation in DNA. The amplification refractory mutation system (ARMS) Nucleic Acids Res. 1989;17:2503–2516. doi: 10.1093/nar/17.7.2503. [DOI] [PMC free article] [PubMed] [Google Scholar]
- 44.Legler TJ, Liu Z, Mavrou A, Finning K, Hromadnikova I, Galbiati S, Meaney C, Hulten MA, Crea F, Olsson ML, Maddocks DG, Huang D, Fisher SA, Sprenger-Haussels M, Soussan AA, van der Schoot CE. Workshop report on the extraction of foetal DNA from maternal plasma. Prenat Diagn. 2007;27:824–829. doi: 10.1002/pd.1783. [DOI] [PubMed] [Google Scholar]
- 45.Chiu RW, Chim SS, Wong IH, Wong CS, Lee WS, To KF, Tong JH, Yuen RK, Shum AS, Chan JK, Chan LY, Yuen JW, Tong YK, Weier JF, Ferlatte C, Leung TN, Lau TK, Lo KW, Lo YM. Hypermethylation of RASSF1A in human and rhesus placentas. Am J Pathol. 2007;170:941–950. doi: 10.2353/ajpath.2007.060641. [DOI] [PMC free article] [PubMed] [Google Scholar]
- 46.Li Y, Holzgreve W, Page-Christiaens GC, Gille JJ, Hahn S. Improved prenatal detection of a fetal point mutation for achondroplasia by the use of size-fractionated circulatory DNA in maternal plasma–case report. Prenat Diagn. 2004;24:896–898. doi: 10.1002/pd.1030. [DOI] [PubMed] [Google Scholar]
- 47.Dhallan R, Au WC, Mattagajasingh S, Emche S, Bayliss P, Damewood M, Cronin M, Chou V, Mohr M. Methods to increase the percentage of free fetal DNA recovered from the maternal circulation. JAMA. 2004;291:1114–1119. doi: 10.1001/jama.291.9.1114. [DOI] [PubMed] [Google Scholar]
- 48.Sandovici I, Kassovska-Bratinova S, Loredo-Osti JC, Leppert M, Suarez A, Stewart R, Bautista FD, Schiraldi M, Sapienza C. Interindividual variability and parent of origin DNA methylation differences at specific human Alu elements. Hum Mol Genet. 2005;14:2135–2143. doi: 10.1093/hmg/ddi218. [DOI] [PubMed] [Google Scholar]
- 49.Esteller M. Cancer epigenomics: dNA methylomes and histone-modification maps. Nat Rev Genet. 2007;8:286–298. doi: 10.1038/nrg2005. [DOI] [PubMed] [Google Scholar]
- 50.Estecio MR, Issa JP. Tackling the methylome: recent methodological advances in genome-wide methylation profiling. Genome Med. 2009;1:106. doi: 10.1186/gm106. [DOI] [PMC free article] [PubMed] [Google Scholar]
- 51.Belin V, Cusin V, Viot G, Girlich D, Toutain A, Moncla A, Vekemans M, Le Merrer M, Munnich A, Cormier-Daire V. SHOX mutations in dyschondrosteosis (Leri-Weill syndrome) Nat Genet. 1998;19:67–69. doi: 10.1038/ng0198-67. [DOI] [PubMed] [Google Scholar]