

Abstract
Cells and organelles are shaped by the chemical and physical forces that bend cell membranes. The human red blood cell (RBC) is a model system for studying how such forces determine cell morphology. It is thought that RBCs, which are typically biconcave discoids, take the shape that minimizes their membrane-bending energies, subject to the constraints of fixed area and volume. However, recently it has been hypothesized that shear elasticity arising from the membrane-associated cytoskeleton (MS) is necessary to account for shapes of real RBCs, especially ones with highly curved features such as echinocytes. In this work we tested this hypothesis by following RBC shape changes using spherical harmonic series expansions of theoretical cell surfaces and those estimated from 3D confocal microscopy images of live cells. We found (i) quantitative agreement between shapes obtained from the theoretical model including the MS and real cells, (ii) that weakening the MS, by using urea (which denatures spectrin), leads to the theoretically predicted gradual decrease in spicule number of echinocytes, (iii) that the theory predicts that the MS is essential for stabilizing the discocyte morphology against changes in lipid composition, and that without it, the shape would default to the elliptocyte (a biconcave ellipsoid), (iv) that we were able to induce RBCs to adopt the predicted elliptocyte morphology by treating healthy discocytes with urea. The latter observation is consistent with the known connection between the blood disease hereditary elliptocytosis and spectrin mutations that weaken the cell cortex. We conclude that while the discocyte, in absence of shear, is indeed a minimum energy shape, its stabilization in healthy RBCs requires the MS, and that elliptocytosis can be explained based on purely mechanical considerations.
Keywords: Membrane mechanics, Spherical harmonics, Hereditary elliptocytosis, Cell morphology
INTRODUCTION
Understanding the chemical and physical forces that lead to the curvature of cell membranes and consequently the morphology of cells and organelles is a major open question in cell biology.11,32,43 The mammalian red blood cell (RBC) is a good model for studying cell membranes19 because it lacks a nucleus, internal organelles and large cytoskeletal structures. Human RBCs, which circulate in the body for about 120 days, are normally biconcave discocytes with a diameter of ~8 μm, a surface area of ~140 μm2 and a volume of ~100 μm3.12 The excess surface area of RBCs (which gives them the flattened shape), together with the elasticity of their membranes, provides RBCs with the flexibility needed to pass through the capillaries. The cell membrane is composed of a lipid bilayer, with embedded membrane proteins, and associated with it from the cytoplasmic side is a network of proteins comprising the membrane cytoskeleton (MS).1 Under the influence of a variety of agents, shapes other than the discocyte can be observed. Examples are the stomatocyte and the echinocyte (Fig. 1a). In addition, genetic defects may result in pronounced morphological changes. For example, mutations in spectrin, a principal component of the MS, may lead to hereditary elliptocytosis in which the RBC assumes a biconcave elliptocytic morphology.7
FIGURE 1.
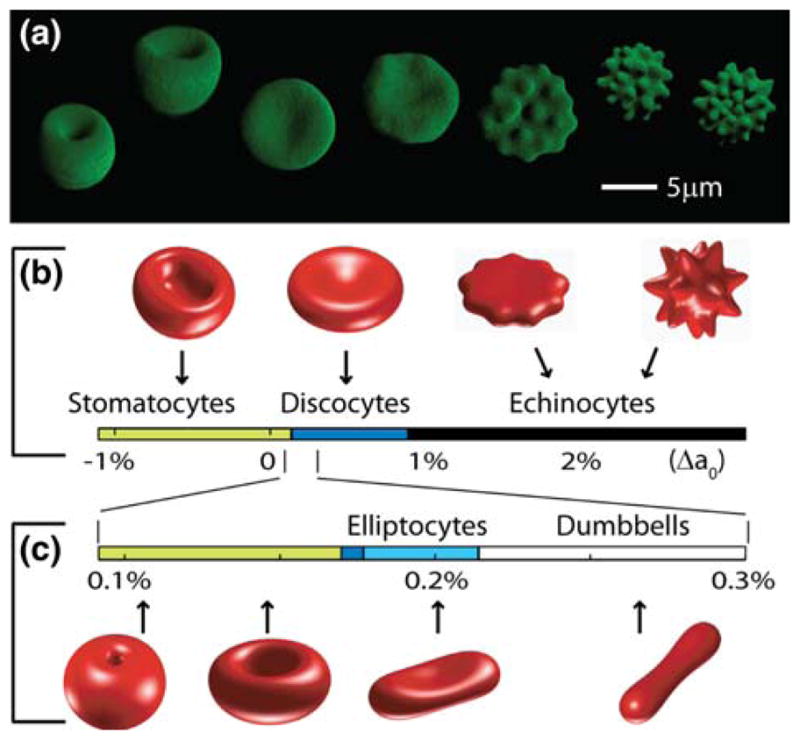
Human RBC images and theoretical shape predictions with and without a membrane cytoskeleton. (a) 3D confocal images of the canonical shapes of RBCs in different concentrations (in mM) of NaCl: from left to right: 55, 80 (two stomatocytes—cup-shaped cells), 154 (one discocyte—biconcave disc), 200, 250, 300, and 350 mM NaCl (four echinocytes—spiculated cells). (b) Theoretical minimum energy shapes with area 140 μm2, volume 100 μm3 and membrane skeleton (MS) shear modulus 2.5 μJ/m2, calculated for increasing preferred area difference Δa0. (c) Same as b, but in the absence of a MS. Beyond the right and left limits budding and membrane internalization are predicted, respectively.
The finding that mutations in membrane-associated proteins such as spectrin, ankyrin and band 3 lead to RBC shape aberrations40 suggests that the shape of the red blood cell is specified by the membrane skeleton. Yet there is a large physics literature, starting with the pioneering work of Helfrich,8 that the normal red blood cell, which has a biconcave discoidal morphology, (Fig. 1a, third cell from the left), qualitatively resembles a surface that minimizes the bending energy of a pure lipid membrane (i.e., no membrane cytoskeleton) given constraints of fixed volume, area and spontaneous curvature of the lipid molecules. This purely lipid-based theory (the Helfrich model, also called spontaneous curvature model) can also account for other membrane morphologies such as the stomatocyte (Fig. 1a, left), the swollen red blood cell that can be induced by placing cells in hypotonic solutions and that is seen in some hereditary blood diseases.40 Discocytic and stomatocytic morphologies can be induced in liposomes,20 membrane vesicles that contain no skeleton, showing that the membrane skeleton is not essential for these morphologies. However, the pure lipid-based theory cannot easily account for other morphologies such as the echinocyte (Fig. 1a, right), a highly spiculated RBC morphology induced by hyperosmotic solutions or by incorporating excess lipid into the outer leaflet of the membrane bilayer30: the Helfrich model (as well as its successor the bilayer-couple model35,36 which includes the effect of a fixed distance between the two bilayer leaflets) predicts that the minimum energy shape corresponds to other shapes such as dumbbells or even the fission of the cell into two cells depending on ratio of area to volume.18,27,34 These arguments have led to the augmentation of the lipid-based models to include the material properties of the MS and its association with the lipid bilayer.3,21,26,37 This has lead to the hypothesis that the function of the membrane-associated cytoskeleton is to protect the cell against vesiculation,33 which is observed in some hereditary blood diseases.40
To test this and other hypotheses for the mechanical basis of RBC morphology, we have taken a combined experimental and computational approach. Until now, comparison between observed red blood cells and predicted shapes has been qualitative in the sense that images, such as those obtained by scanning electron microscopy, are compared subjectively to predicted shapes. In order to make quantitative comparisons between experiment and theory, we have used a spherical-harmonics parameterization (SHP) to find the “best-fit” surface from confocal stacks of fluorescently labeled RBCs,22 and compared them with theoretical calculations with and without the MS. We show that the SHP is an ideal tool for freely exploring the full parameter space needed for predicting theoretical shapes with no restriction in symmetry. Using this technique we have compared the theoretical models with and without the MS, and have made a novel prediction (to the best of our knowledge) that the MS is essential for stabilizing the discocyte morphology against changes in lipid composition of the bilayer. Moreover, our calculations show that the predicted “default” shape that a discocyte would change to, if it lost the MS, is the elliptocyte. This is in accord with the known mutation in spectrin that causes the disease hereditary elliptocytosis, and in our view suffices to explain this disease, using purely mechanical considerations. As an additional confirmation, we treated healthy discocytes with urea, which is expected to weaken the MS, and indeed obtained elliptocytes.
THEORY
The idea behind the physical theories is that the shape of a RBC corresponds to a surface that minimizes the mechanical energy (E) of a deformed lipid bilayer/membrane skeleton composite. This energy, for a cell not subject to external forces, includes contributions from the bending resistance of the plasma membrane (Eb, the Helfrich energy8), the resistance of the bilayer to adopting a shape whose difference in area between the outer and inner leaflets (ΔA) deviates from the unstressed area difference (ΔA0) (EAD,18), and the resistance of the membrane skeleton to stretching and shearing (EMS,26):
| (1) |
κb is the bending elastic modulus that determines the energy cost of bending the membrane away from its preferred or spontaneous curvature C0. is the mean curvature, where R1 and R2 are the radii corresponding to the two principal curvatures. A is the total surface area of the membrane. κ̄ is the area-difference elastic modulus that determines the energy cost of the deviation in area difference from the preferred area difference. D is the separation between the two bilayer leaflets. EMS is defined in the Methods. The minimum is found under constraints of constant A and volume (V). It should be noted that Eq. (1) includes parameters under cellular control; C0 depends on the bilayer lipid composition (e.g., a conically shaped lipid in the outer membrane would induce positive curvature), ΔA0 depends on the number of lipids in each leaflet (regulated by flippases9), and V is regulated indirectly through ion pumps.
Excluding the membrane skeleton term (EMS), all but two of the parameters in Eq. (1) either denote physical quantities (κb, κ̄, D) or properties that can be calculated from the shape (H, A, ΔA). The two exceptions are the spontaneous curvature (C0) and the area difference (ΔA0), and it appears that they correspond to two free variables. However, these two parameters are not independent.36 For example, if a bilayer contains lipids with a preferred curvature in one leaflet, the effect on the geometry (i.e., the tendency to curve the membrane) can be completely canceled by adding or removing lipid from one of the leaflets. Conversely, if a patch of bilayer has a difference in the area between the two leaflets then one could—in principle—change the spontaneous curvature of the lipids to cancel the effect of the area difference on the geometry. The two parameters can therefore be combined into a single free parameter, Δa0 = ΔA0/A + κbDC0/πκ̄, the preferred area difference33 (See Supporting Information). Δa0 can be altered by a variety of agents that affect lipid geometry (e.g., salt concentration and pH) or relative numbers of lipids in the bilayer leaflets (e.g., addition of lipids or their removal through lipid-binding agents such as BSA).
A problem with the physical theories is that calculating the minimum energy surfaces using Eq. (1) is difficult. Early attempts were limited to rotationally symmetric morphologies8,34 and this is clearly inadequate for complex morphologies such as elliptocytes and echinocytes. More recent work has overcome this limitation by modeling cell surfaces explicitly,26,42 but the computations become CPU inefficient and mesh-resolution dependent. To facilitate the generation of minimum energy shapes, we have taken advantage of the power of the spherical harmonics parameterization4,22 to describe succinctly surfaces that are topologically equivalent to the sphere, which is the case for most cells. This parameterization is economical, leads to shapes invariant of position, orientation and scale (and so captures the essence of a morphology), and can be used to easily calculate geometric properties such as volume, area, and curvature. Furthermore, there is a natural metric for quantifying the similarity between two shapes, i.e. “shape correspondence.”22
Minimum energy shapes were calculated using Eq. (1) with constraints of fixed area, volume and normalized preferred area difference (Δa0). This leads to the various shapes shown in Fig. 1b. As Δa0 is increased, the minimum energy shape changes from a stomatocyte through a discocyte to an echinocyte. The shapes in Fig. 1b resemble qualitatively the real RBCs shown in Fig. 1a. This confirms that inclusion of the mechanical properties of the membrane skeleton (EMS) leads to minimum energy shapes that are in qualitative agreement with experimental observations.26
In the absence of the membrane skeleton, the theory predicts that the discocyte can only accommodate a limited range of increased area difference. Increasing Δa0 produces a biconcave ellipsoid (the elliptocyte) and then a dumbbell (Fig. 1c). Still further increase is expected to lead to vesiculation.27 Shapes similar to those in Fig. 1c, as well as vesiculation, have been observed with pure lipid bilayer vesicles.20 By contrast, echinocytes have not been observed with pure lipid vesicles, presumably because the stiffness of the membrane skeleton is needed to prevent the spicules of echinocytes from budding off.
In addition to being necessary for stabilizing the echinocyte morphology, we discovered that the membrane skeleton plays an important role in stabilizing the discocyte morphology. In the presence of a membrane skeleton, discocytes are present as Δa0 ranges from 0.14 to 0.89%, corresponding to a 0.75% relative deviation in areas of the lipids in the two leaflets of the bilayer from the preferred area (Fig. 1b). Our modeling showed that this wide range did not depend on whether the underlying (undeformed) shape of the MS was oblate (as shown here), prolate, or discocytic (data not shown). By contrast, in the absence of a membrane skeleton, this range is reduced by about one-hundred fold (Fig. 1c), indicating that in this case the discocyte morphology should be highly susceptible to changes in interleaflet lipid composition.
METHODS
RBC Preparation and Imaging
RBCs (group 0, Rh positive) freshly obtained from a finger prick were diluted into cell buffer (154 mM NaCl, 10 mM Hepes, 0.1% glucose, pH 7.4) immediately after drawing. The suspension was segregated by density using a Percoll gradient, and RBCs corresponding to middle age (i.e., found in the middle of the density gradient column) were used to reduce morphological variation. For fluorescence imaging, cells were labeled using Calcein and DiI to mark the cytoplasm and plasma membrane respectively. Slides and coverslips were coated with bovine serum albumin (BSA) in order to prevent adhesion and echinocytosis upon contact with the glass surface.
Shape Parameterization
We parameterized the cell contour for both theoretical calculations and for fitting 3D image data4 using expansions of the Cartesian coordinates of the surface S(x, y, z) in spherical harmonic basis functions YLK(θ, φ), , and similarly for y and z, where L and K are integers with −L ≤ K ≤ L, and 0 ≤ L ≤ Lmax, θ and ϕ are the usual spherical polar coordinate angles and Lmax the highest expansion order. The three sets of expansion coefficients ( ) completely define the shape. Lmax was set to 12 for the shapes in Fig. 1 and to 16 for all other shapes in this work. The value was kept high enough to assure that coefficients corresponding to the highest L values had negligible values throughout. To measure the correspondence between two shapes a and b we calculate a shape correlation coefficient 0<Ra,b ≤ 1 as where N = 3 × (Lmax + 1)2 is the total number of coefficients that describe a shape, the Ca,is and Cb,is represent the ith corresponding shape coefficients that have been transformed into their translational and rotational invariant form. The above parametric shape description is free of the limitation that the shape must contain a point inside that “sees” every point on the surface without crossing the surface, as is the case with conventional (direct) spherical harmonic radial function expansions,17 is suitable for large surface area-to-volume ratios and is significantly more economical (a discocyte can be described by 4 non-zero shape descriptors only).
3D Image Analysis
The cell outline was initially obtained using the Laplacian of Gaussian zero-crossing method31 and surface triangulated using the marching cubes algorithm.28 The surface was subsequently mapped uniformly onto the unit sphere.4 Using linear least squares, the CLKs corresponding to the x, y, and z coordinates associated with each vertex were determined. This initial parameterization was then refined using unconstrained nonlinear least-squares fitting in image space by convolving the shape corresponding to a given set of CLKs with the experimentally determined point spread function. The fitting problem is ill-posed (i.e., will not converge to the correct solution without additional information because it would try to fit the noise), so we introduced a smoothing functional weighted by the regularizing parameter γ. The smoothing functional was set to be proportional to the first term in Eq. (1) (i.e., the pure bending energy). An L-curve was then calculated to determine the optimal γ graphically.15 Confidence limits on the obtained parameters were calculated from the covariance matrix of the estimates at the solution.
Shape Energy Calculation
ΔA in Eq. (1) was calculated as ΔA = D ∮ (2H)dA, and other values for constants used were26 κb = 2.0 × 10⁻¹⁹ J, κ̄/κb = 2/π, and D = 3 nm. The membrane skeleton energy included nonlinear terms that have been shown theoretically to correspond to stiffening of the MS at high deformations,26
where α = λ1λ2 −1 and β = (λ1 − λ2)2/2λ1λ2 are the local area and shear strain invariants, and λ1,2 are the local principal stretches.13 Kα and μ are the linear elastic moduli for stretch and shear, respectively and unless stated otherwise μ = Kα/2 = 2.5 × 10⁻¹⁸ J/μm2.16 The nonlinear coefficients a3, a4, b1 and b2 were given the values −2, 8, 0.7, and 0.75. The integration was performed over the undeformed shape So, which was assumed to be an oblate ellipsoid that has the same A as the shape, but with a reduced volume vo = V/Vsphere = 0.95. Using sequential quadratic programming,5,39 minimum-energy shapes were obtained by minimizing Eq. (1), under constraints of A and V, for given . The minimum energy shape was assumed stable if the extremum of the energy was a minimum with respect to variations of the CLKs.18
EXPERIMENTAL RESULTS
Quantitative Comparison of RBC Morphologies with Predicted Shapes
To test the energy-minimization model for RBC morphology (Eq. 1), we compared quantitatively the predicted shapes with the shapes of real cells. We incubated human red blood cells (obtained from a healthy 30-year-old male) in buffers with differing salt concentrations to obtain stomato-, disco- and echinocytes that were imaged by 3D confocal microscopy (Fig. 2a). The images were segmented to provide an initial estimate of the cell surface (Fig. 2b, c). To compare quantitatively the noisy confocal data with the shapes predicted by the model, we again took advantage of the spherical harmonics parameterization. The measured cells were represented as spherical harmonic functions by fitting the confocal data to trial shapes convolved with the point-spread function of the microscope using regularization (Supplementary Figure S1A, B). This procedure22 effectively low-pass filters the cell-shape to reduce the experimental noise (Fig. 2d–f) and produces smoothed shapes (for method validation see Supplementary Figure S1D).
FIGURE 2.

Imaged RBCs analysis. (a) Confocal intensity image stack of a fluorescently membrane-labeled stomatocyte at [NaCl] = 80 mM. Each frame is 12.8 × 12.8 μm2, with a z-separation of 0.15 μm. (b) Surface triangulation of a thresholded discocyte at [NaCl] = 154 mM (physiological). (c) An echinocyte surface. (d–f), Estimated cell surfaces (see Methods) corresponding to shapes a–c with areas and volumes: stomatocyte (120 ± 3 μm2, 97 ± 2 μm3), discocyte (151 ± 3 μm2, 98 ± 2 μm3), echinocyte (165 ± 2 μm2, 109 ± 2 μm3) (mean ± SEM). (g–i) Best theoretically fitted shapes, at same A and V as (d–f), varying Δa0, which gave values of −0.4%, 0.12 and 0.17%, respectively.
From these smoothed shapes, we can estimate A and V. However, we have no way of determining Δa0 independently. In order to compare our shapes to the theory, we fit the shapes to Eq. (1) (using the same area and volume) (Fig. 2g–i) by varying the free parameter Δa0 (Supplementary Figures S1C and S2). Because we are expressing both the theoretically predicted shapes and the surfaces estimated from the 3D images, using the same shape parameterization, we are in a position to quantitatively match the shapes based on the values of the shape coefficients directly. The agreement between theory and measurement for the 17 cells analyzed in detail was very good (nine discocytes, four stomatocytes, two echinocytes and two elliptocytes). We found that a generalized shape correlation coefficient based on shape distance (defined in methods) had values ≥0.97. This confirms that the theoretical model associated with Eq. (1), and which includes a MS term, is able to account quantitatively for the shapes of a wide variety of real RBCs.
Disrupting the Membrane Skeleton
As another method to perturb RBC shape, in addition to ionic strength change, we used urea,2 which can cross the cell membrane and probably weakens the membrane skeleton.23 Consistent with this, urea disassembles the MS of demembranated RBCs as judged by light microscopy (Fig. 3a, Supplementary Movie). We also confirmed that addition of urea disrupted the MS even when it was added prior to demembranation (Supplementary Figure S3). A candidate target of urea is spectrin which unfolds at significantly lower urea concentrations29 than other RBC proteins such as ankyrin10,38 and band 3.41 However, we cannot rule out the possibility that urea also affects the mechanical properties of the MS through non-spectrin proteins.
FIGURE 3.

Urea disrupts the membrane skeleton and changes echinocyte shape. (a) Treatment of a demembranated RBC with urea and imaged by phase contrast microscopy. Left panel: intact discocyte. Middle panel: after addition of 0.1% Triton X-100 to remove the membrane, which reveals the (contracted) MS. Right panel: after addition of 0.136 M urea. See also Supplementary Movie 1. (b) Box plots show the number of spicules of echinocyte type I shapes as a function of urea concentration (lower x-axis) measured from phase contrast images (examples of which are shown on left). To induce control (no urea) type I echinocytes, RBCs in physiological buffer were transferred to a chamber whose cover-glass surface was coated with F127 (Sigma). Other echinocytes were induced by incubation in the stated urea concentration for 25 min prior to being returned to physiological buffer in a chamber whose surface was coated with fatty-acid-free BSA. The boxes show limits of lower 25% and upper 75% of data points and the whiskers represent the data range. The numbers refer to the number of cells. At 3.3 M urea, cells fragmented and no echinocyte type I cells could be identified. Filled circles (associated with the upper x-axis) represent the theoretically predicted number of spicules that echinocyte type I shapes should have when calculated using Eq. (1) within the range of 0.1% <Δa0 < 2.0%. Some example predicted shapes are shown at right. The upper x-axis shows the values of shear modulus used to calculate the minimal energy shapes according to Eq. (1). Relative positioning of the two x-axes is justified as follows: at 3.3 M urea cells completely fragment, and spectrin is known to be denatured to more than 50%,29 so we assumed the shear modulus was zero. In the absence of urea, the shear modulus corresponds to that measured for spectrin networks on normal cells.25 (c) The effect of urea on discocytes under different NaCl concentrations. Left panels: a field of mainly discocytes in physiological buffer before and after augmentation with 1.24 M urea. Right panels: after incubation in 40 mM NaCl buffer augmented with 1.25 M urea the discocyte became a dumbbell and then vesiculated.
To quantitate the effect of urea on the mechanical properties of the MS, we studied its effect on the shapes of type I echinocytes, flattened echinocytes whose spicules lie in one plane (examples in Figs. 1a and 1b) and are therefore easy to count. In our simulations we found that the number of spicules is predicted to change in a graded manner as the shear and stretch moduli of the MS are decreased. This is in accord with a previous study that used a simplified shape model specific to echinocytes.33 Specifically, as the shear and stretch moduli are decreased from their measured values16 to zero, the number of spicules is predicted by Eq. (1) to decrease from about 10 to 0 (Fig. 3b right-hand images, circles). In order to test this prediction, we prepared echinocyte I RBCs and incubated them in solutions of increasing urea concentration before returning them to physiological buffer. The number of observed spicules decreased as the urea concentration was increased (Fig. 3b left-hand images, box plots) as expected if the moduli decreased. This experiment shows that the effect of urea can be accounted for by a reduction in the stretch and shear modulus of the membrane.
Having established that urea weakens the MS, we studied its effect on the discocyte morphology. Discocytes were incubated in 1.24 M urea in physiological buffer for ~10 min. This treatment led to vesiculation (Fig. 3c, left panels), as expected if the urea removed the MS and Δa0 was ≥0.3% (Fig. 1c). Incubation in urea at low salt also led to vesiculation (Fig. 3c, right panels). These observations show that the MS stabilizes the discocytic shape at values of Δa0 that would be expected to result in different morphologies if there were no MS. This suggests that the MS stabilizes the discocytic shape against asymmetric changes in lipid bilayer area (i.e., changes in Δa0).
Shape Changes Induced by BSA
In order to further test the hypothesis that the membrane skeleton stabilizes cell shape against changes in lipid bilayer area asymmetry, we treated RBCs with fatty-acid-free bovine serum albumin (BSA), which binds lipids.24 BSA has been assumed in the literature to remove lipids from the outer leaflet.6 This would decrease the value of Δa0. Because the evidence that BSA removes outer-membrane lipids is indirect, we performed a more direct control experiment and confirmed that BSA can indeed remove outer-membrane lipids (Fig. 4a). Normal discocytes (in the absence of urea) were labeled with a fluorescent lipid that was expected to remain in the outer leaflet due to the large size of the fluorescent group. The labeling induced an echinocytic morphology (Fig. 4a, first and second panels,23,30) as expected if the added lipid increased Δa0 (Fig. 1b, right). Subsequently fatty-acid free BSA was added to the solution. The fluorescent label was observed to be removed (Fig. 4a, third panel), and the morphology changed to that of a stomatocyte (Fig. 4a, right panel). The fluorescence decrease shows that BSA removed the added lipid from the outer leaflet (i.e., decreases Δa0), and the associated morphological change suggests that BSA removes not just the exogenous lipid but also some endogenous outer membrane lipid.6
FIGURE 4.
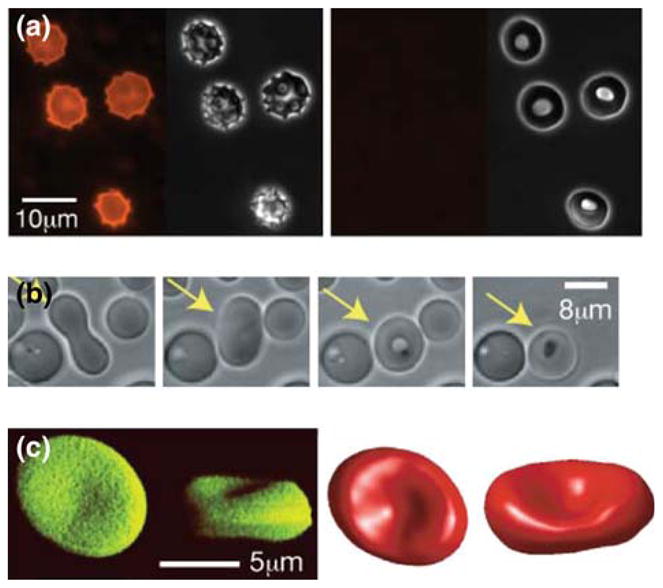
BSA alters lipid bilayer asymmetry and together with urea induces formation of elliptocytes. (a) Bovine serum albumin (BSA) removes lipid from the outer leaflet of the bilayer. Discocytes were treated with 3.3 μg/mL of the fluorescent lipid C16-Liss-Rhod-lysoPE, expected to remain in the outer leaflet. Consistent with this, the morphology changed to an echinocyte (left panels, fluorescence and phase contrast). After addition of 1.18% fatty-acid-free BSA, the fluorescent label was removed (right panel, fluorescence) and cells changed to stomatocytes (right panel, phase contrast). (b) After addition of 0.15% BSA, an RBC (yellow arrow) that has been treated with urea (1.1 mM urea for 60 min) undergoes a series of shape changes from dumbbell (left, time 0 s), elliptocyte (2nd from left, 58 s) through to stomatocyte (3rd from left, 62 s). (c) Reconstructions of a 3D confocal image of an elliptocyte (RBCs treated with a solution of 1.1 M urea, 65.5 mM NaCl and 12.8 mM sucrose); left (green) top and perspective intensity projections, right (red) top and perspective views of best estimated surface.
Having established that fatty-acid free BSA can remove outer membrane lipids and decrease Δa0, we investigated the effect of BSA on the morphology of urea-treated RBCs. Over time after the BSA was added, urea-treated cells gradually changed from dumbbells to elliptocytes, passed briefly through discocytes and stomatocytes before vesiculating internally (Fig. 4b). This is identical to the sequence of morphologies expected if urea treatment of RBCs made them behave like pure bilayer vesicles (Fig. 1c) and fatty-acid free BSA reduces Δa0. The similarity of the observed shape changes to the one predicted in the absence of a MS provides further evidence that urea does indeed remove the mechanical contribution of the MS to RBC morphology, though we cannot rule out the possibility that the removal of the MS by urea or that urea itself has a secondary effect on cell morphology.
Fatty-acid free BSA has a more pronounced effect on the shape of urea-treated RBCs than on untreated RBCs. After urea-treatment, the transition from discocyte to stomatocyte in 0.01% BSA took less than 1 min (data not shown) and led quickly to vesiculation (within another minute); we observed some variability in the RBCs response to this treatment especially variability in delays among morphological changes of different cells, even though we tried to minimize variability by centrifugation to separate cells of similar density and age (see Methods). In untreated cells, the transition was much slower though (from 2 to 5 min) and no vesiculation was observed even after 20 min. Thus urea makes the shape of RBCs more susceptible to changes in outer membrane area.
Formation of Elliptocytes by Urea Treatment
It is known that the human blood disease hereditary elliptocytosis is caused by a mutation in spectrin that prevents the proper head-to-head association of spectrin dimers to form the heterotetramers that make up the spectrin network.7 That the mutation leads to a mechanical weakening of the MS is in accord with our theoretical prediction of an elliptocytic morphology in the absence of a MS (Fig. 1c). To obtain additional evidence that elliptocytosis can be explained solely on the basis of cell mechanics, we confirmed by spherical harmonic analysis of confocal microscope images that biconcave elliptocytes can indeed be observed after urea treatment of freshly prepared discocytes (Fig. 4c). Importantly, the value of Δa0 (=0.21%) that we obtained by analyzing 3D imaged elliptocytes using a model lacking the MS (Supplementary Figure 2), corresponds to a discocyte morphology if the MS were present (Fig. 1b and Supplementary Figure 1C). In other words, the membrane asymmetry of our discocytes would lead to a default shape being an elliptocyte if it were not for the membrane skeleton.
DISCUSSION
We have explored the mechanical basis underlying RBC morphology by comparing theoretical predictions with 3D imaging of live cells. Using a new computational approach for the quantitative analysis of cellular shape, the spherical harmonic parameterization, we showed that the MS can account quantitatively for a wide range of RBC morphologies induced by changes in buffer NaCl and addition of urea and BSA.
We found theoretical and experimental support for the hypothesis that the membrane-associated cytoskeleton is important for stabilizing the shape of RBC against perturbations such as asymmetric changes in lipid bilayer composition. Our theoretical modeling showed that in the absence of the membrane skeleton, the discocyte is the minimum energy shape only over a very small range of Δa0. But in the presence of the MS, the discocyte is predicted to be a minimum-energy shape over a ~100-fold larger range of Δa0, consistent with a stabilizing function for the MS. In addition, we showed experimentally that urea-treated cells, unlike normal cells, are highly susceptible to BSA, which extracts lipids from the outer leaflet and decreases the area difference.
These observations suggest that one of the functions of the membrane skeleton is shape homeostasis, i.e., buffering the cell shape against lipid perturbations. Such perturbations occur when lipids enter or leave the outer leaflet from the blood plasma or translocate across the bilayer into or out of the inner leaflet. Such a homeostatic function may be important for RBCs whose lipid composition depends for example on diet.14 When the shape buffering capacity is lost, for example in blood diseases such as hereditary elliptocytosis, the shape of the red blood cells reverts to a new default shape, the elliptocyte, whose morphology we have been able to mimic in vitro. The mechanical interaction between the lipid bilayer and the cytoskeletal structural proteins may be important in other blood cell dysmorphologies, such as in hereditary pyropoikilocytosis and spherocytosis, and shape homeostasis may be a widespread function of the cell cortex.
Supplementary Material
Acknowledgments
We thank Britta Schroth-Diez for help in early stages of this project, Marzuk Kamal for providing the lysoPE, the MPI-CBG Light Microscopy Facility, and members of the Howardlab for comments on earlier drafts of the manuscript.
ABBREVIATIONS
- RBC
Red blood cell
- MS
Membrane skeleton
- BSA
Bovine serum albumin
Footnotes
ELECTRONIC SUPPLEMENTARY MATERIAL
The online version of this article (doi:10.1007/s12195-008-0019-5) contains supplementary material, which is available to authorized users.
OPEN ACCESS
This article is distributed under the terms of the Creative Commons Attribution Noncommercial License which permits any noncommercial use, distribution, and reproduction in any medium, provided the original author(s) and source are credited.
References
- 1.Bennett V, Baines AJ. Spectrin and ankyrin-based pathways: metazoan inventions for integrating cells into tissues. Physiol Rev. 2001;81(3):1353–1392. doi: 10.1152/physrev.2001.81.3.1353. [DOI] [PubMed] [Google Scholar]
- 2.Bessis M. Living Blood Cells and their Ultrastructure. New York: Springer; 1973. [Google Scholar]
- 3.Bobrowska-Hagerstrand M, Hagerstrand H, Iglic A. Membrane skeleton and red blood cell vesiculation at low pH. Biochim Biophys Acta. 1998;1371(1):123–128. doi: 10.1016/s0005-2736(98)00011-x. [DOI] [PubMed] [Google Scholar]
- 4.Brechbühler C, Gerig G, Kuebler O. Parametrization of closed surfaces for 3-D shape description. Comput Vision Image Underst. 1995;61(2):154–170. [Google Scholar]
- 5.Coleman TF, Li Y. An interior trust region approach for nonlinear minimization subject to bounds. SIAM J Optimiz. 1996;6(2):418–445. [Google Scholar]
- 6.Connor J, Pak CH, Zwaal RF, Schroit AJ. Bidirectional transbilayer movement of phospholipid analogs in human red blood cells Evidence for an ATP-dependent and protein-mediated process. J Biol Chem. 1992;267(27):19412–19417. [PubMed] [Google Scholar]
- 7.Delaunay J. The molecular basis of hereditary red cell membrane disorders. Blood Rev. 2007;21(1):1–20. doi: 10.1016/j.blre.2006.03.005. [DOI] [PubMed] [Google Scholar]
- 8.Deuling HJ, Helfrich W. Red blood cell shapes as explained on the basis of curvature elasticity. Biophys J. 1976;16(8):861–868. doi: 10.1016/S0006-3495(76)85736-0. [DOI] [PMC free article] [PubMed] [Google Scholar]
- 9.Devaux PF. Static and dynamic lipid asymmetry in cell membranes. Biochemistry. 1991;30(5):1163–1173. doi: 10.1021/bi00219a001. [DOI] [PubMed] [Google Scholar]
- 10.Devi VS, Binz HK, Stumpp MT, Plueckthun A, Bosshard HR, Jelesarov I. Folding of a designed simple ankyrin repeat protein. Protein Sci. 2004;13:2864–2870. doi: 10.1110/ps.04935704. [DOI] [PMC free article] [PubMed] [Google Scholar]
- 11.Elgsaeter A, Stokke B, Mikkelsen A, Branton D. The molecular basis of erythrocyte shape. Science. 1986;234:1217–1223. doi: 10.1126/science.3775380. [DOI] [PubMed] [Google Scholar]
- 12.Evans E, Fung YC. Improved measurement of the erythrocyte geometry. Microvasc Res. 1972;4:335–347. doi: 10.1016/0026-2862(72)90069-6. [DOI] [PubMed] [Google Scholar]
- 13.Evans EA, Skalak R. Mechanics and Thermodynamics of Biomembranes. Boca Raton, FL: CRC; 1980. [Google Scholar]
- 14.Farquhar JW, Ahrens EH., Jr Effects of dietary fats on human erythrocyte fatty acid patterns. J Clin Invest. 1963;42:675–685. doi: 10.1172/JCI104759. [DOI] [PMC free article] [PubMed] [Google Scholar]
- 15.Hansen PC. Analysis of discrete ill posed problems by means of the L-curve. SIAM Rev. 1992;34:561–580. [Google Scholar]
- 16.Hansen JC, Skalak R, Chien S, Hoger A. An elastic network model based on the structure of the red blood cell membrane skeleton. Biophys J. 1996;70(1):146–166. doi: 10.1016/S0006-3495(96)79556-5. [DOI] [PMC free article] [PubMed] [Google Scholar]
- 17.Heinrich V, Brumen M, Heinrich R, Svetina S. Nearly spherical vesicle shapes calculated by use of spherical harmonics: axisymmetric and non-axisymmetric shapes and their stability. J Phys II. 1992;2:1081–1108. [Google Scholar]
- 18.Heinrich V, Svetina S, Zeks B. Non-axisymmetric vesicle shapes in a generalized bilayer-couple model and the transition between oblate and prolate axisymmetric shapes. Phys Rev E. 1993;48(4):3112–3123. doi: 10.1103/physreve.48.3112. [DOI] [PubMed] [Google Scholar]
- 19.Hoffman J. Questions for red blood cell physiologists to ponder in this millennium. Blood Cells Mol Dis. 2001;27(1):57–61. doi: 10.1006/bcmd.2000.0351. [DOI] [PubMed] [Google Scholar]
- 20.Hotani H. Transformation pathways of liposomes. J Mol Biol. 1984;178:113–120. doi: 10.1016/0022-2836(84)90234-1. [DOI] [PubMed] [Google Scholar]
- 21.Iglic A. A possible mechanism determining the stability of spiculated red blood cells. J Biomech. 1997;30(1):35–40. doi: 10.1016/s0021-9290(96)00100-5. [DOI] [PubMed] [Google Scholar]
- 22.Khairy K, Howard J. Spherical harmonics-based parametric deconvolution of 3D surface images using bending energy minimization. Med Image Anal. 2008;12:217–227. doi: 10.1016/j.media.2007.10.005. [DOI] [PubMed] [Google Scholar]
- 23.Khodadad JK, Waugh RE, Podolski JL, Josephs R, Steck TL. Remodeling the shape of the skeleton in the intact red cell. Biophys J. 1996;70(2):1036–1044. doi: 10.1016/S0006-3495(96)79649-2. [DOI] [PMC free article] [PubMed] [Google Scholar]
- 24.Kinsella JE, Whitehead DM. Proteins in whey: chemical, physical, and functional properties. Adv Food Nutr Res. 1989;33:343–438. doi: 10.1016/s1043-4526(08)60130-8. [DOI] [PubMed] [Google Scholar]
- 25.Lenormand G, Henon S, Richert A, Simeon J, Gallet F. Direct measurement of the area expansion and shear moduli of the human red blood cell membrane skeleton. Biophys J. 2001;81:43–56. doi: 10.1016/S0006-3495(01)75678-0. [DOI] [PMC free article] [PubMed] [Google Scholar]
- 26.Lim HWG, Wortis M, Mukhopadhyay R. Stomatocyte-discocyte-echinocyte sequence of the human red blood cell: evidence for the bilayer- couple hypothesis from membrane mechanics. Proc Natl Acad Sci USA. 2002;99(26):16766–16769. doi: 10.1073/pnas.202617299. [DOI] [PMC free article] [PubMed] [Google Scholar]
- 27.Lipowsky R. The conformation of membranes. Nature. 1991;349:475–481. doi: 10.1038/349475a0. [DOI] [PubMed] [Google Scholar]
- 28.Lorensen WE, Cline HE. A high resolution 3D surface construction algorithm. Comput Graph. 1987;21(4):163–169. [Google Scholar]
- 29.MacDonald RI, Cummings JA. Stabilities of folding of clustered, two-repeat fragments of spectrin reveal a potential hinge in the human erythroid spectrin tetramer. Proc Natl Acad Sci USA. 2004;101(6):1502–1507. doi: 10.1073/pnas.0308059100. [DOI] [PMC free article] [PubMed] [Google Scholar]
- 30.Marikovsky Y, Brown CS, Weinstein RS, Wortis HH. Effects of lysolecithin on the surface properties of human erythrocytes. Exp Cell Res. 1976;98(2):313–324. doi: 10.1016/0014-4827(76)90443-2. [DOI] [PubMed] [Google Scholar]
- 31.Marr D, Hildreth EC. Theory of edge detection. Proc R Soc Lond Ser B. 1980;207:187–217. doi: 10.1098/rspb.1980.0020. [DOI] [PubMed] [Google Scholar]
- 32.McMahon HT, Gallop JL. Membrane curvature and mechanisms of dynamic cell membrane remodelling. Nature. 2005;438(7068):590–596. doi: 10.1038/nature04396. [DOI] [PubMed] [Google Scholar]
- 33.Mukhopadhyay R, Lim HWG, Wortis M. Echinocyte shapes: bending, stretching, and shear determine spicule shape and spacing. Biophys J. 2002;82(4):1756–1772. doi: 10.1016/s0006-3495(02)75527-6. [DOI] [PMC free article] [PubMed] [Google Scholar]
- 34.Seifert U, Berndl K, Lipowsky R. Shape transformations of vesicles: phase diagram for spontaneous-curvature and bilayer-coupling models. Phys Rev A. 1991;44(2):1182–1202. doi: 10.1103/physreva.44.1182. [DOI] [PubMed] [Google Scholar]
- 35.Sheetz MP, Singer SJ. Biological membranes as bilayer couples. Proc Natl Acad Sci USA. 1974;71:4457–4461. doi: 10.1073/pnas.71.11.4457. [DOI] [PMC free article] [PubMed] [Google Scholar]
- 36.Svetina S, Brumen M, Zeks B. Lipid bilayer elasticity and the bilayer couple interpretation of red cell shape transformations and lysis. Stud Biophys. 1985;110:177–187. [Google Scholar]
- 37.Svetina S, Iglic A, Kralj-Iglic V, Zeks B. Cytoskeleton and red cell shape. Cell Mol Biol Lett. 1996;1:67–78. [Google Scholar]
- 38.Tang KS, Guralnick BJ, Wang WK, Fersht AR, Itzhaki LS. Stability and folding of the tumour suppressor protein p16. J Mol Biol. 1999;285(4):1869–1886. doi: 10.1006/jmbi.1998.2420. [DOI] [PubMed] [Google Scholar]
- 39.Waltz RA, Morales JL, Nocedal J, Orban D. An interior algorithm for nonlinear optimization that combines line search and trust region steps. Math Program. 2006;107(3):391–408. [Google Scholar]
- 40.Yawata Y. Cell Membrane: The Red Blood Cell as a Model. Wiley-VCH; 2003. [Google Scholar]
- 41.Zhou J, Low PS. Characterization of the reversible conformational equilibrium in the cytoplasmic domain of human erythrocyte membrane band 3. J Biol Chem. 2001;276(41):38147–38151. doi: 10.1074/jbc.M104333200. [DOI] [PubMed] [Google Scholar]
- 42.Ziherl P, Svetina S. Nonaxisymmetric phospholipid vesicles: rackets, boomerangs, and starfish. Europhys Lett. 2005;70(5):690–696. [Google Scholar]
- 43.Zimmerberg J, Kozlov MM. How proteins produce cellular membrane curvature. Nat Rev Mol Cell Biol. 2006;7(1):9–19. doi: 10.1038/nrm1784. [DOI] [PubMed] [Google Scholar]
Associated Data
This section collects any data citations, data availability statements, or supplementary materials included in this article.