Abstract
Objective:
To evaluate the appropriate use of arm span measurements as a substitute for height/linear length to evaluate obesity in people with myelomeningocele by comparing calculated body mass indices (BMIs) with recently published BMI graphs by the Centers for Disease Control and Prevention (CDC) and National Center for Health Statistics standards (NCHS) published in 2000.
Study Design:
Retrospective analysis of collected data on patients seen in the University of Washington Birth Defects Clinic from July 1, 1965, through June 1, 2008. Observations included degree of paralysis, presence of scoliosis, height (linear length), weight, and arm span. We compared published CDC/NCHS BMIs with our data using both height and arm span in place of height/linear length. There were 14,701 measures collected during 4,968 visits from 709 patients. Mean values were calculated using age, gender, and lesion level as independent variables.
Results:
Comparison of BMI means of patients with myelomeningocele suggests that our observations using arm span and height are comparable with the CDC/NCHS BMI means using height for the 2 least paralyzed groups but not for those groups with paralysis from high-level lesions that are more likely to exhibit lower extremity deformities or scoliosis.
Conclusions:
Published CDC/NCHS graphs, with their percentiles, are appropriate for estimating normal growth by BMI for children born with myelomeningocele when arm span is substituted for length if severe body differences due to high-level paralysis are taken into consideration.
Keywords: Spina bifida, Myelomeningocele, Paralysis, Obesity, Anthropometric measures, Body mass index
INTRODUCTION
Hayes-Allen in 1972 first identified short stature and obesity among children with spina bifida (1). Since then a number of articles have described a high prevalence of obesity ranging from 29% to 74%, with an average of 42.4% (1–9). The results vary according to the number, age, and sex of the patients, as well as the methods of assessment. In 1984, Charney et al (2) suggested using arm span as a substitute for height/linear length in the calculation of weight to height measures to evaluate for obesity in children with myelomeningocele. In 1986, we suggested using arm span to calculate body mass index (BMI) but had too few observations to provide adequate estimates of mean measures with standard deviations by age, sex, and level of paralysis (3).
There were several practical reasons for these recommendations. These children have a high incidence of decreased height or linear length secondary to kyphosis, scoliosis, abnormal vertebrae, and lower extremity hypoplasia associated with their myelomeningocele (3,4,6,10–12). A number of studies have reported the value of using arm span as a substitute for estimating body functions (eg, pulmonary function, growth) and for calculating medication dosages for people with scoliosis or when height or length are difficult to obtain (13–19). Others have stated arm span is not a substitute for height in the evaluation of growth or BMI and is not optimal for evaluating lean body mass in patients with myelomeningocele or cerebral palsy (20–22). The US Centers for Disease Control and Prevention (CDC) and the National Center for Health Statistics (NCHS) recently published mean BMI graphs with 3rd to 97th smoothed percentiles for females and males in age groups 2 through 20 years of age (23).
This study was undertaken to determine the most appropriate clinical method for calculation of BMI to monitor for obesity and/or a propensity toward obesity in patients with myelomeningocele.
STUDY DESIGN
For this study, permission to retrieve anthropometric data and age at collection from the Patient Data Management System computer file and the Seattle Children's Hospital medical records was granted by the hospital's Institutional Review Board (#E 01-037-05).
We included all patients with myelomeningocele seen on a yearly basis on or near their birthdays from age 2 through 20 years from July 1, 1965, through June 1, 2008, at the University of Washington and Seattle Children's Hospital Birth Defects Clinics. From 1965 to 1974, height/linear length, and weight and since 1974 height/linear length, weight, and arm span were recorded by trained medical assistants on data collection forms subsequently entered into the Patient Data Management System computer file (24).
Body weights (in kg) were recorded on a platform scale for those who could stand; for those who could not, an infant scale or a wheelchair-accessible scale produced by Scale-Tronix (White Plains, NY) was used. Arm spans (in cm) were measured with a metal ruler that has a welded right angle at “0” and a sliding right angle; patients were instructed to push out as far as possible with their finger tips touching the fixed right angle and the sliding right angle. This procedure was designed to overcome adduction of the shoulder girdles during measurement. Our method of measuring arm span had a test/retest accuracy of mean = 0.9 ± 0.1 cm, r = 0.917 (n = 32).
Heights (in cm) were measured on a Stadiometer (Holtran, Ltd, Crymych, Dyfed, Wales, United Kingdom) in the standing position for those without either dynamic or fixed lower extremity contractures in the hips, knees, or ankles regardless of the presence of spine abnormalities. Those with dynamic or fixed lower extremity contractures in the standing position had linear lengths measured on a Stadiometer fixed on a horizontal examining table. Segmental measurements were obtained from hip to knee and knee to sole of the heel and added to sitting height. Henceforth, height will be used in this paper to represent both height and linear length.
These data were transferred to data collection forms in clinic and then transferred to the Patient Data Management System by a research assistant on a routine basis and, most recently, by one of the authors (S.D.). The error rate during transfer of these data has been reported as 0.2% (25). Data were also obtained from medical record progress notes written by physicians and/or nutritionists. PDMS and medical record data for this study were entered into an Excel file without any of the US Health Information Privacy Prevention Act personal identifiers for study analysis.
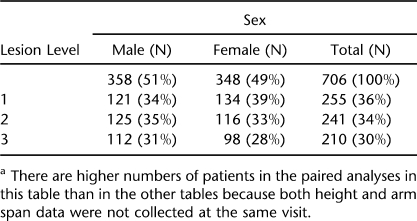
We created data sets containing each patient's computer identification number, gender, age in years and tenths, weight, height, lesion level, arm span, and BMIs calculated using both height and arm span. Three lesion levels (LL) were defined (Table 1). Lesion level 1 (LL1) included patients with thoracic and high lumbar motor levels 1 to 3; LL2 included patients with lumbar motor levels 4 to 5; LL3 included patients with sacral motor function levels. All patients in the LL1 group used wheelchairs as their primary method of mobility, and those in the LL2 group used braces and crutches to ambulate until later childhood, when some began using a wheelchair for extended locomotion. The majority of those in the LL3 group ambulated throughout childhood (26).
Table 1.
Participant Demographics by Sex and Lesion Levela
Statistical Analysis
One of the authors (D.B.S.) plotted each patient's growth on CDC/NCHS height, weight, and BMI graphs. Discrepant numbers were checked for accuracy against the patients' PDMS data collection forms for data entry errors and against their medical records for errors in transfer of data to the data collection forms. Potential errors that could not be better explained were deleted if measures before and after the aberrant numbers indicated that they were obvious mistakes. Mean values for height, weight, arm span, and both BMI calculations by age, gender, and LL were determined using Excel and stratified for pairs of height and arm span simultaneous observations using STATA 10.1 software (StataCorp, College Station, TX). Subsequent analyses included stratification by gender and LL. Mean values for height, arm span, and BMIs were calculated by age. For each arm span–height-matched pair observation in which arm span was longer than height, the longer percent was calculated. The mean percent longer was plotted by age along with 95% Bland-Altman (27) confidence limits. Mean differences between observed arm spans and Englebach's (28) data for peers ages 8 through 17 years were examined using generalized estimating equations to account for correlation of multiple arm span measures collected for each patient (29,30); 95% CIs were generated from these analyses. Age-matched pair observations of arm span and height BMI CDC/NCHS percentile pairs were calculated and plotted for each participant.
The differences between paired percentiles were examined using mean percentile differences and generalized estimating equation 95% CIs for comparison between them and BMIs calculated using each. We calculated the mean differences between our values for arm spans in female and males from ages 8 through 17 years and values of similarly aged peers from Englebach's data (28). We paired matched pair values for arm span and height both in tables and graphs plotting 95% confidence limits analyzed by generalized estimations equations (29,30) for each group's 5 anthropometric measures (height, weight, arm span, and BMIs calculated using both height and arm span) by age and gender to create 5 tables and 6 graphs. All analyses were executed using Excel and STATA 10.1 software.
RESULTS
In Table 1, we report a summary of our patients in each of the LL groups by sex. Our data include measures of height/linear length, weight, and arm span obtained during 4,968 visits by 709 patients. Of these measures, 4,968 are weights, 4,929 are height/linear lengths, and 4,763 are arm span measures. Both arm span and height were not collected at every visit.
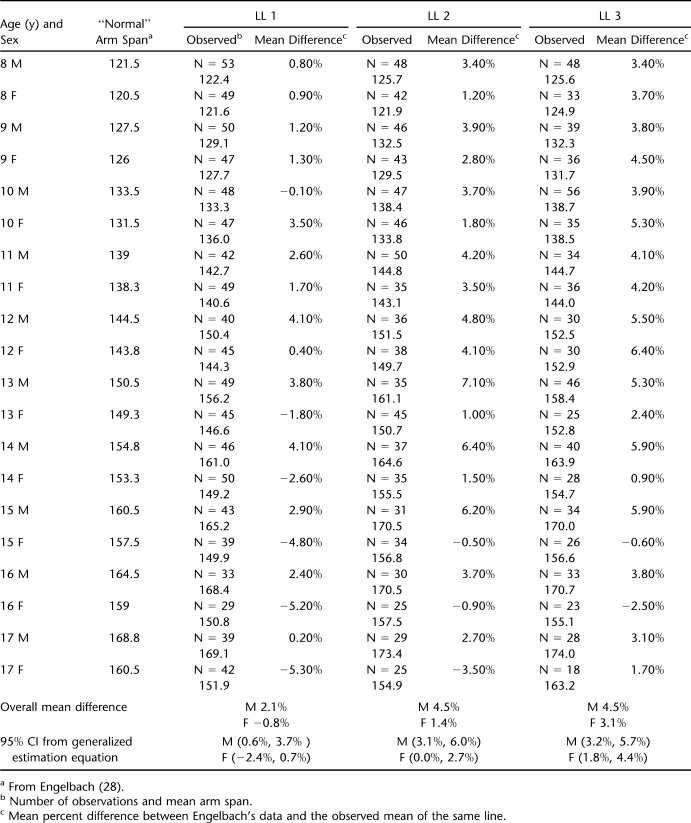
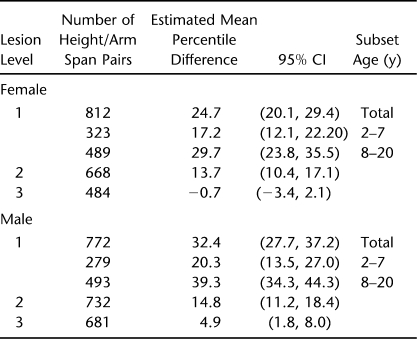
Table 2 reports the overall percent differences between normative data for arm span of patients reported by Englebach (28) and age peers in 3 LL groups with CIs analyzed by generalized equation estimates for females and males.
Table 2.
Overall Percent Differences Between Normative Data for Arm Span of Patients Reported by Englebach and Age Peers in 3 Lesion Level Groups With CIs Analyzed by Generalized Equation Estimates for Females and Males
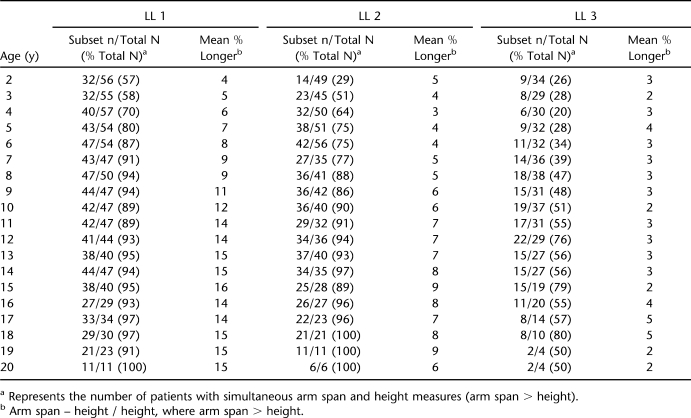
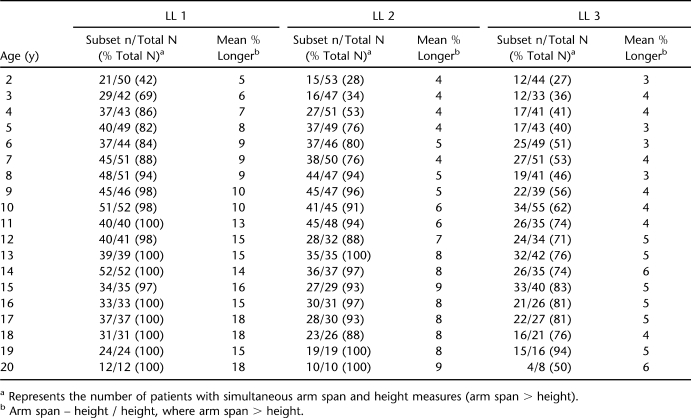
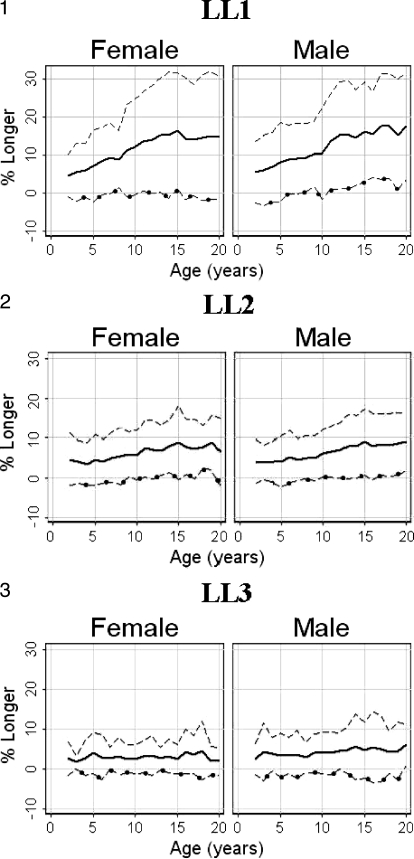
Tables 3 (females) and 4 (males) present the mean percent difference (arm span – height / height) between paired measurements of arm span and height; this same information is shown graphically in Figures 1 through 3. “Subset n” in Tables 3 and 4 represents the number of patients with simultaneous arm span and height measures. For the LL1 group, the mean percent greater length of the Englebach data (28) range compared with our group with myelomeningocele is 4% to 16% (females) and 5% to 18% (males); for the LL2 group, 3% to 9% (females) and 4% to 9% (males); and for the LL3 group, 2% to 5% (females) and 3% to 6% (male).
Table 3.
Description of Female Participants by Age and Lesion Level (LL)
Table 4.
Description of Male Participants by Age and Lesion Level (LL)
Figure 1–3.
Plots of the percent mean differences (⁃) between arm span (—) minus height (–○–) divided by height for females and males in each of the lesion level groups by age.
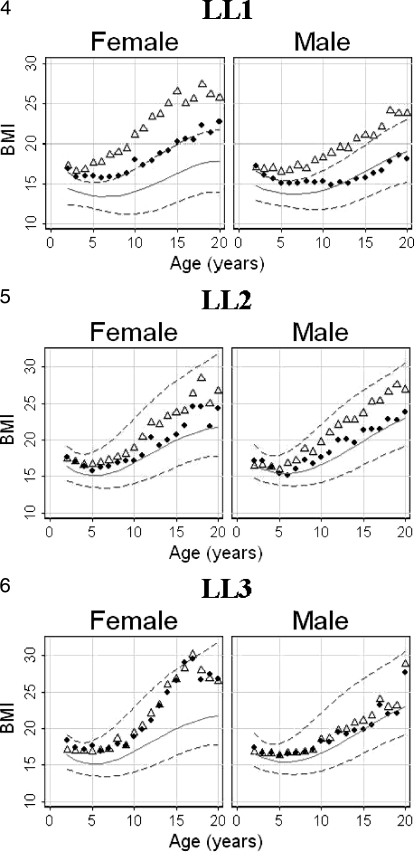
Table 5 provides the generalized estimation equation analysis as 95% CIs for females and males to demonstrate within patient correlations for both females and males in all 3 LL groups. These same data are shown as graphs of mean BMIs in Figures 4 through 6. Because of the difference between the estimates for the 2- to 7-year-old and 8- to 20-year-old patients in the LL1 group, those CIs are shown separately.
Table 5.
Generalized Estimation Equation Analysis of the Difference Between Paired Height and Arm Span Body Mass Index in Centers for Disease Control and Prevention/National Center for Health Statistics Percentiles
Figure 4–6.
Plots of body mass index (BMI) calculated by both arm span (♦) and height (▵) for each of the lesion level groups by sex and age are superimposed on Centers for Disease Control and Prevention/National Center for Health Statistics BMI percentile graphs. The background BMI graphs for the lesion level 1 male and female groups (Figure 4) have the percentiles lowered because of lost lean body mass, as explained in the text.
Figures 1 through 3 illustrate the mean paired arm spans minus heights for the 3 separate LL groups with the mean percent arm span longer than height (arm span – height / height) for both females and males with the actual numbers in Tables 3 and 4.
Figures 4 through 6 and illustrate the mean BMIs for females and males calculated by using height and separately by using arm span superimposed on the 5th, 50th and 95th percentile CDC/NCHS BMI graphs for the 3 LL groups.
The differences between the BMIs calculated before and after scoliosis repair using arm span and those calculated using height are similar to those for females (mean = 4.7, range = 2.5–14.1, 95% CI = 2.3–8.5) and for males (mean = 5.7, range = 1.2–9.1, 95% CI = 4.5–7.4). These differences were calculated for matched paired observations for those patients older than age 15 years after spinal correction for scoliosis.
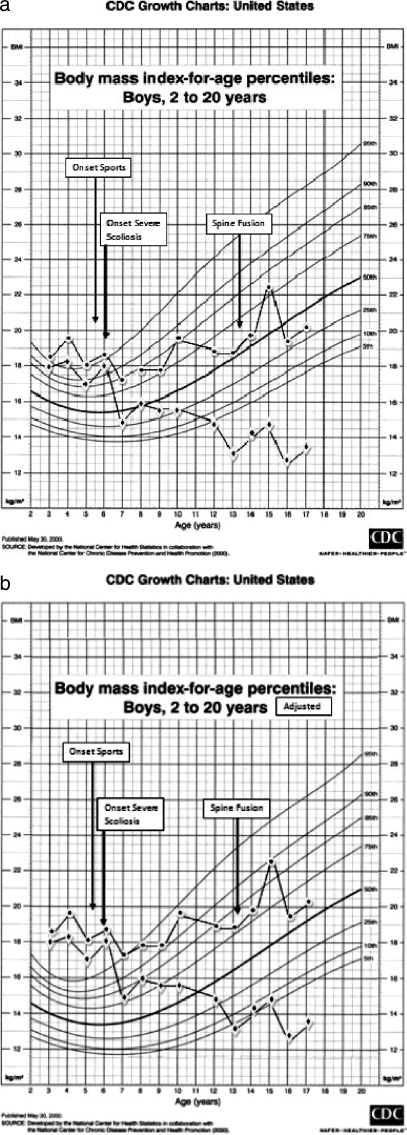
Both the effects of athletic activity and the effect of scoliosis with repair are of such complexity we have chosen to present them as a future separate paper and provide only an example of their impact in Figure 7. As an example of patients in the LL3 group, these 2 graphs (Figure 7a and b) demonstrate BMIs calculated using both height and arm span of a wheelchair athlete before and after he began athletic activities, as well as before, during the development of, and after stabilization of his scoliosis. Throughout this period, this patient's skinfold thickness remained near the 50th percentile.
Figure 7.
Plots of body mass index calculated both by using height (–•–) and arm span (–♦–) before and after beginning participation in sports and immediately before and after spinal fusion for scoliosis. (a) The patients' plots against unaltered Centers for Disease Control and Prevention/National Center for Health Statistics (CDC/NCHS) percentile graphs; (b) the patients' plots against CDC/NCHS percentile graphs that have been lowered by approximately 50% of body mass index for age.
In the Discussion, we explain why the background CDC/NCHS percentile curves and graphs in Figures 4 and 7b have been modified by lowering the background CDC/NCHS percentile lines.
DISCUSSION
The data collection methods in this study are basic compared with those in other investigative studies. However, the repeat measurement accuracy of our arm span measures (r = 0.917) are comparable with the r = 0.997 (13) and repeat error of 0.25 cm (r = 0.989) (16) reported when using a tape measure against a wall. We have used BMI as the most clinically acceptable method of assessing body mass despite reports by others claiming skinfold thickness to be more accurate (4,6). We have found the test/retest and inter-tester reliability of skinfold thickness measures to be unreliable except in the subscapular region, as confirmed through literature review (3). Furthermore, in 2006 Larsson et al (8) reported that “…compelling reasons must then be provided for proposing other alternatives to weight for height index …,” advice that is more pertinent since the publication of the CDC/NCHS BMI data and charts (23).
The arm span as a substitute for height method we propose is applicable to most clinics caring for patients in wheelchairs or for those where it is difficult to obtain height or linear length measures because of the patients' inability to stand, their scoliosis, or their lower extremity deformities (13–19). We have not used more stringent investigative measures (4–9,11) in our study because they are expensive or radioactive and not available in most clinic situations.
As demonstrated in Tables 3 through 5 and Figures 1 and 2, we would agree with the observation that arm span is not equivalent to height for all patients with meningomyelocele (20,21) because of deformities of the spine and lower extremities in many of these children (1–3,10–12). That arm span is not equivalent to height is, we believe, irrelevant to the stated objective of this paper. We are suggesting that arm span is a better method to use in estimating growth in formulae that use height to predict body functions when the patient has deformities that produce body and/or lower extremity shortening. We are not suggesting that arm span is an approximation of height in all children with myelomeningocele. These data, however, do demonstrate that arm span is equivalent to height in younger children with myelomeningocele who have not yet developed significant growth retardation of the lower extremities or scoliosis and among the least paralyzed without these significant changes regardless of age. (Tables 3–5, Figures 1–3). In addition, data in Tables 3 and 4 demonstrate that arm span is neither longer (11) nor shorter (31) than expected for age, as reported by others.
The relatively small differences between arm span and height among the 2- to 8-year-old children in the LL1 group (Tables 3–5, Figure 1) probably represent children beginning to show the effect of delayed growth due to paralysis and the development of hypoplasia. The increasing divergence after age 8 years is due to the added effect of scoliosis (10,12) during this time of rapid growth (15) associated with the beginning of puberty (32). The difference in the widening of the discrepancy between height and arm span is less evident in the intermediate paralyzed group (LL2) (Tables 3–5, Figure 2) and less so in the least paralyzed (LL3) (Tables 3–5, Figure 3) because of less severe paralysis (1) and a lower frequency of scoliosis (12).
Figure 7 illustrates the effect of scoliosis on BMI when calculated using height vs arm span. Scoliosis in its most severe preoperative effect is associated with an artificially excessive BMI when calculated by linear length but not by arm span. The patient's weight gain remained appropriate during this sequence of BMI changes. His subscapular skinfold thickness measurements were within normal limits throughout the time described. To use height rather than arm span when calculating BMI results in individuals with significant body shortening due to scoliosis being incorrectly described as “obese” or “overweight.”
This phenomenon is further documented by the mean differences between preoperative BMIs calculated by height and arm span for females (mean = 4.7, males 5.7) between BMIs calculated using height and arm span for those patients who experienced severe enough scoliosis to require spinal correction, which was noted in the next to the last paragraph of the “Results” section. These smaller differences than demonstrated in Figure 7b can be explained by the intervals between the last height measure before scoliosis repair and the surgery. Patients identified in the clinic (where yearly heights and other anthropometric measures are recorded) are referred to the Orthopedic Spine Clinic. While patients were followed there, no linear measures are recorded; the last height measure may have been 1 to 11 months before surgery. These smaller differences than those demonstrated in Figure 7b and Tables 3 through 5 may also be explained by fewer patients requiring surgical correction of the scoliosis, the minimal levels of curve remaining after insertion of rods that are extended periodically to account for growth, and the large percent of patients in all 3 groups who developed scoliosis but did not progress to surgery (12).
The effect of the discrepancy between arm span and height shortened by scoliosis and lower extremity hypoplasia on BMI calculations is demonstrated in the data in Figures 4 through 6 and Table 5. Our data would support previously published reports (13–19) that arm span is a better parameter than height to calculate body functions for patients with myelomeningocele and scoliosis and/or hypoplastic lower extremities. For patients with myelomeningocele and with intermediate or minimal paralysis (LL2 and LL3) without scoliosis or lower extremity hypoplasia, either height or arm span can be reliably used to estimate BMI.
In addition, the lack of lean body mass is associated with a need for lower calorie intake to maintain appropriate weight gain in the severely paralyzed, LL1 group (33,34). Appropriate weight and low lean body mass causes the CDC/NCHS curves to indicate a low BMI, incorrectly suggesting an undernourished state. Studies using more accurate methods to estimate lean body mass are important to this discussion because they describe lean body mass of approximately 50% of “normal” among patients with high levels of paralysis and myelomeningocele (LL1 group) (4–9). This low lean body mass is primarily due to the absence of the large muscles about the hip and thigh in the LL1 group compared with their less paralyzed peers in groups LL2 and LL3. Investigators (4–9) have demonstrated that from 40% to 50% of lean body mass is missing in this group with severe paralysis. The loss of lean body mass also helps explain why children with myelomeningocele and significant paralysis become overweight or obese despite low calorie intake (33–35).
Because of these considerations and observations, we have adjusted the CDC/NCHS percentiles in Figures 4 and 7b by lowering the background BMI percentile curves shown in Figures 5 through 7a by approximately 50%. We suggest that such an adjustment should be made in CDC/NCHS BMI graphs to more easily explain to parents of children with myelomeningocele and a high level of paralysis the effect reduction in lean body mass has on “normal” expectations for weight gain and calorie requirements. If these modifications to the BMI graphs are used in conjunction with arm span to estimate BMIs, the actual frequency of obesity among patients with high-level lesions (LL1) will be appropriately increased and the proportion of children deemed less than the third percentile for BMI reduced.
BMIs calculated using height and arm span for the least paralyzed female group (LL3) are essentially identical (Figure 6). The weight gain among older patients in this group agrees with an earlier study (36) but contradicts the suggestion that children either become obese and “retreat to a wheelchair” or become obese because they have given up walking (37,38). Patients in this least paralyzed group rarely “retreat to wheelchairs” (37–40). The development of obesity is seen in the same level paralysis male group only after the age of graduation from high school and may be due to termination of team athletic activities and/or the adoption of a more sedentary lifestyle. Patients in the intermediate group (LL2) demonstrate obesity at intermediate rates between the other 2 groups.
Our program emphasizes prevention of obesity by dietary restriction, diversion activities, and exercise, as well as the approach to weight reduction recommended by Dietz (41). The observations we report in this study, therefore, reflect a greater emphasis on weight control and may not be comparable with other groups of myelomeningocele patients, as suggested by Liptak et al (39).
CONCLUSIONS
To best utilize the extensive data in the CDC/NCHS BMI graphs, BMI calculation should use arm span, because it is more appropriate than height for patients with body and/or lower extremity deformity primarily due to high levels of paralysis (LL1) or significant scoliosis. Falsely low BMIs can be corrected by lowering BMI percentiles for patients with a loss of large muscle mass about the hips and thighs. Either height or arm span can be used to calculate BMI in patients with low lumbar (LL2) or sacral (LL3) LLs without scoliosis. Published CDC/NCHS graphs with their BMI percentiles are appropriate for estimating normal growth for children born with myelomeningocele if these considerations are taken into account.
Tables of height/linear length, weight, and arm span by gender and LL groups for patients with myelomeningocele for groups 2 to 20 years of age are available upon request (david.shurtleff@seattlechildrens.org).
References
- Hayes-Allen MC. Obesity and short stature in children with meningomyelocele. Dev Med Child Neurol. 1972;14(suppl 22):59–64. doi: 10.1111/j.1469-8749.1972.tb09775.x. [DOI] [PubMed] [Google Scholar]
- Charney EB, Rosenblum M, Finegold D. Linear growth in a population of children with meningomyelocele. Zinderchir. 1981;34(4):415–419. doi: 10.1055/s-2008-1063385. [DOI] [PubMed] [Google Scholar]
- Shurtleff DB. Dietary management. In: Shurtleff DB, editor. Myelodysplasias and Exstrophies, Significance, Prevention and Treatment. Orlando, FL: Grune & Stratton; 1986. pp. 285–298. [Google Scholar]
- Roberts D, Shepard RW, Shepard K. Anthropometry and obesity in meningomyelocele. J Pediatr Child Health. 1991;27(2):83–90. doi: 10.1111/j.1440-1754.1991.tb00358.x. [DOI] [PubMed] [Google Scholar]
- Littlewood RA, Trocki O, Shepard RW, Shepard K, Davies PSW. Resting energy expenditure and body composition in children with meningomyelocele. Pediatr Rehabil. 2003;6(1):31–37. doi: 10.1080/1363849031000097817. [DOI] [PubMed] [Google Scholar]
- Ausili E, Focrelli B, Tabacco F, et al. Bone mineral density and body composition in a myelomeningocele children population: effects of walking ability and sport activity. Eur Rev Med Pharmacol Sci. 2008;12(6):349–354. [PubMed] [Google Scholar]
- Grogan CB, Ekval SM. Body composition of children with meningomyelocele determined by 40,000 urinary creatinine and anthropometric measures. J Am Coll Nutr. 1999;18(4):316–323. doi: 10.1080/07315724.1999.10718870. [DOI] [PubMed] [Google Scholar]
- Larsson I, Henning B, Lindroos AK, et al. Optimized predictions of absolute and relative amounts of body fat from weight, height other anthropometric predictors, and age. Am J Clin Nutr. 2006;83(2):252–259. doi: 10.1093/ajcn/83.2.252. [DOI] [PubMed] [Google Scholar]
- Liusuwan RA, Widman LM, Abresch RT, et al. Body composition and resting energy expenditure in patients aged 11 to 21 years with spinal cord dysfunction compared to controls: comparison and relationships among the groups. J Spinal Cord Med. 2007;30(suppl 1):S105–S111. doi: 10.1080/10790268.2007.11754613. [DOI] [PMC free article] [PubMed] [Google Scholar]
- Duval-Beaupere G, Kaci M, Lougovoy J, Caponi MF, Touzeau C. Growth of trunk and legs of children with meningomyelocele. Dev Med Child Neurol. 1987;29(2):225–231. doi: 10.1111/j.1469-8749.1987.tb02140.x. [DOI] [PubMed] [Google Scholar]
- Shepherd K, Roberts D, Golding S, Thomas BJ, Shepherd RW. Body composition in meningomyelocele. Am J Clin Nutr. 1991;53(1):1–6. doi: 10.1093/ajcn/53.1.1. [DOI] [PubMed] [Google Scholar]
- Shurtleff DB, Gordon LH, Goiney R, et al. Myelodysplasia: the natural history of kyphosis and scoliosis: a preliminary report. Dev Med Child Neurol. 1976;18(suppl 37):126–133. doi: 10.1111/j.1469-8749.1976.tb04294.x. [DOI] [PubMed] [Google Scholar]
- Brown JK, Feng JY, Knapp TB. Self reported height or arm span more accurate alternative measure of height. Clin Nurs Res. 2002;11(4):417–432. doi: 10.1177/105477302237454. [DOI] [PubMed] [Google Scholar]
- Hepper NGG, Black LF, Fowler WS. Relationships of lung volumes to height and arm span in normal subjects and in patients with spinal deformity. Am Rev Respir Dis. 1965 Mar;91:356–362. doi: 10.1164/arrd.1965.91.3.356. [DOI] [PubMed] [Google Scholar]
- Hochhaus F. One year treatment with recombinant human growth hormone of children with meningomyelocele and growth hormone deficiency: a comparison of supine length and arm span. J Pediatr Endocrinol Metab. 1999;12(2):153–159. doi: 10.1515/jpem.1999.12.2.153. [DOI] [PubMed] [Google Scholar]
- Jarzem PF, Gledhill RB. Predicting height from arm span measurements. J Pediatr Orthop. 1993;13(6):761–765. doi: 10.1097/01241398-199311000-00014. [DOI] [PubMed] [Google Scholar]
- Miller F, Koreska J. Height measurement of patients with neuromuscular disease and contractures. Dev Med Child Neurol. 1992;34(1):55–60. doi: 10.1111/j.1469-8749.1992.tb08563.x. [DOI] [PubMed] [Google Scholar]
- Satin-Smith M, Katz L, Thornton F, et al. Arm span as measurement of response to growth hormone (GH) treatment in a group of children with meningomyelocele and growth deficiency. Clin Endocrinol Metab. 1996;81(90):1654–1656. doi: 10.1210/jcem.81.4.8636383. [DOI] [PubMed] [Google Scholar]
- Sherman MS, Kaplan JM, Effgen S, et al. Pulmonary dysfunction and reduced exercise capacity in patients with meningomyelocele. J Pediatr. 1997;131(3):413–418. doi: 10.1016/s0022-3476(97)80067-4. [DOI] [PubMed] [Google Scholar]
- Rotenstein D. Arm span as a measure of response to GH treatment. J Clin Endocrinol Metab. 1996;81(9):3432. doi: 10.1210/jcem.81.9.8784111. [DOI] [PubMed] [Google Scholar]
- Rotenstein D, Adams M, Reigel DH. Adult stature and anthropometric measurements of patients with myelomeningocele. J Pediatr. 1995;154(5):398–402. doi: 10.1007/BF02072114. [DOI] [PubMed] [Google Scholar]
- Stevenson RD. Use of segmental measures to estimate stature in children with cerebral palsy. Arch Pediatr Adolesc Med. 1995;149(6):658–662. doi: 10.1001/archpedi.1995.02170190068012. [DOI] [PubMed] [Google Scholar]
- Centers for Disease Control and Prevention. National Center for Health Statistics [updated 2009 August 4; cited 2007 September 9] Available at: http://www.cdc.gov/nchs/growthcharts/clinical_charts.htm. Accessed August 30, 2010.
- Shurtleff DB. Computer databases for pediatric disability: clinical and research applications. Phys Med Rehabil Clin N Am. 1991;2(4):665–687. [Google Scholar]
- Shurtleff DB, Lamers J, Goiney T, et al. Are myelodysplastic children fat? Anthropometric measures: a preliminary study. Spina Bifida Ther. 1982;4(1):1–21. [Google Scholar]
- McDonald CM, Jaffe KM, Mosca VS, Shurtleff DB. Ambulatory outcome of children with myelomeningocele: effect of lower extremity muscle strength. Dev Med Child Neurol. 1991;33(6):482–490. doi: 10.1111/j.1469-8749.1991.tb14913.x. [DOI] [PubMed] [Google Scholar]
- Bland JM, Altman DG. Statistical methods for assessing agreement between two methods of clinical measurement. Lancet. 1986;1(8476):307–310. [PubMed] [Google Scholar]
- Engelbach W. Endocrine Medicine. Vol I. Springfield, IL: Charles C Thomas; 1932. pp. 261–312. [Google Scholar]
- Zeger SL, Liang KY. Longitudinal data analysis for discrete and continuous outcomes. Biometrics. 1986;42(1):121–130. [PubMed] [Google Scholar]
- Hardin JW, Hilbe JM. Generalized Estimating Equations. Boca Raton, FL: Chapman & Hall/CRC; 2003. [Google Scholar]
- Belt-Niedbala BJ, Ekvall S, Cook CM, et al. Linear growth measurement: a comparison of single arm lengths and arm span. Dev Med Child Neurol. 1986;28(3):319–324. doi: 10.1111/j.1469-8749.1986.tb03880.x. [DOI] [PubMed] [Google Scholar]
- Trollmann R, Strehl E, Dorr HG. Precocious puberty in children with myelomeningocele: treatment with gonadotropin-releasing hormone and analogues. Dev Med Child Neurol. 1998;40(1):38–43. doi: 10.1111/j.1469-8749.1998.tb15354.x. [DOI] [PubMed] [Google Scholar]
- Manenica K. Identification of Factors Related to Obesity in Children With Myelomeningocele [thesis] Seattle, WA: University of Washington; 1982. [Google Scholar]
- Rickard K, Brady MS, Gresham EL. Nutritional management of the chronically ill child: congenital heart disease and myelomeningocele. Pediatr Clin N Am. 1977;24(1):157–175. doi: 10.1016/s0031-3955(16)33396-x. [DOI] [PubMed] [Google Scholar]
- Fiore P, Picco P, Castagnola E, et al. Nutritional survey of children and adolescents with myelomeningocele (MMC): overweight associated with reduced energy intake. Eur J Pediatr Surg. 1998;8(suppl 1):34–36. doi: 10.1055/s-2008-1071250. [DOI] [PubMed] [Google Scholar]
- Dosa NP, Foley JT, Eckrich M, Woodall-Ruff D, Liptak GS. Obesity across the lifespan among persons with spina bifida. Disabil Rehabil. 2008;30(11):1–7. doi: 10.1080/09638280802356476. [DOI] [PubMed] [Google Scholar]
- Asher J, Olsen M. Factors affecting the ambulatory status of patients with spina bifida cystica. J Bone J Surg. 1983;65(3):350–356. [PubMed] [Google Scholar]
- DeSouza LJ, Carroll M. Ambulation in the braced meningomyelocele patient. J Bone J Surg. 1976;58(8):1112–1118. [PubMed] [Google Scholar]
- Liptak G, Shurtleff DB, Bloss JW, et al. Mobility aids for children with high-level meningomyelocele: parapodium versus wheelchair. Dev Med Child Neurol. 1992;34(9):787–796. doi: 10.1111/j.1469-8749.1992.tb11517.x. [DOI] [PubMed] [Google Scholar]
- Menelaus MB. Orthopedic Management of Spina Bifida Cystica. 2nd ed. New York, NY: Churchill Livingstone; 1980. pp. 57–60. [Google Scholar]
- Dietz WH. Childhood obesity: susceptibility, cause, and management. J Pediatr. 1983;103(11):676–686. doi: 10.1016/s0022-3476(83)80457-0. [DOI] [PubMed] [Google Scholar]


