Abstract
We characterized global and regional left ventricular (LV) function during post myocardium infarction (MI) remodeling in rats, which has been incompletely described by previous MRI studies. To assess regional wall motion, four groups of infarcted animals corresponding to 1–2, 3–4, 6–8 and 9–12 weeks post-MI respectively were imaged using a fast gradient echo sequence with a 2D spatial modulation of magnetization (SPAMM) tagging preparation. An additional group was serially imaged (1–2 and 6–7 weeks post-MI) to assess the global function. Regional and global functional parameters of infarcted rats were compared to non-infarcted normal rats. Compared to normal rats, a decrease in ejection fraction (70 ± 7 vs. 40 ± 8%, p < 0.05) was observed in rats with MI. Maximal and minimal principal stretches (λ1, λ2) and strains (E1, E2), principal angle (β) and displacement varied regionally in normal rats but deviated significantly from the normal values in rats with MI particularly in the infarcted and adjacent zones. Not only was strain magnitude reduced segmentally post-MI, but strain direction became more circumferentially oriented, particularly in rats with larger infarctions. We report the first regional myocardial strain values in normal and infarcted rats. These results parallel findings in humans, and provide a unique tool to examine regional mechanical influences on the remodeling process.
Keywords: Myocardial function, Wall motion, Tagged MRI, Myocardial infarction, Remodeling, Rat
Introduction
Coronary heart disease (CHD) accounts for more than 50% of all cardiovascular deaths and remains the leading cause of heart failure in the United States and Europe despite improved pharmacological therapy [1,2]. Various animal models have been used to study the changes in left-ventricular geometry and function during the remodeling process after myocardial infarction (MI). The rat MI model has been used extensively to assess the impact of various treatment strategies including stem cell therapy [3–5]. Magnetic resonance imaging (MRI) has emerged as a useful technique for non-invasive assessment of therapeutic effects: MRI has been shown to yield accurate and reliable quantification of murine global myocardium function, left ventricular (LV) mass and wall thickness in small animals including rats [6–9]; estimation of infarction size was achieved either by delayed hyper-enhancement after injection of contrast agent or by identification of myocardial segments that lack contraction on cine-based images. A particularly useful and unique capability of MRI is to generate fiducial markers non-invasively. Spatial modulation of magnetization (SPAMM) uses gradient and RF pulses to generate a grid of dark bands (tags) within a series of images [10,11]. These tags track myocardial deformation during the heart cycle and can be used to extract regional measures of strain within the tissue. Tagged cardiac MRI has been used to quantify regional myocardial function in MI in both humans and animals [12–14]. While changes in global function during post-MI remodeling in rats have been reported [6], wall motion analysis and regional cardiac function in normal and infarcted rats have been incompletely described to date. The present study was aimed at characterizing the changes in global and regional myocardial function during the post-MI remodeling process in a rat model.
Materials and methods
Infarction model
All animal studies were approved by the Institutional Animal Care and Use Committee (IACUC) of the University of Pennsylvania. Sixteen infarcted and three normal male Sprague-Dawley rats (bodyweight 220–400) were commercially acquired (Charles River Laboratories, Inc., Wilmington, MA, USA). In this model a non-reperfused anterolateral MI is induced by surgical ligation of the left anterior descending (LAD) coronary artery following a similar protocol described by Pfeffer et al. [15].
MR imaging
Four groups of infarcted animals corresponding to 1–2 (n = 5), 3–4 (n = 3), 6–8 (n = 5) or 9–12 (n = 3) weeks post-MI were imaged for assessment of regional wall motion. Another group of infarcted rats (n = 6) was serially imaged at 1–2 and 6–7 weeks post-MI for assessment of global function. Normal non-infarcted rats (n = 3) were used as controls. Prior to imaging, the rat was anesthetized with an intraperitoneal injection of Ketamine/Acepromazine (50/2.5 mg/kg) mixture. A pair of platinum subdermal needle electrodes and a rectal thermistor was placed to monitor the electrocardiogram (ECG) and core temperature using an MRI-compatible monitoring system (SA Instruments, Stony Brook, NY, USA). The core temperature of the animal was maintained at 37 ± 0.2°C via a feedback circuit that triggers a heating device to direct warm air to the bore of the magnet if the detected temperature is lower than 37°C. Anesthesia was maintained during imaging by administration of 1% isoflurane mixed with air (medical grade) via a nose cone at a rate of 0.61/min.
All images were generated on a 4.7-T horizontal small bore Varian INOVA scanner (Varian, Palo Alto, CA, USA) with a 12-cm gradient, which has a maximum gradient strength of 25 gauss/cm and a rise time to full amplitude of 200 μs. Either a transmit-and-receive volume coil (6.5 cm in diameter, Doty Scientific, Inc., SC, USA) or a custom-made surface coil (4 cm in diameter) was used. While the volume coil allows for better penetration and homogeneity, the surface coil has a better signal-to-noise ratio. Thus the volume coil was used for large animals exceeding 350 g, while the surface coil was used for smaller animals.
The imaging sequences were similar to a previously described protocol [16]. A series of coronal and sagittal gradient echo (GRE) scout images was acquired to determine the long axis of the heart. An ECG-gatcd GRE sequence (FLASH) was planned in the short-axis orientation, perpendicular to the LV long axis. Imaging parameters for this sequence were as follows: flip angle 20–25°, repetition time (TR) 6 ms, echo time (TE) 3 ms, FOV 5–6 cm2, matrix 128 × 128 zero-filled to 256 × 256, slice thickness 1.5 mm, 11–12 cardiac phases per heart beat and four signal averages. Due to the rapid heart rate (HR), one k-space line fore each cine image was acquired per heartbeat. Acquisition time was approximately 2 min per slice assuming a HR of 300 beats/min (bpm). Ten to 11 slices were typically required to span the entire LV.
The tagged images were generated by application of a SPAMM [10,11] preparation optimized previously for tagging the mouse heart [16]: the tagging sequence consisted of seven binomial RF pulses, the pulse duration was 100 μs with an interpulse delay of 256 μs during which time gradients with a trapezoidal envelope were applied; the tagging sequence was applied twice with gradients on the read and phase-encoding axes, respectively. The flip angle for the tagging train that gave the best contrast between the tags and myocardium varied between 110° and 130°. Other parameters of the tagging sequence were tag spacing of 1.1–1.3 mm, a tag thickness of 0.2 mm, TR 8 ms, TE 4 ms, FOV 6 cm2 and matrix 256 × 256. For some studies a rectangular FOV (6 × 3 cm) was used, accordingly the number of phase encodes was reduced to 128. The other imaging parameters were identical to those used for the cine study except for an increase in the number of signal average to a maximum of 32 to increase the signal-to-noise ratio. The acquisition time for one tagged slice was approximately 14 min if a rectangular FOV was used and approximately 27 min if a square FOV was used. The sequence was repeated for three slices positioned at the LV basal, midventricular, and apical levels with 3 mm spacing between adjacent slices. The duration for a complete MRI study including cine and tagging procedures was approximately 2–3 h.
Image analysis
Global function and infarction size
The global myocardial functional parameters were determined using the Image Browser program (Varian, Palo Alto, CA, USA) on a remote workstation as previously described [16]. The infarcted area was defined on the cine images as the myocardial region exhibiting significant thinning or akinesia during systole. Relative MI size was calculated by dividing the sum of the endo- and epicardial circumference occupied by the MI by the sum of the total left ventricular (LV) endo- and epicardial circumference [6,17]. This results in a measurement of relative infarct size as a percentage of the total LV circumference. Compared to measurement of infarction volume as the fraction of total LV volume, this method does not underestimate the infarction fraction when the wall thins out in the infarcted myocardium.
Strain analysis
The tagged images were exported to a Silicon Graphics (Mountain View, CA, USA) workstation for analysis using a custom-written program (SPAMMVU) [18]. LV epi- and endocardial contours were defined for each image. Tag intersection points over the cardiac cycle were tracked by the snakes algorithm [19]. Triangular elements defined by a set of three adjacent tag intersection points between the contours were analyzed by homogeneous strain method. Detailed descriptions of this analysis can be found in the literature [16,18,20,21] and is also briefly outlined here (Fig. 1): the deformation of the triangle from end diastole (ED) to end systole (ES) can be described by two orthogonal eigenvectors λ1 and λ2, also referred to as maximum and minimum principal stretches; the strain analysis yields eigenvalues of λ1 and λ2 (length of the vector), plus the orientation of λ1 defined by the angle β (°), which measures the angle between λ1 and the line connecting the centroid of the triangle and that of the ventricle; the maximum (E1) and minimum (E2) principal strains are related to the principal stretches by the following equation: [21]; the translational motion of the triangle is described by the displacement (D) of its centroid from ED to ES.
Fig. 1.
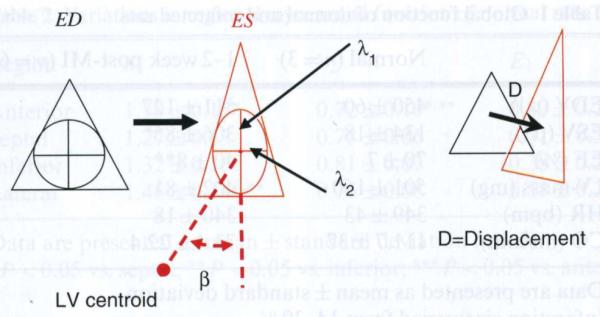
Homogeneous strain analysis of a triangle from ED to ES: deformation and translational movement. Strain describes the change of shape resulting from motion. A change of shape results in contraction or stretching of line segments. A hypothetical unit circle inscribed in the triangle at ED will be transformed by homogeneous motion into an ellipse at ES. The major and minor axes of this ellipse correspond to two orthogonal eigenvectors λ1 and λ2, and their lengths are eigenvalues. The strain analysis yields eigenvalues of λ1 and λ2 plus the orientation of λ1 defined by the β angle. The displacement (D) describes the translational motion of the triangle centroid from ED to ES
Results for the normal control rats were reported in two ways. (1) Strain values were reported for the anterior, septal, inferior and lateral region by dividing the short-axis LV myocardial wall into four almost equiangular segments beginning at the anterior insertion of the right ventricle. (2) For comparison with the infarcted rats, the LV of normal myocardial wall was divided into eight equiangular segments beginning at the insertion of the right ventricle; the two segments opposite to the septum were defined as the “infarcted” region, corresponding to the estimated LAD perfusion territory, the next segment on both sides was defined as the “adjacent” region and all other regions as “remote” regions (Fig. 2a).
Fig. 2.
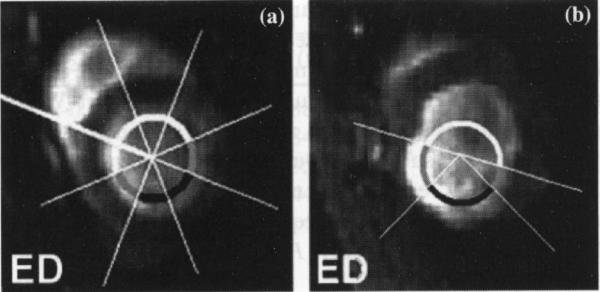
a, b Definition of infarcted, adjacent and remote region in normal (a) and infarcted rats (b). Panel A demonstrates the assignment of the “infarcted, adjacent and remote” region on an ED short axis image of a normal rat. The LV circumference is divided into eight equiangular septum beginning at the anterior insertion of the right ventricle. The segments (marked black) opposite to the septum are denned as the “infarcted” regions. The two segments (marked grey) next to the infarcted area are defined the “adjacent” regions, while all other regions are by definition remote myocardium. Panel B shows the short-axis image of an infarcted rat. The thinned and akinetic area corresponds to the infarcted region, while the adjacent zone is identified as a region with akinesia but normal wall thickness
In the post-MI rats, the infarcted region was defined by a thinned, akinetic wall which becomes apparent in the rat by the third day post-MI [22]. The adjacent zone was defined as an akinetic region with normal wall thickness, immediately adjacent to the infarcted region. All other regions were defined as remote myocardium (Fig. 2b). All three tagged slices were used for analysis.
Statistical data analysis
All data are presented as mean ± standard deviation (SD). For statistical analysis, a software package was used (Sigmastat, Point Richmond, CA, USA). A paired t-test was used to compare the same groups of animals at different time points and an unpaired t-test was used to compare strain values of infarcted rats with normal animals. When data were not normally distributed, or had unequal variances, a Mann–Whitney rank sum test was applied. An analysis of variance (ANOVA) with Bonferroni's subtest was used to compare normal strain values in different regions from normal rats. If the data were not normally distributed or had unequal variances a Kruskal–Wallis ANOVA on Ranks was used. A P-value of <0.05 was considered statistically significant.
Results
Global function in normal and infarcted animals
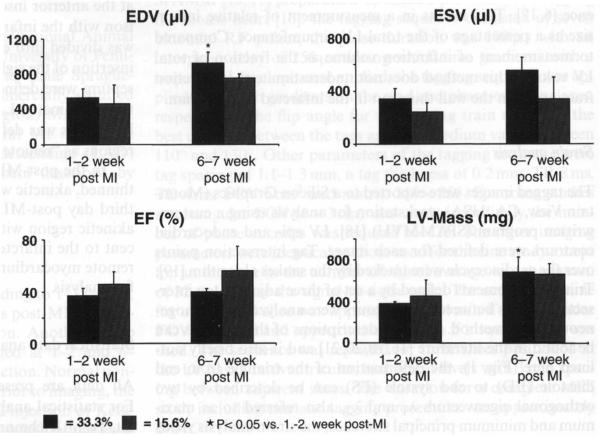
End diastolic volume (EDV), end systolic volume (ESV), ejection fraction (EF) and myocardial mass were measured in normal (n = 3) and infarcted rats (n = 6). At 1–2 weeks post-MI, there was a significant decrease in EF in the infarcted animals compared with the controls (P < 0.001, Table 1). ESV was significantly larger in the infarcted rats (P < 0.05), while EDV and mass did not increase significantly. The same infarcted rats were imaged again at 6–7 weeks post-MI for assessment of changes in global function. These rats were divided into two subgroups with a mean relative infarction size of 33.3% (±4.1%, n = 4) and 15.6% (±2.1%, n = 2); the infarction size differed significantly between the two groups (P < 0.05) and did not change over time. While there was an increase in EDV in both groups, the increase was significant only in the group with larger infarction size (P < 0.05, Fig. 3) and was accompanied by a significant increase in LV mass (P < 0.05) compared to the earlier time point (1–2 weeks post-MI).
Table 1.
Global function of normal and infarcted rats
| Normal (n = 3) | 1–2 week post-MI (n = 6) | |
|---|---|---|
| EDV (μl) | 450 ± 60 | 511 ± 127 |
| ESV (μl) | 134 ± 18 | 306 ± 85* |
| EF (%) | 70 ± 7 | 40 ± 8** |
| LV-mass (mg) | 501 ± 160 | 402 ± 81 |
| HR (bpm) | 349 ± 43 | 340 ± 18 |
| CO (ml/min) | 111.7 ± 37 | 73.4 ± 22.4 |
Data are presented as mean ± standard deviation
Infarction size varied from 14–39 %
P < 0.05;
P < 0.001
Fig. 3.
Change in global function in infarcted rats over time. EDV and LV mass were increased significantly over time in rats having a relative infarction size >30%
Regional function in normal and infarcted rats
Normal animals
Triangular elements were averaged by region (anterior, septal, inferior and lateral) and over slices (Table 2). The λ1 and E1 were positive in all myocardial regions, indicating systolic wall thickening. The absolute value of angle beta (|β|) revealed values between 7.2 and 13.16, thus indicating a predominantly radially-oriented direction of wall thickening. The λ2 value of less than one and the negative E2 value are consistent with circumferential shortening. Regional variations in function were observed: the greatest λ1 was observed in the lateral wall, while the smallest λ2 was observed in the anterior wall. These results were significantly different from the septal and inferior walls (P < 0.05); greater displacement was observed in the lateral and the inferior walls compared to the anterior and septal walls (P < 0.05). There were no significant regional differences in |β|, however the values were greater in the inferior and lateral walls (Table 2).
Table 2.
Variations in regional myocardial function of normal rats
| Region | λ 1 | λ 2 | E1 | E2 | D (mm) | |β| (°) |
|---|---|---|---|---|---|---|
| Anterior | 1.39 ± 0.15* | 0.72 ± 0.10*,** | 0.47 ± 0.21* | −0.23 ± 0.07*,** | 4.88 ± 3.18 | 7.20 ± 4.58 |
| Septal | 1.27 ± 0.13 | 0.78 ± 0.06 | 0.31 ± 0.31 | −0.19 ± 0.05 | 3.84 ± 2.11 | 7.99 ± 5.25 |
| Inferior | 1.32 ± 0.16 | 0.81 ± 0.07 | 0.38± 0.21 | −0.17± 0.05 | 8.35 ± 2.36*,*** | 13.16± 11.03 |
| Lateral | 1.46 ± 0.14*,** | 0.76 ± 0.08 | 0.58 ± 0.20*,** | −0.21 ± 0.06 | 9.44 ± 3.62*,*** | 8.97 ± 6.01 |
Data are presented as mean ± standard deviation (n = 3)
P < 0.05 vs. septal;
P < 0.05 vs. inferior;
P < 0.05 vs. anterior
Infarcted animals
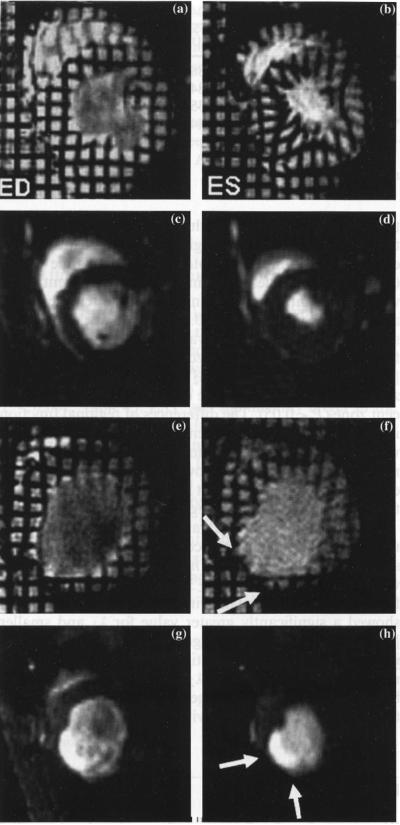
Figure 4 displays the cine and tagged images of an infarcted animal whose strain parametric maps are shown in Fig. 5. Because of the thinning of the infarcted wall, only a limited number of triangles could be analyzed in the infarcted region.
Fig. 4.
Representative tagged and non-tagged short-axis images of a normal and an infarcted rat. Images in the left column are ED images while those in the right column are ES images. Panels (A–D) represent a normal rat: A–B are tagged midventricular images while C–D are cine images. Panels E–H represent an infarcted rat. Tag deformation during ES was clearly seen in the normal rat. In contrast little or no tag deformation was observed in the infarcted, adjacent and remote region of the infarcted myocardium: a thinning in the antero-lateral wall was obvious and was accompanied by an increase not only in EDV but also ESV
Fig. 5.
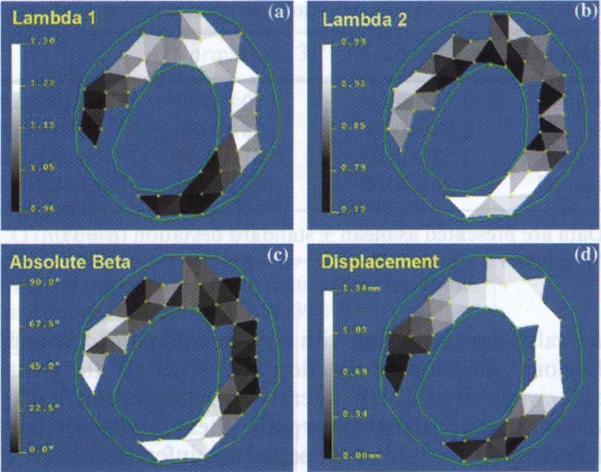
Parametric maps from homogeneous strain analysis. The regional function parameter maps can be generated by displaying gray scale or pseudo-color of the strain values. The contours (in green) define the epi- and endocardial borders of the LV wall
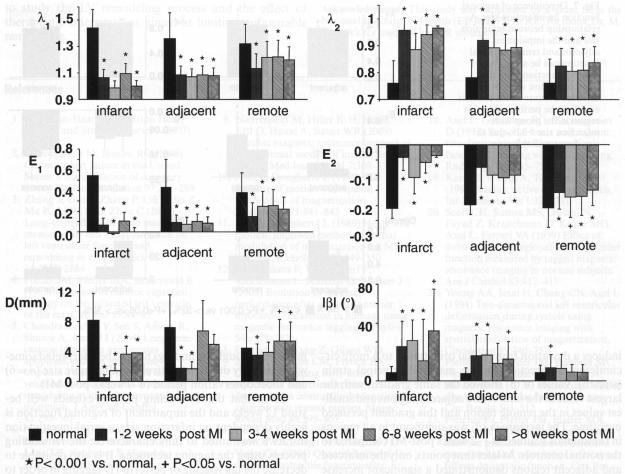
For comparison, regions corresponding to the infarcted, adjacent and remote zones in the infarcted rats were defined in the normal rats as described in the Methods. A marked reduction in systolic wall thickening (λ1, E1) and circumferential shortening (λ2, E2) was observed in all regions at all time points (1–12 weeks post-MI) compared to the normal controls (P < 0.05, Fig. 6); a significant increase of |β|, indicative of a more circumferentially-oriented λ1, was detected: (1) in the infarcted region at all time points, (2) in the adjacent region at all time points except for 6–8 weeks post-MI, (3) in the remote region only at 1–2 weeks post-MI; significant reduction of D was observed in the infarcted region at all time points (P < 0.001), whereas in the adjacent region, reduction of D was significant up to 4 weeks post-MI and recovered close to the normal value; in the remote region reduction of D only occurred at 1–2 weeks post-MI and was followed by a significant increase (P < 0.05) at 6–12 weeks post-MI (Fig. 6).
Fig. 6.
Comparison of regional cardiac function of normal rats with the infarcted rats over various time post-MI. A gradient of reduced myocardial function can be seen from the infarcted, through the adjacent and into the remote region. This gradient persists up to 12 weeks post-MI. Note, due to wall thinning in the infarcted region, strain data from the infarcted region was obtained from three (out of five) rats at 1–2 weeks, two (out of three) rats at 3–4 weeks, two (out of five) rats at 6–8 weeks and one (out of three) rat at 9–12 weeks post-MI
We further examined whether various regions exhibit a different extent of functional impairment by comparing strain parameters over infarcted, adjacent and remote zones in the infarcted rats. The impairment was more pronounced in the infarcted and adjacent zones than in the remote region: values of λ1 (E1) and λ2 (E2) in the infarcted and adjacent region were significantly different from those in the remote region at all time points (P < 0.05); |β| values in the infarcted and adjacent zones were significantly higher than those in the remote region at 1–4 weeks post-MI (P < 0.05); at 6–8 weeks post-MI, significant increase of |β| was only observed in the infarcted but not the adjacent zone. D has a similar trend as |β|. At 1–2 weeks post-MI, λ2 (E2) and D in the infarcted zone were significantly more depressed than in the adjacent zone (P < 0.05). The differences of regional function in infarcted, adjacent and remote zones were not due to variations of regional function observed in normal animals. Taken together, the above analysis suggests a gradient of functional impairment from the infarcted, through the adjacent to the remote region.
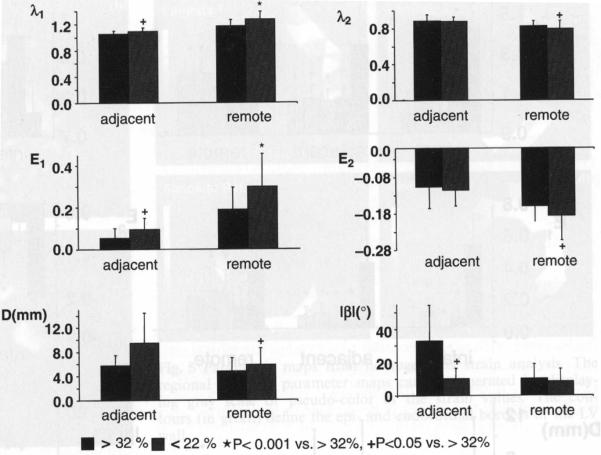
Relative infarction size was 26.1 ± 6.9% in 11 rats that underwent the tagging protocol. Three rats with relatively small infarction size (≤22%, n = 3) and another three rats with larger infarction size (≥32%, n = 3) were chosen for further analysis. Animals with a smaller infarction size showed a significantly greater value for λ1 and smaller |β| in the adjacent zone suggesting greater wall thickening which is less circumferentially oriented (Fig. 7); in the remote region λ1 (E1) and λ2 (E2) differed significantly between the two groups, suggesting a more preserved contractile function in the rats with smaller infarcts.
Fig. 7.
Dependence of regional function on infarction size. A relationship between infarction size and the impairment of adjacent and remote regional function can be seen. The regional function from the infarcted region was not included because strain analysis could not be performed in this region in the group with infarction size >32% due to significant wall thinning
Discussion
We report for the first time the regional myocardial function in normal and infarcted rats up to 12 weeks post-MI. At the early time point (1–2 weeks post-MI), impairment of regional function was present not only in the infarcted and adjacent zone but also in the remote zone. The regional function impairment also displayed a gradient across the infarcted, adjacent and the remote regions with the infarcted zone being most severely affected. We have confirmed the relationship between infarction size and the degree of global remodeling and extended these findings to describe the resultant regional functional impairment.
Global function in infarcted animals
All infarcted rats at 1–2 week post-MI had a significantly reduced EF which primarily resulted from an increase in ESV; Nahrendorf et al. [17] reported a similar depression in EF and an increase in ESV [6]. To examine the effect of infarction size on the change of global function between weeks 1–2 and 6–7 post-MI, the animals were divided into groups having a relative MI size of 33.3 and 15.6% respectively. A significant increase in EDV and LV-mass at 6–7 weeks post-MI compared to 1–2 weeks was observed in the group with a larger infarction size: the more pronounced changes in the EDV in these rats could be explained by a more pronounced structural dilatation and distension, as has been postulated previously by others [6,23], while the increase in mass could be attributed to the development of hypertrophy in the remote region [6].
Normal strain
In the short-axis orientation, λ1 (E1) is related to systolic wall thickening, and λ2 (E2) to circumferential shortening; if thickening was perfectly radial, then |β| would be zero. In the normal rats, the |β| was close to zero. The greater the |β|, the orientation of λ1 (E1) becomes more circumferential.
A significant variation in regional myocardial function was found in this study. While greater systolic thickening and circumferential shortening was observed in the anterior and lateral wall than the septal and inferior wall, the displacement was greater in the inferior and lateral wall and least in the septal wall. The standard deviation of λ2 (E2) was smaller than that of λ1 (E1 Similar findings have been reported in our previous study in mice [16] and in humans [14,20,21]; differences in myocardial fiber architecture have been suggested as a mechanism to explain the variation. For example, fiber orientation is more heterogeneous in the transmural direction and more uniform in the circumferential orientation [14,21].
Strain in infarcted animals
The strain values in the infarcted rats indicated a gradient of reduced myocardial function from the infarcted, through the adjacent and into the remote region up to 12 weeks post-MI. The findings at early post-MI are consistent with published data in mice, dogs and humans [13,14,24,25]. While the dysfunction in the infarcted region requires no further explanation, the changes in the adjacent region could be due to perfusion abnormalities at the microcirculatory level, inflammatory changes and mechanical tethering via the infarct-related myocardium. The tethering force and a change in the loading conditions could induce an impairment of regional function in the remote region. Additional changes in the material properties of the remote myocardium leading to dysfunction include hypertrophy and associated changes in protein expression, metabolism and fibrosis. The angle β is a surrogate marker for the tethering effect, because tethering induces a deviation from radial orientation to a more circumferential direction for the maximal principal strain (stretch). Values of |β| showed the same gradient with the largest value in the infarct and adjacent regions and smallest values in the remote region and this gradient persisted over time. The increase in |β| was significant in all regions in the animals scanned at 1–2 weeks post-MI compared to the normal controls. At later time points, only the infarcted and adjacent regions demonstrated a significant increase in |β|, suggestive of a redistribution of wall stress and a reduction of tethering forces, or simply different loading conditions at a later time point. However, the reduction in wall thickening and increase in |β| was much less in the rats with smaller infarctions than with larger infarctions. This finding suggests a relationship between infarction size and the impairment of regional function in the adjacent and remote zones; the larger tethering forces generated by larger infarctions could be a mechanism to explain a functional impairment in these rats. Finally, the changes seen in this model reflect those following a complete, nonreperfused ligation of LAD. It is quite possible that animals with a reperfused infarction may show a different extent of functional impairment, or altered mechanical properties of the myocardium related to changes in collagen metabolism.
Limitations
The described changes in global function post-MI are consistent with previously published data on MI in the rat model [6], though the findings have to be interpreted somewhat carefully due to a relatively small sample size (n = 6) and short observation period (6–7 weeks post-MI).
Given that the remodeling process extends well beyond 12 weeks and the impairment of regional function is highly dependent on infarction size, a serial investigation in rats is warranted to fully characterize the remodeling process using the tagging technique. It is also desirable to decrease the tag spacing or perform 1D tagging in order to obtain regional function in the infarcted myocardial wall undergoing significant thinning; at this point however, the maximal achievable tag spacing is limited by the technical capabilities of the scanner and the available radio-frequency coils.
Conclusion
We have characterized regional myocardial function using tagged MRI in normal and infarcted rats up to 12 weeks post-MI. In the infarcted and adjacent zones, not only was strain magnitude segmentally reduced, but strain direction became more circumferentially oriented. A gradient of regional function impairment across the infarcted, adjacent and remote region was demonstrated which persisted up to 12 weeks post-MI. Regional variations in wall motion and mechanical function were observed in normal rats. These results parallel findings in humans and underscore the suitability of utilizing the rat model and tagged MRI to study the LV remodeling process and the effect of therapeutic interventions aimed at limiting unfavorable remodeling.
Acknowledgements
This study was supported by a grant from the National Institutes of Health (EB-002473) to RZ. We thank Dr. M. Brennick for usage of his MR volume coil.
Abbreviations
- bpm
Beats per minute
- CO
Cardiac output
- D
Displacement
- E1, E2
Maximum and minimum principal strains respectively
- ECG
Electrocardiogram
- ED
End diastole
- EDV
End diastolic volume
- EF
Ejection fraction
- ES
End systole
- ESV
End systolic volume
- HR
Heart rate
- LAD
Left anterior descending
- LV
Left ventricular (ventricular)
- MI
Myocardial infarction
- |β|
Absolute value of angle beta
- λ1, λ2
Maximum and minimum principal stretches, respectively
References
- 1.American-Heart-Association Heart Disease and Stroke Statistics. 2003 Update. [Google Scholar]
- 2.Gheorghiade M, Bonow RO. Chronic heart failure in the United States: a manifestation of coronary artery disease. Circulation. 1998;97:282–289. doi: 10.1161/01.cir.97.3.282. [DOI] [PubMed] [Google Scholar]
- 3.Zhang S, Guo J, Zhang P, Liu Y, Jia Z, Ma K, Li W, Li L, Zhou C. Long-term effects of bone marrow mononuclear cell transplantation on left ventricular function and remodeling in rats. Life Sci. 2004;74:2853–2864. doi: 10.1016/j.lfs.2003.10.035. [DOI] [PubMed] [Google Scholar]
- 4.Pfeffer JM, Pfeffer MA, Braunwald E. Influence of chronic captopril therapy on the infarcted left ventricle of the rat. Circ Res. 1985;57:84–95. doi: 10.1161/01.res.57.1.84. [DOI] [PubMed] [Google Scholar]
- 5.Chandrashekhar Y, Sen S, Anway R, Shuros A, Anand I. Long-term caspase inhibition ameliorates apoptosis, reduces myocardial troponin-I cleavage, protects left ventricular function, and attenuates remodeling in rats with myocardial infarction. J Am Coll Cardiol. 2004;43:295–301. doi: 10.1016/j.jacc.2003.09.026. [DOI] [PubMed] [Google Scholar]
- 6.Nahrendorf M, Wiesmann F, Hiller KH, Hu K, Waller C, Ruff J, Lanz TE, Neubauer S, Haase A, Ertl G, Bauer WR. Serial cine-magnetic resonance imaging of left ventricular remodeling after myocardial infarction in rats. J Magn Reson Imaging. 2001;14:547–555. doi: 10.1002/jmri.1218. [DOI] [PubMed] [Google Scholar]
- 7.Saeed M, Bremerich J, Wendland MF, Wyttenbach R, Weinmann HJ, Higgins CB. Reperfused myocardial infarction as seen with use of necrosis-specific versus standard extracellular MR contrast media in rats. Radiology. 1999;213:247–257. doi: 10.1148/radiology.213.1.r99se30247. [DOI] [PubMed] [Google Scholar]
- 8.Schalla S, Wendland MF, Higgins CB, Ebert W, Saeed M. Accentuation of high susceptibility of hypertrophied myocardium to ischemia: complementary assessment of Gadophrin-enhancement and left ventricular function with MRI. Magn Reson Med. 2004;51:552–558. doi: 10.1002/mrm.20018. [DOI] [PubMed] [Google Scholar]
- 9.Nahrendorf M, Hiller K-H, Hu K, Ertl G, Haase A, Bauer WR. Cardiac magnetic resonance imaging in small animal models of human heart failure. Med Image Anal. 2003;7:369–375. doi: 10.1016/s1361-8415(03)00011-2. [DOI] [PubMed] [Google Scholar]
- 10.Axel L, Dougherty L. MR imaging of motion with spatial modulation of magnetization. Radiology. 1989;171:841–845. doi: 10.1148/radiology.171.3.2717762. [DOI] [PubMed] [Google Scholar]
- 11.Axel L, Dougherty L. Heart wall motion: improved method of spatial modulation of magnetization for MR imaging. Radiology. 1989;172:349–350. doi: 10.1148/radiology.172.2.2748813. [DOI] [PubMed] [Google Scholar]
- 12.Rademakers F, Van de Werf F, Mortelmans L, Marchal G, Bogaert J. Evolution of regional performance after an acute anterior myocardial infarction in humans using magnetic resonance tagging. J Physiol. 2003;546:777–787. doi: 10.1113/jphysiol.2002.026328. [DOI] [PMC free article] [PubMed] [Google Scholar]
- 13.Epstein FH, Yang Z, Gilson WD, Berr SS, Kramer CM, French BA. MR tagging early after myocardial infarction in mice demonstrates contractile dysfunction in adjacent and remote regions. Magn Reson Med. 2002;48:399–403. doi: 10.1002/mrm.10210. [DOI] [PubMed] [Google Scholar]
- 14.Gotte MJ, van Rossum AC, Twisk JWR, Kuijer JPA, Marcus JT, Visser CA. Quantification of regional contractile function after infarction: strain analysis superior to wall thickening analysis in discriminating infarct from remote myocardium. J Am Coll Cardiol. 2001;37:808–817. doi: 10.1016/s0735-1097(00)01186-4. [DOI] [PubMed] [Google Scholar]
- 15.Pfeffer JM, Pfeffer MA, Fletcher PJ, Braunwald E. Progressive ventricular remodeling in rat with myocardial infarction. Am J Physiol. 1991;260:H1406–H1414. doi: 10.1152/ajpheart.1991.260.5.H1406. [DOI] [PubMed] [Google Scholar]
- 16.Zhou R, Pickup S, Glickson JD, Scott CH, Ferrari VA. Assessment of global and regional myocardial function in the mouse using cine and tagged MRI. Magn Reson Med. 2003;49:760–764. doi: 10.1002/mrm.10423. [DOI] [PubMed] [Google Scholar]
- 17.Nahrendorf M, Wiesmann F, Hiller KH, Han H, Hu K, Waller C, Ruff J, Haase A, Ertl G, Bauer WR. In vivo assessment of cardiac remodeling after myocardial infarction in rats by cine-magnetic resonance imaging. J Cardiovasc Magn Reson. 2000;2:171–180. doi: 10.3109/10976640009146565. [DOI] [PubMed] [Google Scholar]
- 18.Axel L, Goncalves RC, Bloomgarden D. Regional heart wall motion: two-dimensional analysis and functional imaging with MR imaging. Radiology. 1992;183:745–750. doi: 10.1148/radiology.183.3.1584931. [DOI] [PubMed] [Google Scholar]
- 19.Kass M, Witkin A, Terzopoulos D. Snakes: active contour models. Int J Comput Vis. 1988;1:321–331. [Google Scholar]
- 20.Scott CH, Sutton MS, Gusani N, Fayad Z, Kraitchman D, Keanc MG, Axel L, Ferrari VA. Effect of dobutamine on regional left ventricular function measured by tagged magnetic resonance imaging in normal subjects. Am J Cardiol. 1999;83:412–417. doi: 10.1016/s0002-9149(98)00879-0. [DOI] [PubMed] [Google Scholar]
- 21.Young AA, Imai H, Chang CN, Axel L. Two-dimensional left ventricular deformation during systole using magnetic resonance imaging with spatial modulation of magnetization. Circulation. 1994;89:740–752. doi: 10.1161/01.cir.89.2.740. [DOI] [PubMed] [Google Scholar]
- 22.Pfeffer MA, Pfeffer JM, Fishbein MC, Fletcher PJ, Spadaro J, Kloner RA, Braunwald E. Myocardial infarct size and ventricular function in rats. Circ Res. 1979;44:503–512. doi: 10.1161/01.res.44.4.503. [DOI] [PubMed] [Google Scholar]
- 23.Fletcher PJ, Pfeffer JM, Pfeffer MA, Braunwald E. Left ventricular diastolic pressure-volume relations in rats with healed myocardial infarction. Effects on systolic function. Circ Res. 1981;49:618–626. doi: 10.1161/01.res.49.3.618. [DOI] [PubMed] [Google Scholar]
- 24.Kramer CM, Rogers WJ, Theobald TM, Power TP, Petruolo S, Reichek N. Remote noninfarcted region dysfunction soon after first anterior myocardial infarction. A magnetic resonance tagging study. Circulation. 1996;94:660–666. doi: 10.1161/01.cir.94.4.660. [DOI] [PubMed] [Google Scholar]
- 25.Kraitchman DL, Young AA, Bloomgarden DC, Fayad ZA, Dougherty L, Ferrari VA, Boston RC, Axel L. Integrated MRI assessment of regional function and perfusion in canine myocardial infarction. Magn Reson Med. 1998;40:311–326. doi: 10.1002/mrm.1910400217. [DOI] [PubMed] [Google Scholar]


