

Abstract
Hematopoietic cell clusters in the aorta of vertebrate embryos play a pivotal role in the formation of the adult blood system. Despite their importance, hematopoietic clusters have not been systematically quantitated or mapped because of technical limitations posed by the opaqueness of whole mouse embryos. Here, we combine an approach to make whole mouse embryos transparent, with multicolor marking, to allow observation of hematopoietic clusters using high-resolution 3-dimensional confocal microscopy. Our method provides the first complete map and temporal quantitation of all hematopoietic clusters in the mouse embryonic vasculature. We show that clusters peak in number at embryonic day 10.5, localize to specific vascular subregions and are heterogeneous, indicating a basal endothelial to non-basal (outer cluster) hematopoietic cell transition. Clusters enriched with the c-Kit+CD31+SSEA1– cell population contain functional hematopoietic progenitors and stem cells. Thus, three-dimensional cartography of transparent mouse embryos provides novel insight into the vascular subregions instrumental in hematopoietic progenitor/stem cell development, and represents an important technological advancement for comprehensive in situ hematopoietic cluster analysis.
Keywords: Hematopoietic clusters, Aorta, Vitelline artery, Umbilical artery, Mouse
INTRODUCTION
Ontogeny of the vertebrate hematopoietic system occurs in several distinct waves, with each sequential wave producing hematopoietic cells of progressively increasing functional complexity (Dzierzak and Speck, 2008). First, the yolk sac generates primitive erythrocytes and macrophages (Ferkowicz et al., 2003; Palis et al., 1999). Thereafter, progenitors with myeloid and erythroid potential are generated both in the mouse yolk sac and in an intra-embryonic region containing the aorta (Cumano et al., 1996; Lux et al., 2008). This intra-embryonic region contains the first multipotent progenitor cells with erythroid, myeloid and lymphoid activity at embryonic day (E) 8 (Cumano et al., 1996) and at E10.5 the aorta-gonad-mesonephros (AGM) autonomously generates the first adult hematopoietic stem cells (HSCs) (Medvinsky and Dzierzak, 1996; Muller et al., 1994). The major vessels of the midgestation mouse embryo, the vitelline artery (VA) and umbilical artery (UA), also contain HSCs at E10.5 (de Bruijn et al., 2000).
During midgestation, cell aggregates (called hematopoietic clusters) that are intimately associated with endothelium are observed in the large vessels of the mouse embryo [aorta, UA and VA (Garcia-Porrero et al., 1995; Garcia-Porrero et al., 1998; Jaffredo et al., 2005)] and in the yolk sac (Ferkowicz et al., 2003). The yolk sac cluster cells (E8.25) are CD41+ definitive hematopoietic progenitors (Ferkowicz et al., 2003). A developmental relationship between endothelial and hematopoietic cells was suggested from studies demonstrating the lymphohematopoietic potential of VE-cadherin-expressing cells of the mouse yolk sac and embryo body (Nishikawa et al., 1998; Fraser et al., 2002). Recent in vivo cell tracing experiments demonstrate that aortic hematopoietic cluster cells (and HSCs) transit through a VE-cadherin-positive stage, indicating that they arise from hemogenic endothelial cells – cells that function as the aortic endothelium but retain hemogenic potential (Chen et al., 2009; Zovein et al., 2008). To understand how hematopoietic cells are formed, it is necessary to define the precise localization of nascent hematopoietic progenitor/stem cells and to establish their association with the hematopoietic clusters in the aorta.
Hematopoietic clusters have been examined in a variety of vertebrate embryos (Jaffredo et al., 2005) and characterized by immuno- and histochemical staining of transversal sections (Garcia-Porrero et al., 1995; Garcia-Porrero et al., 1998; Jaffredo et al., 1998; Marshall and Thrasher, 2001; North et al., 1999; North et al., 2002; Taoudi and Medvinsky, 2007; Tavian et al., 1996). A reconstruction of an immunostained 5-week human embryonic aorta made from 72 transverse sections with a thickness of 5 μm each (one or two somite pairs in preumbilical region) shows 831 CD34+ clustered cells (Tavian et al., 1996). In the mouse embryo, at least some of the cells within hematopoietic clusters phenotypically resemble those of the AGM HSC fraction (North et al., 2002; Taoudi and Medvinsky, 2007). For example, expression of the Ly6A-GFP HSC marker is localized in some aortic endothelial cells and hematopoietic cluster cells (de Bruijn et al., 2002). Moreover, embryos deficient for the Runx1 transcription factor lack hematopoietic clusters, HSCs and progenitor cells (Cai et al., 2000; North et al., 1999; Okuda et al., 1996). Based on these findings, hematopoietic clusters are thought to contain nascent HSCs (Yoshimoto et al., 2008).
To date, no studies in the mouse embryo have quantitated all hematopoietic clusters temporally or spatially, or evaluated their size. The difficulty in detecting and quantifying all hematopoietic clusters along the length of the mouse aorta is that it requires analysis of ∼200 transverse (10 μm) sections from a single embryo. Cluster quantitation and localization along the intra-embryonic vessels should facilitate the study of specific vascular subregions/micro-environments that are instrumental in inducing hematopoietic cell emergence/cluster formation. To circumvent the obstacles posed by embryo sectioning, we used a combination whole-mount technique to observe all hematopoietic clusters in the embryo. We show here cartographic and quantitative data of hematopoietic clusters in the major embryonic arteries. Flow cytometric and functional studies demonstrate that hematopoietic progenitor/stem cells are enriched within the cluster population.
MATERIALS AND METHODS
Mice and embryos
Runx1 mutant mice (C57BL/6 background) have been described previously (Wang et al., 1996). Embryos were generated by timed matings between Runx1+/– males and females; C57BL/6-Ly5.2 or C57BL/6-Ly5.1 males and females. The day of vaginal plugging was considered embryonic day (E) 0. Embryos were staged according to embryonic day, somite pairs (sp) and Thelier criteria (http://genex.hgu.mrc.ac.uk/intro.html). E11 embryos were divided into three stages: TS18 (40-44 sp), TS19 (45-47 sp) and TS20 (48-51 sp). Animals were housed according to institutional guidelines, with free access to food and water.
Whole-mount immunostaining
Embryos were fixed for 20-30 minutes in 2% paraformaldehyde/PBS (6 ml) on ice, and dehydrated in graded concentrations of methanol/PBS (50%, 75%, 100%; 10 minutes each). The yolk sac, rostral half of the body, limb buds and lateral body wall were removed, and samples rehydrated through 50% methanol/PBS and several ice-cold PBS washes lasting 10 minutes each. Endogenous biotin activity was blocked with streptavidin/biotin blocking kit (Vector Laboratories) following the manufacturer's instructions. All subsequent incubations and washes were carried out at 4°C with gentle shaking on a rocker platform. Samples were incubated until the primary antibody was added (1 hour minimum) with 0.06 mg/ml serum (goat, donkey, rabbit or rat, all from Jackson ImmunoResearch) or with BSA (2 mg/ml) in PBS-MT (PBS containing 0.4% Triton X-100 and 1% skim milk). Samples were incubated overnight with primary antibody (or isotype Ig controls; eBioscience) diluted in PBS-MT, and washed three times in PBS-MT throughout the next day (for 2-3 hours per wash). Secondary antibody was added in PBS-MT and incubated overnight. When using multiple primary antibodies of different isotypes, all primary antibodies (and in the next step all secondary antibodies) were added simultaneously. If primary antibodies were from the same species, then the primary and secondary antibody incubations and washes were performed sequentially.
Rat anti-mouse primary antibodies used were for c-Kit (2B8), CD45 (30-F11), CD41 (MWReg30), Flk1 (Avas12) and biotinylated anti-CD31 (MEC 13.3) all from BD Biosciences; CD34 (RAM34), Tie-2 (TEK4), endoglin (MJ7/18) and VE-cadherin (eBioBV13) (all from eBioscience); F4/80 (Cl:A3-1, AbD Serotec) and GP1bβ (Xia.C3, emfret Analytics). Secondary antibodies were goat anti-rat IgG-Alexa647 (Invitrogen) and Cy3-streptavidin (Jackson ImmunoResearch) or Alexa488-streptavidin (Invitrogen). PGCs were detected with mouse anti-mouse SSEA1 antibody (MC-480, eBioscience), followed by goat anti-mouse IgM-Alexa488 (Invitrogen). For triple staining (CD45/Flk1/CD31 or CD45/CD41/CD31), mouse anti-mouse CD45.2 antibody (104, eBioscience) was used with donkey anti-mouse IgG-Cy3 (Jackson ImmunoResearch). Nuclei were visualized with SYTO13 (Invitrogen).
After the final secondary antibody incubation, the samples were washed in PBS-MT (1 hour), then PBS-T (three times for 20 minutes each). The samples were dehydrated in 50% methanol/PBS then 100% methanol for 10 minutes at each step.
The samples were mounted in a 1:2 mix of benzyl alcohol and benzyl benzoate (BABB) to increase the transparency of tissues. Low melting agarose (1%) was prepared and when cooled to 50°C, 10 μl was placed on a round coverslip mounted on a FastWell chamber (FW20, Grace Bio-labs). One end of the sample was placed in the agarose and 100% methanol added quickly. Methanol was replaced several times (with 1 minute between rinses) and then replaced two or three times with 50% BABB/methanol, then with 100% BABB two or three times until the sample was clear. A second coverslip was placed on the fastwell, and a glass slide secured on top with clear nail polish.
Whole-mount immunostaining with diaminobenzidine (DAB) was as described previously with slight modification (Takakura et al., 1997). In brief, embryos were treated with H2O2 for 15 minutes to block endogenous peroxidase activity, and stained with c-Kit antibody overnight at 4°C, followed by goat anti-rat Ig-HRP. After incubation in PBS containing 0.4% TritonX-100, 0.05% NiCl2 and 250 μg/ml DAB (Sigma), color was developed by adding H2O2 to 0.01%.
Confocal microscopy
Samples were analyzed with a confocal microscope (Zeiss LSM 510 Meta, Plan-Neofluar 20×/NA 0.5, Achroplan 40×/NA 0.8W, Achroplan 63×/NA 0.95W) by using multi-track sequential mode. Embryos were immobilized with 1% agarose in the 1 mm depth chamber made from FastWell (Grace Bio-Labs), and observed from the lateral side. Pinhole diameter was set at 1 Airy unit and steps were 0.8-2.3 μm per z-section. Three-dimensional reconstructions were generated from z-stacks with LSM Image Browser (Zeiss) or Volocity (Improvision) and converted to QuickTime files with ImageJ software. To measure the fluorescence intensity of cluster cells, we measured the pixel intensity of whole cluster by ImageJ software, and the value was divided by the number of cells within the cluster.
Cell preparation and flow cytometry
For analyzing E10.5 embryos, the caudal half was dissected just above the forelimbs, and fetal liver and heart were removed. VA and UA were kept in the embryo. For analyzing E11.5 embryos, AGM region was dissected from embryo. Single-cell suspensions were prepared by treating tissues with collagenase [0.125% in phosphate-buffered saline (PBS)/10% fetal calf serum (FCS)/1% penicillin/streptomycin] for 1 hour at 37°C. Cell number was counted by Coulter Counter Z1 (Beckman Coulter) at a threshold of 4.2 μm. Cells were stained with: APC-anti-c-Kit (2B8, BD Biosciences), FITC-anti-CD31 (MEC 13.3, BD Biosciences), PerCP-Cy5.5-anti-CD45 (30-F11, BD Biosciences), PE- or unconjugated anti-SSEA1 (MC-480, eBioscience), PE-anti-Flk1 (Avas12, BD Biosciences), PE-anti-endoglin (MJ7/18, eBioscience), PE-anti-F4/80 (Cl:A3-1, AbD Serotec), PE-anti-Tie-2 (TEK4, eBioscience), PE-anti-CD34 (RAM34, BD Biosciences), PE-anti-CD41 (MWReg30, Santa Cruz Biotechnology), FITC-anti-GP1bβ (Xia.C3, emfret Analytics), APC-anti-CD61 (HMβ3-1, Caltag Laboratories), PE-Cy7-anti-mouse IgM (R6-60.2, BD Biosciences). Dead cells were excluded by Hoechst33258 (Invitrogen) staining. Cells were analyzed or sorted by FACS Aria (BD Biosciences) and data analyzed by FlowJo software (Tree Star).
In vivo transplantation
Sorted cells from C57BL/6-Ly5.1 mice were co-injected intravenously with spleen cells (2×10⁵, Ly5.2) into 9.0 Gy-irradiated (129SV×C57BL/6) mice. AGM equivalent of peripheral blood was 37,000 cells, as estimated by using Ter119+CD31– population in FACS analysis (data not shown). Repopulation was assayed at 1 and 4 months post-transplantation. Cells obtained from peripheral blood, spleen, bone marrow and thymus were stained with antibodies to CD45.1 (A20-FITC or APC), CD45.2 (104-APC), Mac-1 (M1/70-PE), Gr-1 (RB6-8C5-FITC or PE), CD3e (17A2-PE), B220 (RA3-6B2-PE), c-Kit (2B8-FITC), CD4 (GK1.5-PE) and CD8 (53-6.7-FITC). Cells were analyzed by FACScan or FACS Aria (BD Biosciences). Only mice with more than 5% donor chimerism were considered repopulated.
Methylcellulose colony-forming assay
Sorted cells were seeded in triplicate in methylcellulose medium (Methocult GF M3434; Stem Cell Technologies) containing SCF, IL3, IL6, and erythropoietin and incubated at 37°C, 5% CO2. Colony formation was scored with an inverted microscope after 7-8 days of culture.
Statistical analysis
Statistical analysis was performed using Student's t-test.
RESULTS
Three-dimensional whole embryo analysis of vascular hematopoietic clusters
Whole-mount immunostaining with anti-c-Kit (Kit – Mouse Genome Informatics) antibody (hematopoietic marker) and anti-CD31 (Pecam1 – Mouse Genome Informatics) antibody (endothelial and hematopoietic marker) was used together with a benzyl alcohol:benzyl benzoate (BABB) embryo transparency technique (Davis, 1993; Yokomizo et al., 2001) for confocal microscopic imaging of internal vasculature and hematopoietic cell clusters. Three-dimensional (3D) reconstructions of the whole embryo were generated (see Fig. S1 in the supplementary material). Hematopoietic clusters were found only in the major arteries (aorta, vitelline and umbilical) (see Figs S1 and S2 in the supplementary material) and were c-KithighCD31+ when compared with c-Kitlow/–CD31– circulating hematopoietic cells (see Figs S2 and S3 in the supplementary material).
In the embryo proper, c-Kit+ cells were first detected in VA and UA around the 20-somite pair (sp) stage (not shown). At E9.5 (22 sp), the VA (omphalomesenteric artery) runs ventro-parallel to aorta and within this artery c-Kit+ cells were observed only on the ventral side (see Fig. S4A in the supplementary material). At this stage, no c-Kit+ cells were observed in the aorta.
The first c-Kit+ cells (0-5 cells) were detected in the aorta at E9.5 (the 24/25 sp stage; not shown). Between E9.5 and E10.5, restructuring of the VA proceeds (Garcia-Porrero et al., 1995). It is fused to the middle part of aorta, and is disconnected from UA (see Fig. S4 in the supplementary material). By E10.5, relatively large numbers of c-Kit+ cells were present in the aorta (Fig. 1A). Three-dimensional reconstructions (see Movie 1 in the supplementary material), made from z-series images of the E10.5 aorta (see Fig. S2A in the supplementary material for imaging orientations) reveal hematopoietic clusters in the lumen along the rostral to caudal length of the aorta. Most clusters were ventrally localized, although some clusters were also observed along the dorsal wall, confirming a previous report showing dorsal clusters in E11.5 immunostained sections (Taoudi and Medvinsky, 2007). Similarly, clusters were found in the E11.5 aorta (Fig. 1B). Three-dimensional reconstructions show that both the number and size of aorta c-Kit+ clusters are decreased at E11.5 (see Movie 2 in the supplementary material), despite the increase in size of the whole E11.5 embryo. Ninety-nine percent of c-Kit+ cluster cells (n=984 cells; three embryos) attached to the aorta were CD31+ (Fig. 1C). Endothelial cells expressed only CD31. High magnification of a typical cluster in an E10.5 aorta demonstrates the close association of the cluster to the aortic endothelium (Fig. 1D). In addition to clusters, we observed some single c-Kit+ cells integrated/attached to the endothelium (see Discussion). Although the term `cluster' does not describe those cells, we included them in this study of hematopoietic clusters.
Fig. 1.

Three-dimensional analysis of aortic hematopietic clusters. (A) Confocal image of c-Kit and CD31 expression in the mouse aorta region at E10.5 (35 sp) and (B) E11.5. c-Kit+ clusters (green) are attached to CD31+ endothelial cell layer (magenta). Scale bars: 100 μm. See Movie 1 in the supplementary material for E10.5 and Movie 2 for E11.5 3D images. (C) Representative cluster stained for CD31 and c-Kit expression. CD31 is expressed by both endothelial cells and hematopoietic clusters (magenta, top panel), and c-Kit is expressed by hematopoietic cluster cells (middle panel). Merged fluorescence (bottom panel). Scale bar: 20 μm. (D) Higher magnification image of hematopoietic clusters at 35 sp. Scale bar: 20 μm. VA, vitelline artery.
Temporal quantitation shows peak of cluster formation in the aorta at E10.5
Precise cartography and quantitation of hematopoietic clusters within the aorta was performed systematically at times relevant to definitive hematopoietic development. Limiting numbers of c-Kit+ cells (about 0-5) were found in the aorta at E9.5 (not shown). As shown for one representative E10.5 embryo (Fig. 2A), the aorta contains 578 c-Kit+ cells. The map of a representative E11.5 embryo shows 445 c-Kit+cells (Fig. 2B). Clusters localize not only on the ventral side but also the dorsal side of the aorta and along the rostral-caudal length. The distribution of clusters is also shown in the VA and UA of the representative E10.5 and E11.5 embryos. Size of hematopoietic clusters varied from 1 to 19 cells at E10.5, and at E11.5, from 1 to 11 cells.
Fig. 2.

Spatio-temporal mapping of aortic hematopoietic clusters. (A,B) Cartographic distribution of c-Kit+ cells within mouse aorta at (A) E10.5 and (B) E11.5. Each dot represents one c-Kit+ cell, with numbers indicating c-Kit+ cells per cluster (except for single and two cell clusters). Red numbers indicate clusters with more than 10 cells. Concentrations of clusters are found around the middle segment of the aorta (see Fig. S5 in the supplementary material). Maps are made from whole-mount immunostaining with DAB. DA, dorsal aorta; FL, fetal liver; UA, umbilical artery; VA, vitelline artery.
Quantitative data collected from more than 20 3D imaged embryos are summarized in Fig. 3A and show that hematopoietic cluster numbers in the aorta peak at E10.5 (609±84 c-Kit+ cells). Cluster numbers significantly decrease by E11.5 (439±87 c-Kit+ cells). In contrast to previous observations made by the tissue-sectioning method (Garcia-Porrero et al., 1995), hematopoietic clusters could be observed by our technique after E12.5. At E14.5, 30-40 single c-Kit+ cells were still detected. Although they may be simply attached to the endothelium, their integration in the endothelial layer is consistent with endothelial to hematopoietic transition. The number of large cell clusters (clusters containing more than 10 cells) also significantly decreases between E10.5 and E11.5 (Fig. 3B). Interestingly, the distribution of clusters in the E10.5 aorta showed that ∼37% were localized to the dorsal wall (Fig. 3C). Clusters were also quantitated along the rostral-caudal axis of the aorta. At both E10.5 and E11.5, the majority of the clusters localized to the middle segment of the aorta (length of middle segment=7 sp, see Fig. S5 in the supplementary material), around the junction with the VA (Fig. 3D).
Fig. 3.

Spatio-temporal quantitation of mouse hematopoietic clusters. (A) Number of aortic c-Kit+ cells/clusters at different times of development. Embryonic day (E) and somite pairs (sp) are indicated. (B) Number of aortic hematopoietic clusters with more than 10 cells at E10.5 (35 sp) and E11.5 (45-47 sp, TS19). Results are mean ± s.d. of five embryos. P<0.0001. (C) Percentage of c-Kit+ cells distributed dorsoventrally in E10.5 (35 sp) aorta. Results are mean ± s.d. of five embryos. P<0.0001. (D) Number of c-Kit+ cells distributed along the antero-posterior axis of aorta E10.5 and E11.5. Middle segment is 7 sp (see Fig. S5 in the supplementary material). Results are mean ± s.d. of five embryos (*P<0.001, **P<0.0001, compared with middle segment).
Quantitation of vitelline and umbilical artery clusters
Identical to the aorta clusters, there is a close association of hematopoietic clusters to the endothelial cells of the VA and UA, as determined by 3D imaging analysis at E10.5 (Fig. 4) and E11.5 (not shown). Cluster cells are c-Kit+CD31+, whereas the arterial endothelial cells are only CD31+. Cartography and quantitation of VA and UA clusters was performed. Maps of E10.5 arteries show clusters on all circumferential aspects of the VA and cluster size variation of one cell to 76 cells (Fig. 5A). E10.5 UA clusters were localized mainly on the dorsal side of the vessel. Cluster size varied from 1 to 48 cells (Fig. 5B). At E11.5, cluster numbers and the size of clusters decreased in both the VA and UA (Fig. 5C,D).
Fig. 4.

Hematopoietic clusters in mouse VA and UA. (A-F) Representative clusters in E10 (33 sp) (A-C) vitelline and (D-F) umbilical arteries. (A,D) CD31 (magenta) is expressed by both hematopoietic clusters and endothelial cells, and (B,E) c-Kit expression (green) specifically marks hematopoietic clusters. (C,F) Merged fluorescent images. Scale bars: 20 μm.
Fig. 5.

Cartography and quantitation of hematopoietic clusters in mouse VA and UA. Cartographic distribution of c-Kit+ cells within (A,C) VA (outside embryo proper) and UA (B,D) at E10.5 and E11.5, respectively. Each dot represents one c-Kit+ cell and the number of c-Kit+ cells per cluster is indicated (except single- and two-cell clusters). Red numbers indicate clusters with more than 10 cells. Arrows indicate blood flow direction to the yolk sac (YS) for VA and to the placenta (PL) for UA. Maps made from DAB whole-mount immunostaining. (E) Number of c-Kit+ cells in VA and UA at E10.5 and E11.5 (n=3 for E10.5 VA and E10.5/E11.5 UA; n=2 for E11.5 VA). (F) Number of large (more than 10 cells) hematopoietic clusters in E10.5/E11.5 VA and UA. VA, vitelline artery; UA, umbilical artery.
A summary of these data from several embryos show that the numbers of c-Kit+ cell clusters peak at E10.5 (averaging 250-300 clusters) in both the VA and UA and decrease between E10.5 and E11.5 (Fig. 5E). In addition, the number of large c-Kit+ clusters in the VA and UA (Fig. 5F) decreases between E10.5 and E11.5. The number of cells per large cluster in these arteries exceeds that found in the clusters of the aorta at E10.5 (Fig. 2) and confirms previous observations on cluster size (Garcia-Porrero et al., 1995).
Cellular heterogeneity of hematopoietic clusters
To further examine the cellular composition of the hematopoietic clusters, multicolor immunostaining was performed with other markers of endothelial cells and hematopoietic stem, progenitor and/or mature cells. We focused mainly on E10.5 embryos. Similar to CD31 expression, Flk1 (Kdr – Mouse Genome Informatics) (Fig. 6A-C) and VE-Cadherin (Cdh5 – Mouse Genome Informatics) (see Fig. S6 in the supplementary material) were expressed by endothelial cells of the embryonic vasculature. By contrast, high-magnification images show that only very few and only the basal-most localized cluster cells expressed Flk1 (low level) (Fig. 6D-F). This result is consistent with in situ hybridization data from chick embryos showing the extinction of Flk1 expression in the clusters (Jaffredo et al., 1998) and suggests that the cluster cells located closest to the endothelium of the aorta and UA possess some endothelial characteristics.
Fig. 6.

Heterogeneity within hematopoietic clusters. (A-L) Whole-mount immunostaining of E10.5 mouse embryos for (A-F) CD31 (magenta) and Flk1 expression (green), and (G-L) CD31 (magenta) and CD45 (blue) expression. Movie 3 in the supplementary material shows a 3D reconstruction of A-C,G-I. (D-F,J-L) High magnification of hematopoietic clusters. Only basal cells of hematopoietic clusters are positive for Flk1 (E, arrow). (M,N) Whole-mount immunostaining of E9.5 embryos for CD31 (magenta) and CD45 (blue) expression. Arrows indicate CD31+CD45– clusters. Scale bars: 100 μm in A,G; 20 μm in D,J,M,N. (A-F) 35 sp embryo. (G-L) 34 sp embryo. (M) 24 sp embryo. (N) 25 sp embryo. VA, vitelline artery.
Expression of the pan-hematopoietic marker CD45 (Ptprc – Mouse Genome Informatics) was examined (Fig. 6G-I). Whole embryo 3D reconstructions showed a surprisingly large number of CD45+ cells scattered around the aorta and throughout the trunk region (see Movie 3 in the supplementary material), as was also found in immunostained chick, mouse and human embryos (Garcia-Porrero et al., 1995; Garcia-Porrero et al., 1998; Jaffredo et al., 1998; Marshall and Thrasher, 2001; North et al., 1999; North et al., 2002; Taoudi and Medvinsky, 2007; Tavian et al., 1996). Ninety-eight percent of these cells were found to be F4/80+ macrophages (see Fig. S7 in the supplementary material). CD45+ cells were also found within the aortic hematopoietic clusters (Fig. 6J-L). Not all cluster cells expressed CD45. In contrast to Flk1 expression by cells in the basal position, CD45+ cells were found mainly in the (non-basal) outer region of the clusters and show the spherical shape typical of hematopoietic cells. Thus, Flk1 and CD45 expression appears to be mutually exclusive among the cells of the hematopoietic clusters (see Fig. 7E for FACS plots showing no overlap in Flk1- and CD45-expressing cluster cells). Given that there may be a developmental time lag between hematopoietic cluster formation and CD45 expression, we examined hematopoietic clusters in the aorta at the 28 and 29 sp stages. No CD45 expression was found in any of the cluster cells (Fig. 6M,N).
Fig. 7.

Flow cytometric enrichment of mouse hematopoietic cluster cells. (A,B) FACS analysis of the caudal half region and of VA and UA cells at E10.5 (34-36 sp). (B) Red and blue dots in the right panel indicate macrophages and PGCs, respectively. No/few of these cells are present in the cluster gate. (C) Whole-mount immunostaining for c-Kit, CD31 and SSEA1 expression at E10.5 (36 sp). c-KitloCD31+SSEA1+ PGCs are localized ventrolaterally under aorta. Movie 4 in the supplementary material shows a 3D image. Scale bar: 100 μm. Graph shows relative intensity of c-Kit staining on cluster cells and SSEA1+ PGCs. (D) Quantification of PGCs and clusters in the caudal half region, and in the VA and UA using immunofluorescence and FACS analysis at E10.5 (34-36 sp). Average number per embryo is indicated. Numerous c-Kit+CD31+ cells are present in small vessels connected to VA (not shown) and are included in this quantification. (E) CD45 and Flk1 expression within the cluster gate. Most CD45hi cells (red box, middle panel) within the cluster gate are Flk1 negative (red dots, right panel). (F) Hematopoietic cluster stained with anti CD45, CD31 and Flk1 antibodies. (G) Whole-mount immunostaining of Runx1–/– embryo for c-Kit and CD31 expression. Scale bar: 100 μm. No c-Kit+ cells were observed in Runx1–/– aorta. Movie 5 in the supplementary material shows a 3D image. Graph shows the number of c-Kit+ cells part dorsal aorta (DA) from Runx1+/+ (E10.5, 35-37 sp) and Runx1–/– (E10.5, 35 and 36 sp); n=3. (H) FACS analysis of Runx1+/+ and Runx1–/– embryos. Cluster gate cells were absent in Runx1–/– embryos. Six Runx1–/– embryos (E10, 28-34 sp) analyzed gave consistent data. VA, vitelline artery.
Correlating 3D imaging of hematopoietic clusters with flow cytometric analysis
Whole-mount confocal microscopic analysis revealed that hematopoietic clusters are c-Kit+CD31+ cells (Fig. 1). No other c-Kit+CD31+ cells, except primordial germ cells (PGCs) and a few circulating cells, were observed within the AGM region. To verify the quantitation of hematopoietic clusters in our whole embryo imaging method, the c-Kit+CD31+ population was isolated using the fluorescence activated cell sorter (FACS). The flow cytometric profile of c-Kit and CD31 stained E10.5 cells showed no separate and obvious c-Kit+CD31+ population to distinguish hematopoietic clusters from other populations (Fig. 7A). Therefore, to determine a gate position for hematopoietic clusters, we took advantage of markers for two cell lineages, macrophages and PGCs, which are observed around aorta. Macrophages are the c-Kit–CD31–CD45+ cells in the red boxed area of the CD45/c-Kit FACS plot (Fig. 7B, left panel) and correspond to the red dots in the c-Kit/CD31 plot (right panel). Three-dimensional multicolor whole embryo imaging analysis shows PGCs as the c-Kitlo/–CD31+SSEA1+ (Fut4 – Mouse Genome Informatics) cells in the tissue lying ventrolateral to the aorta at E10.5 (Fig. 7C and Movie 4 in the supplementary material). In the SSEA1/CD31 FACS plot (Fig. 7B, middle panel), CD31+SSEA1+ PGCs are the distinct population in the blue box and correspond to the blue dots in c-Kit/CD31 plot (right panel). The majority of the E10.5 hematopoietic cluster cells had higher a c-Kit intensity compared with PGCs and macrophages, and thus, the cluster gate was set as indicated by the black box in the CD31/c-Kit plot (Fig. 7B, right panel). After the exclusion of SSEA1+ PGCs in this region, enrichment of hematopoietic cluster cells was increased slightly and represented 0.066±0.018 % of cells in the cluster gate. Numbers of SSEA1+CD31+ PGCs and c-Kit+CD31+SSEA1– hematopoietic cluster cells estimated from FACS analysis were similar to those counted in whole embryo 3D immunofluorescence images at E10.5 (Fig. 7D). At E11.5, 3D imaging quantitation showed 439±87 c-Kit+CD31+ cluster cells in the AGM, while the FACS cluster gate revealed 346±72 c-Kit+CD31+SSEA1– cells.
To further confirm whether the c-Kit+CD31+SSEA1– population is enriched for hematopoietic cluster cells, we examined CD45 and Flk1 expression within this gate. Heterogeneous and mutually exclusive expression of these two markers was observed within the cluster gate (Fig. 7E) and by cluster imaging (Fig. 7F). Moreover, when we analyzed Runx1-deficient embryos (Chen et al., 2009; North et al., 1999; Yokomizo et al., 2001), 3D reconstructions showed no c-Kit+ hematopoietic clusters in the aorta (Fig. 7G and Movie 5 in the supplementary material), while c-Kitlo expressing PGCs were still found ventrolateral to the aorta. Consistently, no cells were found within the cluster gate for Runx1-deficient mice (Fig. 7H). Taken together, the c-Kit+CD31+SSEA1– gated cell population represents an enriched hematopoietic cluster cell population. This population may include a few c-Kit+CD31+SSEA1– cells from the circulation.
Prediction of other marker expression patterns within hematopoietic clusters
Multicolor 3D imaging of the aorta (Fig. 6) together with FACS analysis of cluster cells (Fig. 7E) suggests that the expression patterns of CD45 and Flk1 are mutually exclusive in the outer and basal cells (respectively) of the hematopoietic clusters. This exclusive expression was also observed in the cluster gate in FACS analysis (Fig. 8A) and suggested that FACS analysis could be used to predict the expression pattern of other cell surface markers within the hematopoietic clusters of whole immunostained embryos. We first examined the expression of F4/80 (marker of mature macrophages) and endoglin (which is expressed by endothelial cells and adult HSCs). Expression of F4/80 was not detected within the FACS cluster gate, while the majority of cells within cluster gate were Endoglin positive (Fig. 8B). Consistent with this cluster gate data, immunofluorescence analysis showed that all cells within hematopoietic clusters express endoglin and none of the cluster cells express F4/80 (Fig. 8C), thus confirming the prediction.
Fig. 8.
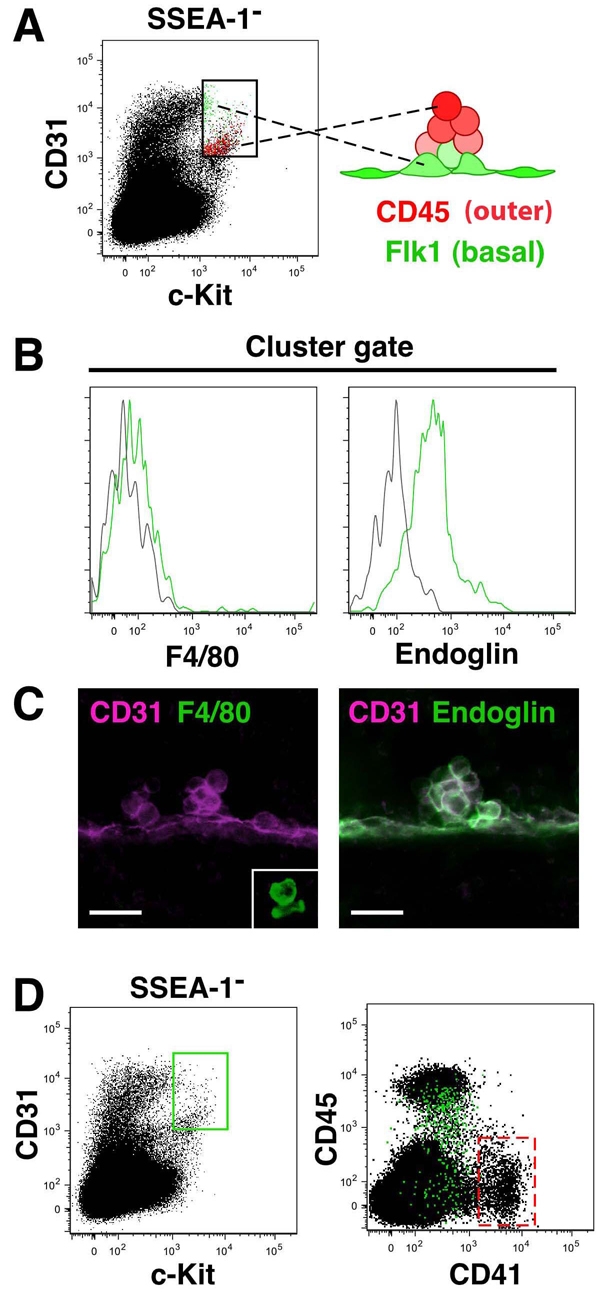
FACS-based prediction of surface marker expression in mouse hematopoietic clusters. (A) Localization of CD45+ (outer) and Flk1+ (basal) cluster cells (right, a model made from Fig. 6 and Fig. 7F), and the cluster gate (left). FACS plot for CD31 and c-Kit shows Flk1+ (green) and CD45+ (red) cells within the cluster gate. (B) FACS profile showing no/low F4/80-expressing cells (green line) in the cluster gate (left panel) and endoglin (green line) expression on all cells (right panel) in cluster gate. The FACS plots predict expression of endoglin but not F4/80 within hematopoietic clusters of whole-mount immunostained embryos. (C) Confirmation of F4/80 and endoglin localized expression (green) within E10.5 hematopoietic clusters. CD31 is in magenta. Two clusters (left panel) are CD31+F4/80–. Inset in left panel shows a CD31–F4/80+ macrophage in the mesenchyme. Right panel shows a large CD31+endoglin+ cluster. Scale bars: 20 μm. (D) Prediction of CD41 expression within hematopoietic clusters. FACS profiles of the caudal half region, VA and UA cells at E10.5 (34 and 35 sp). Cluster gate cells (box in left panel) are shown as green dots in the right panel. Expression of CD41 in the cluster gate is lower than in the CD41hi megakaryocyte lineage (red dotted box, see Fig. S8 in the supplementary material).
CD41 FACS analysis was performed next. CD41 is the earliest marker of hematopoietic commitment and is also expressed by megakaryocytes and hematopoietic stem/progenitor cells during embryonic stages (Ferkowicz et al., 2003; Matsubara et al., 2005; Mikkola et al., 2003) (XXX Robin, personal communication). As shown in the FACS plot of CD41- and CD45-stained E10.5 cells (Fig. 8D, right panel), the majority of the c-Kit+CD31+SSEA1– cluster gate cells (Fig. 8D, left panel) express low levels of CD41 (green dots in the CD41/CD45 plot). The red boxed area in the CD41/45 plot shows cells of the megakaryocyte lineage (Fig. 8D, right panel), as verified by co-expression of CD61 and GP1bβ (see Fig. S8A in the supplementary material). These cells express high levels of CD41 and are not found in the c-Kit+CD31+SSEA1– cluster gate. Moreover, both CD41lowCD45– and CD41lowCD45+ cells are found in the cluster gate, suggesting that CD41 would be expressed in the basal and outer cells of the hematopoietic clusters.
Three-dimensional imaging confirmed these predictions: high CD41 expression was found in large cells circulating through the aorta and other vessels (Fig. 9A and Movie 6 in the supplementary material). These cells are phenotypically megakaryocytes, as determined by CD61 and GPIbβ FACS and 3D immunostaining (see Fig. S8B in the supplementary material). In the CD31+ hematopoietic clusters, the majority of cells within the clusters express CD41 weakly (Fig. 9B-D). To determine more precisely the position of CD41lo cells in the hematopoietic clusters, multicolor staining was performed with CD41, CD45 and CD31. High-magnification images show the CD41lo-expressing cells in a basal position within the hematopoietic clusters in addition outer positions (Fig. 9E-H). Moreover, these cells are mostly CD45–. Thus, taken together with the Flk1 marker data, these phenotypic characterization and localization data suggest endothelial to hematopoietic immature to hematopoietic mature cell transitions that correlate with basal (endothelial) to non-basal, outer positioning within the hematopoietic cluster.
Fig. 9.
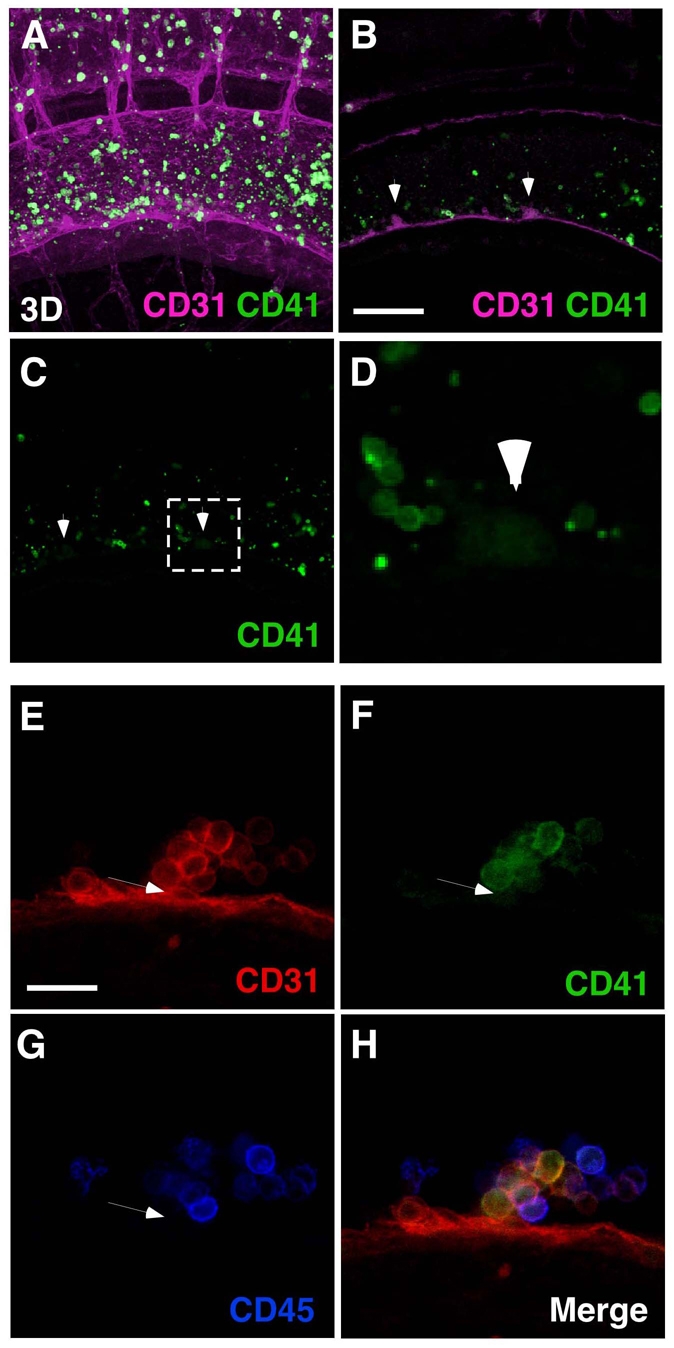
Three-dimensional imaging of surface marker expression in mouse hematopoietic clusters Confocal analysis of CD41 expression at E10.5 (36 sp). (A-D) Images showing CD41 high and low expressing cells. Movie 6 in the supplementary material shows a 3D reconstruction. CD41hi cells (megakaryocytes and platelets) circulating in aorta and small vessels. Consistent with FACS-based prediction shown in Fig. 8D, CD41 expression is lower in cluster cells than in magakaryocytic lineage. Arrowheads in B and C indicate clusters. Scale bar: 100 μm. (D) Magnification of the boxed region in C. (E-H) Expression of CD31, CD41 and CD45 in hematopoietic cluster at E10.5 (35 sp). CD41 expression was detected in the basal and other cells throughout cluster. A CD31+CD41lo cell (arrowheads in E-G) with a semi-circular shape is negative for CD45. Scale bar: 20 μm.
The enriched hematopoietic cluster population contains hematopoietic progenitors and HSCs
To assess the functional capacity of the enriched hematopoietic cluster population in E10 embryos (31-34 sp), we sorted SSEA1– cells into four fractions based on staining with anti-CD31 and anti-c-Kit antibodies (Fig. 10A), and performed methylcellulose colony assays (Fig. 10B). Colony-forming capacity was enriched in c-Kit+CD31+SSEA1– (hematopoietic clusters; R2) and c-Kit+CD31– fractions (circulating cells in Fig. S2 in the supplementary material; R3), but not in c-Kit–CD31+SSEA1– (endothelial cells; R1) or R4 fractions. To test the long-term repopulating ability, fractions R1-R4 from early E10 (31-34 sp) embryos (caudal half + VA and UA) were injected into irradiated adult recipients. No donor cell repopulation was detected at 4 months post-transplantation (Fig. 10C), consistent with previous observations that HSC activity in the AGM and the VA and UA begins at the 35 sp stage (Muller et al., 1994). When the same R1-R4 fractions from E11.5 AGM region were transplanted, long-term hematopoietic repopulation was found only in the recipients injected with the enriched cluster population cells (Fig. 10C). The hematopoietic reconstitution was high level and multilineage, with donor-derived macrophage, granulocytes, B and T lymphocytes detected in peripheral blood (Fig. 10D) and other hematopoietic organs (data not shown). As a control for circulating cells, E11.5 peripheral blood was tested similarly. When five embryo equivalents of blood cells were transplanted, none of the 15 irradiated adult recipients was repopulated. Thus, the c-Kit+CD31+SSEA1–-enriched hematopoietic cluster population contains functional hematopoietic progenitors and HSCs.
Fig. 10.

Functional analyses of enriched mouse hematopoietic cluster cells. (A) FACS profile of the caudal half region, VA and UA cells at E10 (31-34) sp. SSEA1– cells were sorted into four populations: R1 (endothelial cells, 0.37±0.12%), R2 (hematopoietic clusters, 0.081±0.009%), R3 (0.10±0.03%) and R4 (75.5±6.0%). (B) Methylcellulose colony-forming assay of sorted cells from 31-34 sp embryos. CFU-GEMM, CFU-G/M/GM and BFU-E were counted after 7-8 days of culture. Results are mean ± s.d. of three independent experiments. (C) HSC activity in hematopoietic clusters. *Secondary repopulation was also observed. **AGM equivalent. VA, vitelline artery; UA, umbilical artery; PB, peripheral blood. (D) Representative hematopoietic multi-lineage FACS profile of long-term reconstituted mice. Peripheral blood was analyzed 4 months post-injection.
DISCUSSION
Internal visualization of hematopoietic clusters along the entire aorta and VA and UA provides new insight into hematopoietic progenitor and stem cell development in the mouse embryo. Previously, vascular hematopoietic clusters were observed on histological sections using procedures that often disrupt tissue integrity or displace cells. Our whole-mount transparency method preserves embryo structure, allowing the relationship between hematopoietic clusters and the endothelial cell layer along the entire length of the vessel to be retained. Thus, statistical quantitative analysis and cartographic mapping of cell clusters can be reliably and directly performed on 3D images of whole embryos, instead of collating data from over 200 individual histological sections per embryo.
Cluster cartography and distribution in the aorta
Using the whole-mount procedure, we produced the first complete map and statistical quantitative analysis of vascular hematopoietic clusters during mouse midgestation. The quantity, size and anatomical distribution pattern of hematopoietic clusters within arteries was found to be generally preserved between embryos of the same developmental stage. Clusters appear at E9 and, in contrast to previous data, which did not have the advantage of the variety of cell surface markers employed in our current study (Garcia-Porrero et al., 1995), were found until E14. Cluster numbers and size peaked at E10.5, the time when HSC first begin to be produced, and the largest clusters were found in the UA.
Along the rostral to caudal length of the E10.5 aorta, cluster-rich areas were consistently found in the middle aorta subregion, around the junction with VA (Fig. 3 and Fig. S5 in the supplementary material). Within the UA, clusters were found concentrated along the curved area close/within the embryo body. The consistent quantity and general distribution of clusters along the rostral-caudal axis of the aorta, and length of the VA and UA suggests that cluster formation is a programmed event. It is possible that specific endothelial cells in the hematopoietic cluster-containing vessel subregions are intrinsically different from those endothelial cells in subregions devoid of clusters. Alternatively, or in addition, extrinsic signals to induce hematopoietic cluster formation are localized to subregions along the length of these vessels. Recently, it has been demonstrated that blood flow modulators regulate hematopoietic cluster formation in the AGM region (North et al., 2009). It has also been shown that adult repopulating HSCs localize to the middle section of the aorta around the junction with the VA (Mascarenhas et al., 2009). Thus, both vessel anatomy and extrinsic signals seem to play some role in the hematopoietic cluster formation and function.
The dorsal-ventral distribution of clusters in the aorta showed a majority of clusters (>60%) localized on the ventral wall. In agreement with a recent report, we observed clusters attached to the dorsal side of the aorta (Taoudi and Medvinsky, 2007). These dorsal clusters have not been described previously in other species, possibly owing to the difficulties in distinguishing attached hematopoietic clusters from circulating cells by tissue sectioning method. Interestingly, in the avian embryo it has been shown that ventral and dorsal endothelium of the aorta originates from different mesodermal cell populations (Pardanaud et al., 1996) and more recently that there is turnover and replacement of the endothelial cells lining the aorta (Pouget et al., 2006). Given that in the mouse aorta, HSCs are localized to the ventral side of aorta, whereas hematopoietic progenitors are found on both the ventral and dorsal sides (Taoudi and Medvinsky, 2007), it is interesting to speculate that intrinsically different mesodermal subpopulations contribute dorsally and ventrally. Insight into cell turnover and replacement around the mouse embryonic aorta is beginning to shed some light on this issue (Esner et al., 2006). Concerning extrinsic signals, gradients of growth factors are known to affect hematopoietic development in the chick embryo, with dorsal factors such as EGF suppressing hematopoiesis and ventral factors such as BMP enhancing hematopoiesis (Pardanaud and Dieterlen-Lievre, 1999). Although BMP4 is ventrally expressed in the AGM (Durand et al., 2007; Marshall et al., 2000) and enhances AGM HSC growth (Durand et al., 2007), it will be interesting to examine whether rostral-caudal gradients of BMP4 or other HSC enhancing growth factors [such as hedgehogs, IL3 (Peeters et al., 2009; Robin et al., 2006)] exist along the length of the aorta and UA.
Relationship of clusters to hematopoietic function
Hematopoietic clusters in the VA and UA and the aorta were found well before E10.5 (35 sp), the time of HSC emergence (Medvinsky and Dzierzak, 1996; Muller et al., 1994). Assessment of the functional capacity of the early E10 stage enriched cluster population revealed that most hematopoietic progenitors are within the c-Kit+CD31+SSEA1– cluster gate. However, as predicted, we did not detect HSC activity in the cluster fraction isolated from 31-34 sp embryos (Fig. 10). Despite the decreased number and size of clusters at E11.5 when compared with E10.5, HSCs were found exclusively within the c-Kit+CD31+SSEA1– fraction. Our whole embryo analysis revealed that 439±87 c-Kit+CD31+ cells are present as hematopoietic clusters attached to aortic endothelial cells at E11.5 (Fig. 3). HSC numbers have been estimated to be one per AGM at E11.5 (Kumaravelu et al., 2002) and thus, roughly 0.2% of c-Kit+CD31+SSEA1– cells would be HSCs. Other cells in the E11.5 clusters are expected to be hematopoietic progenitors, because, at E10, hematopoietic progenitors represent 19% of the c-Kit+CD31+SSEA1– sorted cell population. We also noticed that many single c-Kit+ cells were attached to aorta (84±21 cells) at E11.5. In this sense, small clusters or single c-Kit+ cells may be a possible candidate population for HSCs.
This raises the question `what is the relationship between early and late hematopoietic clusters'? One possibility is that early and late clusters are independent in formation and function, with HSC-including clusters generated only after E10.5. Another possibility is that putative pre-HSCs within the E10 hematopoietic clusters acquire stem cell character (mature) and become HSCs after E10.5. Recently, it has been shown that VE-cadherin+CD45+ cells isolated from E11.5 AGM region can acquire adult repopulating activity after 4 days in an AGM in vitro reaggregate culture (Taoudi et al., 2008). However, it remains to be seen whether hematopoietic cluster cells isolated from E10 embryos can acquire HSC activity after culture.
Hematopoietic cluster formation
Hematopoietic clusters are thought to arise from hemogenic endothelial cells. Several recent reports strongly support this notion (Chen et al., 2009; Eilken et al., 2009; Lancrin et al., 2009; Zovein et al., 2008) and our immunofluorescence data are consistent with these findings. In our analysis, Flk1 is expressed in endothelial cells and basal part of hematopoietic clusters, suggesting a lineage transition at the point where the cluster is in vascular contact. Moreover, a sequential distribution of endothelial cell and hematopoietic fractions is suggested in the c-Kit/CD31 FACS plot (Figs 6, 7). There is a mutually exclusive expression of Flk1 and CD45 on cluster cells, whereas CD34, endoglin and Tie2 (Tek – Mouse Genome Informatics) are expressed on endothelial cells and all the cells of the hematopoietic clusters (see Fig. S9 in the supplementary material). CD41 appears to mark cells in the transition from Flk1+ to CD45+. We also show that expression of other marker molecules within the c-Kit+CD31+SSEA1– gate can be predictive for localization and transitional status (endothelial to hematopoietic) of the cells within the clusters (Fig. 8). For example the monoclonal antibody against Mac-1, a marker on HSCs in AGM and fetal liver (Morrison et al., 1995; Sanchez et al., 1996), did not work in our immunohistostaining protocols, although it is routinely used for myeloid lineage detection in FACS analysis. In the c-Kit+CD31+SSEA1– fraction we observed a heterogeneous expression of Mac-1 (Itgam – Mouse Genome Informatics) that was similar to that of CD45 (not shown). Hence, we would expect Mac-1+ cells in the non-basal, outer parts of clusters.
Several mutant mouse hematopoietic models, including Runx1-deficient embryos, have been examined mainly by histological sectioning for aortic hematopoietic clusters (Ling et al., 2004; North et al., 1999; North et al., 2002). We have shown by 3D imaging the complete absence of hematopoietic clusters in Runx1–/– embryos and the absence of c-Kit–CD31+SSEA1– cells in FACS analysis (Fig. 7G,H). Hence, it is likely that in the process of hematopoietic cluster formation, Flk1+ endothelial cells start to express Runx1, which suppresses Flk1 expression (Hirai et al., 2005) and then leads to formation of CD45+ hematopoietic cells. As shown in this study, c-Kit expression clearly distinguishes hematopoietic clusters from endothelial cell layer (Fig. 1C,D). It will be interesting to examine how c-Kit promoter/enhancer is regulated during hematopoietic cluster formation. Additional detailed quantitative analysis of hematopoietic clusters in other signaling pathway/transcription factor mutant mice should provide insight into hierarchy and relationships between molecular regulators of hematopoietic development.
Finally, single-cell vital imaging studies performed on ES cells and early embryo cells, show blood generation from hemogenic endothelium (Eilken et al., 2009; Lancrin et al., 2009). Recent, vital imaging studies with zebrafish and midgestation mouse embryos, show the generation of hematopoietic cells from aortic endothelial cells (Bertrand et al., 2010; Boisset et al., 2010; Kissa and Herbomel, 2010). In the mouse embryo, an average of 1.7 Ly-6A GFP-positive hematopoietic cells emerge from the hemogenic endothelium. This is in contrast to the large numbers of c-Kit+ hematopoietic clusters we report here in transparent whole-mount midgestation embryos. One possible explanation for the disparate results is that the Ly6A-GFP transgene, which was used for live imaging study, may mark very few cluster cells or may only mark the HSCs being generated from the hemogenic endothelium (while c-Kit marks all hematopoietic cells). The other possibility is that the culture conditions used for the mouse live imaging study do not reflect the in vivo conditions in which the circulatory system is intact. Recent data support the notion that blood flow and biomechanical forces stimulate hematopoietic progenitor and stem cell generation from hemogenic endothelium (Adamo et al., 2009; North et al., 2009). Thus, in the absence of these physical forces, very few budding events occur. As yet, the unique combination of markers to discriminate HSCs from hematopoietic progenitors has not been identified. However, when identified, our quantitative approach in the whole embryo provides a new resource to facilitate mechanistic investigations on cluster formation in the embryo.
Supplementary Material
Acknowledgments
We thank all lab members and Dr Norio Suzuki for helpful discussions, Dr Motomi Osato for Runx1 knockout mice, Reinier van der Linden for expert cell sorting, Gert van Cappellen and Alex Nigg for confocal assistance, and Prof. Sjaak Philipsen and Dr Catherine Robin for critical comments on this manuscript. We also thank Prof. Nancy Speck for editing the methods. Studies were supported by Netherlands BSIK Tissue Engineering 03040 and BSIK Stem Cells in Development and Disease 03038, NIH R37 DK054077 and ESF EuroSTELLS 01-011. Deposited in PMC for release after 12 months.
Competing interests statement
The authors declare no competing financial interests.
Supplementary material
Supplementary material for this article is available at http://dev.biologists.org/lookup/suppl/doi:10.1242/dev.051094/-/DC1
References
- Adamo L., Naveiras O., Wenzel P. L., McKinney-Freeman S., Mack P. J., Gracia-Sancho J., Suchy-Dicey A., Yoshimoto M., Lensch M. W., Yoder M. C., et al. (2009). Biomechanical forces promote embryonic haematopoiesis. Nature 459, 1131-1135 [DOI] [PMC free article] [PubMed] [Google Scholar]
- Bertrand J. Y., Chi N. C., Santoso B., Teng S., Stainier D. Y., Traver D. (2010). Haematopoietic stem cells derive directly from aortic endothelium during development. Nature 464, 108-111 [DOI] [PMC free article] [PubMed] [Google Scholar]
- Boisset J. C., van Cappellen W., Andrieu-Soler C., Galjart N., Dzierzak E., Robin C. (2010). In vivo imaging of haematopoietic cells emerging from the mouse aortic endothelium. Nature 464, 116-120 [DOI] [PubMed] [Google Scholar]
- Cai Z., de Bruijn M., Ma X., Dortland B., Luteijn T., Downing R. J., Dzierzak E. (2000). Haploinsufficiency of AML1 affects the temporal and spatial generation of hematopoietic stem cells in the mouse embryo. Immunity 13, 423-431 [DOI] [PubMed] [Google Scholar]
- Chen M. J., Yokomizo T., Zeigler B. M., Dzierzak E., Speck N. A. (2009). Runx1 is required for the endothelial to haematopoietic cell transition but not thereafter. Nature 457, 887-891 [DOI] [PMC free article] [PubMed] [Google Scholar]
- Cumano A., Dieterlen-Lievre F., Godin I. (1996). Lymphoid potential, probed before circulation in mouse, is restricted to caudal intraembryonic splanchnopleura. Cell 86, 907-916 [DOI] [PubMed] [Google Scholar]
- Davis C. A. (1993). Whole-mount immunohistochemistry. Methods Enzymol. 225, 502-516 [DOI] [PubMed] [Google Scholar]
- de Bruijn M. F., Speck N. A., Peeters M. C., Dzierzak E. (2000). Definitive hematopoietic stem cells first develop within the major arterial regions of the mouse embryo. EMBO J. 19, 2465-2474 [DOI] [PMC free article] [PubMed] [Google Scholar]
- de Bruijn M. F., Ma X., Robin C., Ottersbach K., Sanchez M. J., Dzierzak E. (2002). Hematopoietic stem cells localize to the endothelial cell layer in the midgestation mouse aorta. Immunity 16, 673-683 [DOI] [PubMed] [Google Scholar]
- Durand C., Robin C., Bollerot K., Baron M. H., Ottersbach K., Dzierzak E. (2007). Embryonic stromal clones reveal developmental regulators of definitive hematopoietic stem cells. Proc. Natl. Acad. Sci. USA 104, 20838-20843 [DOI] [PMC free article] [PubMed] [Google Scholar]
- Dzierzak E., Speck N. A. (2008). Of lineage and legacy: the development of mammalian hematopoietic stem cells. Nat. Immunol. 9, 129-136 [DOI] [PMC free article] [PubMed] [Google Scholar]
- Eilken H. M., Nishikawa S., Schroeder T. (2009). Continuous single-cell imaging of blood generation from haemogenic endothelium. Nature 457, 896-900 [DOI] [PubMed] [Google Scholar]
- Esner M., Meilhac S. M., Relaix F., Nicolas J. F., Cossu G., Buckingham M. E. (2006). Smooth muscle of the dorsal aorta shares a common clonal origin with skeletal muscle of the myotome. Development 133, 737-749 [DOI] [PubMed] [Google Scholar]
- Ferkowicz M. J., Starr M., Xie X., Li W., Johnson S. A., Shelley W. C., Morrison P. R., Yoder M. C. (2003). CD41 expression defines the onset of primitive and definitive hematopoiesis in the murine embryo. Development 130, 4393-4403 [DOI] [PubMed] [Google Scholar]
- Fraser S. T., Ogawa M., Yu R. T., Nishikawa S., Yoder M. C., Nishikawa S. (2002). Definitive hematopoietic commitment within the embryonic vascular endothelial-cadherin(+) population. Exp. Hematol. 30, 1070-1078 [DOI] [PubMed] [Google Scholar]
- Garcia-Porrero J. A., Godin I. E., Dieterlen-Lievre F. (1995). Potential intraembryonic hemogenic sites at pre-liver stages in the mouse. Anat. Embryol. (Berl.) 192, 425-435 [DOI] [PubMed] [Google Scholar]
- Garcia-Porrero J. A., Manaia A., Jimeno J., Lasky L. L., Dieterlen-Lievre F., Godin I. E. (1998). Antigenic profiles of endothelial and hemopoietic lineages in murine intraembryonic hemogenic sites. Dev. Comp. Immunol. 22, 303-319 [DOI] [PubMed] [Google Scholar]
- Hirai H., Samokhvalov I. M., Fujimoto T., Nishikawa S., Imanishi J., Nishikawa S. (2005). Involvement of Runx1 in the down-regulation of fetal liver kinase-1 expression during transition of endothelial cells to hematopoietic cells. Blood 106, 1948-1955 [DOI] [PubMed] [Google Scholar]
- Jaffredo T., Gautier R., Eichmann A., Dieterlen-Lievre F. (1998). Intraaortic hemopoietic cells are derived from endothelial cells during ontogeny. Development 125, 4575-4583 [DOI] [PubMed] [Google Scholar]
- Jaffredo T., Nottingham W., Liddiard K., Bollerot K., Pouget C., de Bruijn M. (2005). From hemangioblast to hematopoietic stem cell: an endothelial connection? Exp. Hematol. 33, 1029-1040 [DOI] [PubMed] [Google Scholar]
- Kissa K., Herbomel P. (2010). Blood stem cells emerge from aortic endothelium by a novel type of cell transition. Nature 464, 112-115 [DOI] [PubMed] [Google Scholar]
- Kumaravelu P., Hook L., Morrison A. M., Ure J., Zhao S., Zuyev S., Ansell J., Medvinsky A. (2002). Quantitative developmental anatomy of definitive haematopoietic stem cells/long-term repopulating units (HSC/RUs): role of the aorta-gonad-mesonephros (AGM) region and the yolk sac in colonisation of the mouse embryonic liver. Development 129, 4891-4899 [DOI] [PubMed] [Google Scholar]
- Lancrin C., Sroczynska P., Stephenson C., Allen T., Kouskoff V., Lacaud G. (2009). The haemangioblast generates haematopoietic cells through a haemogenic endothelium stage. Nature 457, 892-895 [DOI] [PMC free article] [PubMed] [Google Scholar]
- Ling K. W., Ottersbach K., van Hamburg J. P., Oziemlak A., Tsai F. Y., Orkin S. H., Ploemacher R., Hendriks R. W., Dzierzak E. (2004). GATA-2 plays two functionally distinct roles during the ontogeny of hematopoietic stem cells. J. Exp. Med. 200, 871-882 [DOI] [PMC free article] [PubMed] [Google Scholar]
- Lux C. T., Yoshimoto M., McGrath K., Conway S. J., Palis J., Yoder M. C. (2008). All primitive and definitive hematopoietic progenitor cells emerging before E10 in the mouse embryo are products of the yolk sac. Blood 111, 3435-3438 [DOI] [PMC free article] [PubMed] [Google Scholar]
- Marshall C. J., Thrasher A. J. (2001). The embryonic origins of human haematopoiesis. Br. J. Haematology 112, 838-850 [DOI] [PubMed] [Google Scholar]
- Marshall C. J., Kinnon C., Thrasher A. J. (2000). Polarized expression of bone morphogenetic protein-4 in the human aorta-gonad-mesonephros region. Blood 96, 1591-1593 [PubMed] [Google Scholar]
- Mascarenhas M. I., Parker A., Dzierzak E., Ottersbach K. (2009). Identification of novel regulators of hematopoietic stem cell development through refinement of stem cell localization and expression profiling. Blood 114, 4645-4653 [DOI] [PMC free article] [PubMed] [Google Scholar]
- Matsubara A., Iwama A., Yamazaki S., Furuta C., Hirasawa R., Morita Y., Osawa M., Motohashi T., Eto K., Ema H., et al. (2005). Endomucin, a CD34-like sialomucin, marks hematopoietic stem cells throughout development. J. Exp. Med. 202, 1483-1492 [DOI] [PMC free article] [PubMed] [Google Scholar]
- Medvinsky A., Dzierzak E. (1996). Definitive hematopoiesis is autonomously initiated by the AGM region. Cell 86, 897-906 [DOI] [PubMed] [Google Scholar]
- Mikkola H. K., Fujiwara Y., Schlaeger T. M., Traver D., Orkin S. H. (2003). Expression of CD41 marks the initiation of definitive hematopoiesis in the mouse embryo. Blood 101, 508-516 [DOI] [PubMed] [Google Scholar]
- Morrison S. J., Hemmati H. D., Wandycz A. M., Weissman I. L. (1995). The purification and characterization of fetal liver hematopoietic stem cells. Proc. Natl. Acad. Sci. USA 92, 10302-10306 [DOI] [PMC free article] [PubMed] [Google Scholar]
- Muller A. M., Medvinsky A., Strouboulis J., Grosveld F., Dzierzak E. (1994). Development of hematopoietic stem cell activity in the mouse embryo. Immunity 1, 291-301 [DOI] [PubMed] [Google Scholar]
- Nishikawa S., Nishikawa S., Kawamoto H., Yoshida H., Kizumoto M., Kataoka H., Katsura Y. (1998). In vitro generation of lymphohematopoietic cells from endothelial cells purified from murine embryos. Immunity 8, 761-769 [DOI] [PubMed] [Google Scholar]
- North T., Gu T. L., Stacy T., Wang Q., Howard L., Binder M., Marin-Padilla M., Speck N. A. (1999). Cbfa2 is required for the formation of intra-aortic hematopoietic clusters. Development 126, 2563-2575 [DOI] [PubMed] [Google Scholar]
- North T. E., de Bruijn M. F., Stacy T., Talebian L., Lind E., Robin C., Binder M., Dzierzak E., Speck N. A. (2002). Runx1 expression marks long-term repopulating hematopoietic stem cells in the midgestation mouse embryo. Immunity 16, 661-672 [DOI] [PubMed] [Google Scholar]
- North T. E., Goessling W., Peeters M., Li P., Ceol C., Lord A. M., Weber G. J., Harris J., Cutting C. C., Huang P., et al. (2009). Hematopoietic stem cell development is dependent on blood flow. Cell 137, 736-748 [DOI] [PMC free article] [PubMed] [Google Scholar]
- Okuda T., van Deursen J., Hiebert S. W., Grosveld G., Downing J. R. (1996). AML1, the target of multiple chromosomal translocations in human leukemia, is essential for normal fetal liver hematopoiesis. Cell 84, 321-330 [DOI] [PubMed] [Google Scholar]
- Palis J., Robertson S., Kennedy M., Wall C., Keller G. (1999). Development of erythroid and myeloid progenitors in the yolk sac and embryo proper of the mouse. Development 126, 5073-5084 [DOI] [PubMed] [Google Scholar]
- Pardanaud L., Dieterlen-Lievre F. (1999). Manipulation of the angiopoietic/hemangiopoietic commitment in the avian embryo. Development 126, 617-627 [DOI] [PubMed] [Google Scholar]
- Pardanaud L., Luton D., Prigent M., Bourcheix L. M., Catala M., Dieterlen-Lievre F. (1996). Two distinct endothelial lineages in ontogeny, one of them related to hemopoiesis. Development 122, 1363-1371 [DOI] [PubMed] [Google Scholar]
- Peeters M., Ottersbach K., Bollerot K., Orelio C., de Bruijn M., Wijgerde M., Dzierzak E. (2009). Ventral embryonic tissues and Hedgehog proteins induce early AGM hematopoietic stem cell development. Development 136, 2613-2621 [DOI] [PMC free article] [PubMed] [Google Scholar]
- Pouget C., Gautier R., Teillet M. A., Jaffredo T. (2006). Somite-derived cells replace ventral aortic hemangioblasts and provide aortic smooth muscle cells of the trunk. Development 133, 1013-1022 [DOI] [PubMed] [Google Scholar]
- Robin C., Ottersbach K., Durand C., Peeters M., Vanes L., Tybulewicz V., Dzierzak E. (2006). An unexpected role for IL-3 in the embryonic development of hematopoietic stem cells. Dev. Cell 11, 171-180 [DOI] [PubMed] [Google Scholar]
- Sanchez M. J., Holmes A., Miles C., Dzierzak E. (1996). Characterization of the first definitive hematopoietic stem cells in the AGM and liver of the mouse embryo. Immunity 5, 513-525 [DOI] [PubMed] [Google Scholar]
- Takakura N., Yoshida H., Ogura Y., Kataoka H., Nishikawa S., Nishikawa S. (1997). PDGFR alpha expression during mouse embryogenesis: immunolocalization analyzed by whole-mount immunohistostaining using the monoclonal anti-mouse PDGFR alpha antibody APA5. J. Histochem. Cytochem. 45, 883-893 [DOI] [PubMed] [Google Scholar]
- Taoudi S., Medvinsky A. (2007). Functional identification of the hematopoietic stem cell niche in the ventral domain of the embryonic dorsal aorta. Proc. Natl. Acad. Sci. USA 104, 9399-9403 [DOI] [PMC free article] [PubMed] [Google Scholar]
- Taoudi S., Gonneau C., Moore K., Sheridan J. M., Blackburn C. C., Taylor E., Medvinsky A. (2008). Extensive hematopoietic stem cell generation in the AGM region via maturation of VE-cadherin+CD45+ pre-definitive HSCs. Cell Stem Cell 3, 99-108 [DOI] [PubMed] [Google Scholar]
- Tavian M., Coulombel L., Luton D., Clemente H. S., Dieterlen-Lievre F., Peault B. (1996). Aorta-associated CD34+ hematopoietic cells in the early human embryo. Blood 87, 67-72 [PubMed] [Google Scholar]
- Wang Q., Stacy T., Binder M., Marin-Padilla M., Sharpe A. H., Speck N. A. (1996). Disruption of the Cbfa2 gene causes necrosis and hemorrhaging in the central nervous system and blocks definitive hematopoiesis. Proc. Natl. Acad. Sci. USA 93, 3444-3449 [DOI] [PMC free article] [PubMed] [Google Scholar]
- Yokomizo T., Ogawa M., Osato M., Kanno T., Yoshida H., Fujimoto T., Fraser S., Nishikawa S., Okada H., Satake M., et al. (2001). Requirement of Runx1/AML1/PEBP2alphaB for the generation of haematopoietic cells from endothelial cells. Genes Cells 6, 13-23 [DOI] [PubMed] [Google Scholar]
- Yoshimoto M., Porayette P., Yoder M. C. (2008). Overcoming obstacles in the search for the site of hematopoietic stem cell emergence. Cell Stem Cell 3, 583-586 [DOI] [PMC free article] [PubMed] [Google Scholar]
- Zovein A. C., Hofmann J. J., Lynch M., French W. J., Turlo K. A., Yang Y., Becker M. S., Zanetta L., Dejana E., Gasson J. C., et al. (2008). Fate tracing reveals the endothelial origin of hematopoietic stem cells. Cell Stem Cell 3, 625-636 [DOI] [PMC free article] [PubMed] [Google Scholar]
Associated Data
This section collects any data citations, data availability statements, or supplementary materials included in this article.