Abstract
Passenger leukocytes have been demonstrated to play significant roles in initiating and also regulating immune reactions after organ transplantation. Reliable techniques to detect donor leukocytes in recipients after organ transplantation are essential to analyze the role, function, and behavior of these leukocytes. In this report we describe a simple, reliable method to detect donor cells with low frequencies using peripheral blood samples. Detection of small numbers of major histocompatibility complex (MHC) mismatched cells was first studied using four-color flow cytometry in artificially created cell mixtures. By selecting the CD45+ population and simultaneous staining with several leukocyte lineage markers (CD3, CD4, CD8, CD56, and CD19), MHC-mismatched leukocytes were consistently detected in cell suspensions prepared from directly stained whole blood samples with a threshold sensitivity as low as 0.1%–0.2%. When the fresh peripheral blood mononuclear cells were separated by conventional Ficoll gradient purification, similar, but slightly lower levels of donor cells were detected. Blood samples obtained 1–5 months after liver, kidney, and intestine transplants revealed that the kind of organ allograft influenced levels and lineage pattern of the circulating donor cells. This procedure provided a simple and reliable method in determining early chimerism in transplant recipients. However, the detection of MHC-mismatched leukocytes of all lineages was much lower when frozen peripheral blood mononuclear cells were used.
Keywords: flow cytometry, whole blood, chimerism, solid organ transplantation
INTRODUCTION
Passenger leukocytes in solid organ allografts have been conventionally considered to be the main initiators of immune reactions leading to allograft rejection [1, 2]. However, the persistence of small numbers of donor leukocytes in the recipient for decades after transplantation implies the possible function of these cells as active modulators for graft acceptance [3, 4]. The persistence of mobile donor alloantigens, with sustained immune reactions between donor and recipient leukocytes, and consequent mutual immunologic regulation, are considered to be the principal factors for allograft acceptance [5, 6].
The analysis of the role, function, and behavior of donor leukocytes after transplantation requires sensitive techniques to distinguish donor and recipient phenotype cells. The detection of small numbers of donor cells long after transplantation has only recently become possible. Currently, donor cells are analyzed by polymerase chain reaction (PCR), immunohistochemistry, in-situ hybridization, and flow cytometry by targeting disparities at the human leukocyte antigen (HLA) loci or sex-determining region Y [4, 7–9]. Some of these techniques are either laborious or require particular tissue samples, thereby precluding their widespread use. Flow cytometric analysis is technically simple and the procedure can be completed in a short time. Although this method has been known to have limitations in detecting low frequency events, it could provide valuable information on surface or intracellular expression of various molecules on donor cells. Therefore, it was our goal to establish a standardized flow cytometric technique that can provide reliable results of donor leukocytes after organ transplantation in a timely manner.
In this report we describe a four-color flow cytometry method to detect levels and lineages of major histocompatibility complex (MHC) mismatched (donor) cells using variable types of samples, including whole blood, and fresh and frozen peripheral blood mononuclear cells (PBMC) from normal volunteers, artificial mixtures, and samples from organ transplant recipients. The method is quick and reliable, with a detection limit of 0.1%–0.2% when used in combination with lineage-specific antibodies.
MATERIALS AND METHODS
Blood Collection and Processing
Heparinized whole blood (WB) was obtained from healthy volunteers and transplant recipients in accordance with the guidelines of the Institutional Review Board at the University of Pittsburgh. Three types of blood samples were used in this study: WB, freshly isolated PBMC, and cryopreserved PBMC. PBMC were obtained by Ficoll-Hypaque (Amersham Pharmacia Biotech, Piscataway, NJ, USA) standard density gradient centrifugation method [10]. Aliquots of PBMC were cryopreserved in freezing medium containing 10% DMSO and 30% FCS in RPMI 1640 (Life Technologies, Grand Island, NY, USA), in liquid nitrogen, and thawed rapidly for assay in a 37 °C water bath.
HLA Typing
HLA typing was performed at the Tissue Typing Laboratory (Clinical Immunopathology, Central Laboratory Services, Inc., University of Pittsburgh Medical Center, Pittsburgh, PA, USA) using genomic DNA extracted from PBMC isolated from all patients in the study.
Artificial Mixtures
Whole blood or isolated PBMC from healthy volunteers were mixed in vitro to generate the artificial samples containing known levels of HLA-mismatched and sex-mismatched cells (5%, 1%, 0.3%, and 0.1%). Aliquots of PBMC mixtures were cryopreserved and used in parallel with WB mixtures or fresh PBMC mixtures for comparison analysis.
Antibodies and Reagents
The panel of FITC-conjugated monoclonal antibodies (mAb) specific for HLA-A or -B loci were either purchased from One Lambda, Inc. (Canoga Park, CA, USA) or prepared from hybridomas (ATCC, Manassas, VA, USA) and FITC-conjugated at the University of Pittsburgh Cancer Institute Hybridoma Facility, directed by Dr. Albert Deleo. Other lineage-specific mAbs included CD3-PE, CD4-PE, CD56-PE, CD19-PC5, CD8-PC5, and CD45-ECD (Beckman Coulter Co., Miami, FL, USA, and Becton-Dickinson, San Jose, CA, USA). Fluorochrome-conjugated isotype-matched non-specific mAbs were used as negative controls for each assay.
Flow Cytometric Analysis
Whole blood (100, µl) was incubated with relevant mAbs or isotype controls for 20 minutes in dark at 4 °C, and then mixed vigorously with FACS lysing solution (Becton Dickinson) for 10 minutes at room temperature for erythrolysis and fixation. Cells were washed twice and fixed in 1% paraformaldehyde in PBS. Alternatively, freshly isolated or frozen PBMC (1 × 10⁵ cells) were preincubated with 10% goat serum for 20 minutes for the blocking of nonspecific binding, washed three times, and incubated for 20 minutes in dark at 4 °C with relevant mAbs or isotype controls, followed by washing and fixation. A typical four-color flow cytometry analysis was performed with mAb combinations of CD45-ECD, anti-HLA-FITC, and two leukocyte lineage markers conjugated with PE and PE-Cy5. Data acquisition and analysis was performed on a Coulter EPICS XL flow cytometer (Beckman Coulter Co.) mounted with four photomultiplier tubes and a single argon laser. In a conventionally selected lymphocyte cluster, using side-scatter (SS) versus forward-scatter (FS) cytograms, 50,000 CD45+ events were collected per sample and analyzed with EXPO32 software (Applied Cytometry System, Sheffield, United Kingdom). Daily calibration of the instrument was performed using flow check fluorospheres (Beckman Coulter Co.). Fluorescent compensation was performed using a normal control and staining with each fluorochrome separately. Compensation values were set to eliminate spectral overlap.
Cytospin and Fluorescent In Situ Hybridization for XY
Aliquots of 1 × 10⁵ cells from WB or PBMC were cytospun for 5 minutes at 500 rpm using a centrifuge (Thermo Shandon, Pittsburgh, PA, USA). The slides were air dried and fixed in 95% ethanol for 10 minutes. FISH analysis was carried out using directly labeled probes for X (red) and Y (green) chromosome alfa-satellite regions, according to the manufacturer’s recommended protocol (Vysis Inc., Doweners Grove, IL, USA). The slides were counterstained with DAPI (125 mg/ml) and analyzed under florescent microscope. At least 300 hybridized nuclei with two signals (XX or XY) were examined on each slide.
PCR Analysis
DNA isolated from peripheral blood samples was amplified using probes directed against HLA-DR or Y chromosome and resolved by electrophoresis on agarose gels. PCR products were analyzed with Southern Blotting by hybridizing the membrane with specific radiolabeled probes and exposing to the film. The technique detects one donor cell within 10,000 recipient cells.
RESULTS
MAb Selection and Titration
A panel of seven mAbs, specific for HLA-A and -B loci, were examined in this study (Table 1). Using these mAbs, it was theoretically possible to analyze donor phenotype leukocytes in > 70% of organ transplant recipients in this center [11]. Each mAb was initially tested for its specificity in WB and PBMC samples obtained from normal volunteers of known HLA haplotypes using at least four different mAb dilutions. The working concentration was determined as the highest dilution of the mAb that gave the strongest binding signal in positive HLA-matched patients, and minimal or no background binding to the samples that did not express particular HLA of interest.
TABLE 1.
Monoclonal antibodies used in the study
| Specificity | Isotype | Dilution | Supplier |
|---|---|---|---|
| A2/28 | mouse IgG2a | 1:300 | One Lambda, Inc. |
| A3 | mouse IgG2a | 1:20* | ATCC (HB122)/UPCI Hybridoma Facility |
| A9 | mouse IgG2b | 1:20 | One Lambda, Inc. |
| B7 | mouse IgG1 | 1:30* | ATCC (HB56)/UPCI Hybridoma Facility |
| B8 | mouse IgG2b | 1:20 | One Lambda Inc. |
| B12 | mouse IgG2b | 1:20 | One Lambda Inc. |
| B27 | mouse IgG1 | 1:20 | One Lambda Inc. |
Based on the mAb concentrations of 1 mg/ml.
For the two mAbs purified and FITC-conjugated at the UPMC hybridoma facility (anti-A3 and anti-B7), three fluorochrome-to-protein ratios (1:10, 1:20, and 1:40) were initially tested to select the product with the highest staining intensity (data not shown). Once the appropriate fluorochrome-mAb ratio was determined, large quantities of mAb were prepared. Titration binding studies were repeated for each new batch of mAbs. Most of mAbs were proven to have satisfactory binding specificity and were used for further analyses.
Comparison of Chimerism in Artificial Mixtures, WB, Fresh PBMC, or Frozen PBMC
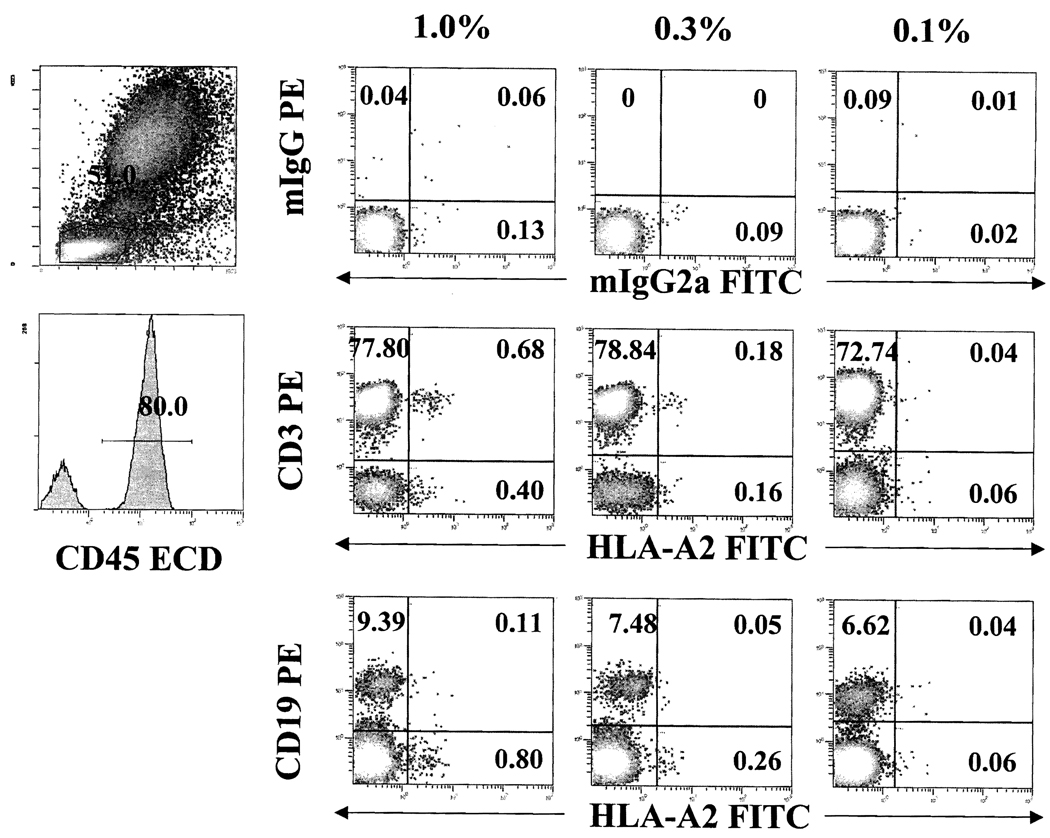
To examine the limitation of flow cytometry in detecting small numbers of HLA-mismatched leukocytes in blood samples, artificial mixtures were created in WB samples and analyzed with four-color flow cytometry (Figure 1). When the mixture contained 1% or 0.3% of HLA-mismatched cells, they were, as expected, easily identified. In 0.1% artificial mixture, mismatched cells could not be accurately distinguished from the nonspecific binding with isotype controls, suggesting that the threshold sensitivity of the assay using WB resides around 0.1%–0.2%. Using multicolor analysis with lineage markers, existence of CD3+ (CD4+ and CD8+) or CD19+ HLA-mismatched cells appeared to be particularly helpful to distinguish positive events from nonspecific binding.
FIGURE 1.
Detection of major histocompatibility complex (MHC) mismatched cells in different artificial mixtures. Whole blood from normal volunteers who were mismatched at human leukocyte antigen A (HLA-A) were mixed to generate 1%, 0.3%, and 0.1% artificial mixtures. Level and lineage specificity of MHC-mismatched (HLA-A2) cells were analyzed on gated CD45 (ECD) positive cells with monoclonal antibodies for HLA-A2 (FITC), together with CD3 (PE) and CD19 (PE).
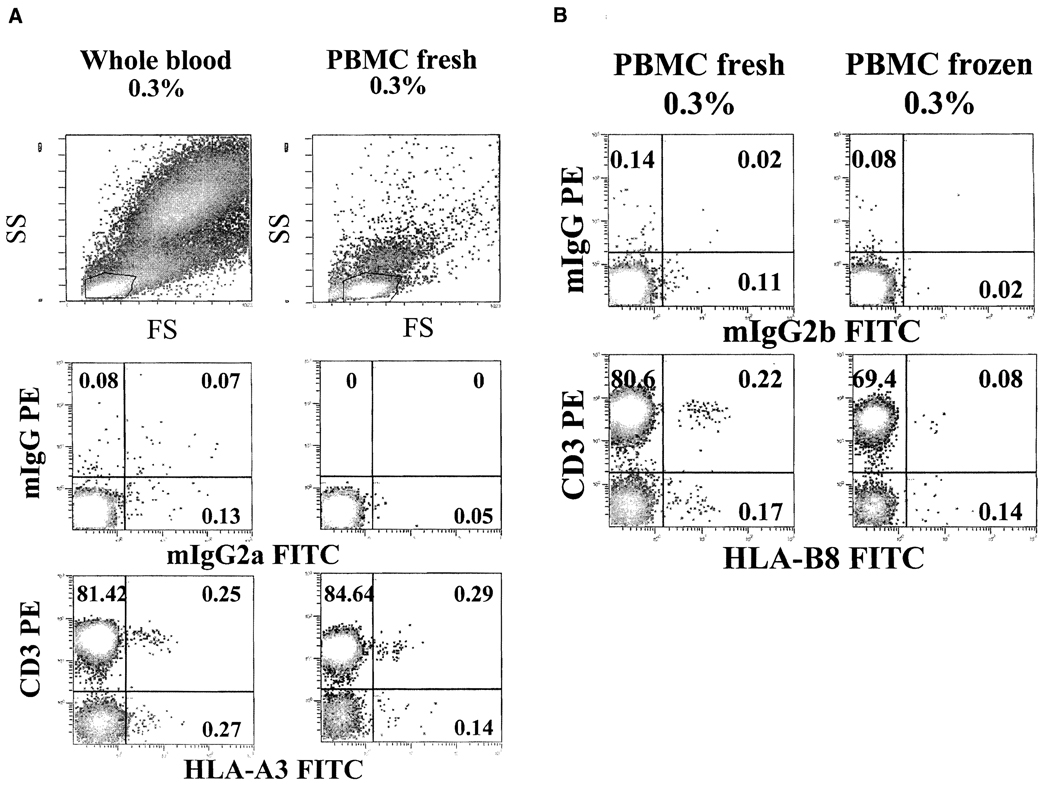
We next examined whether levels of chimerism and detection threshold in WB samples could be altered in PBMC during isolation and freezing procedures. An artificial mixture (0.3%) was created in WB, and PBMC were isolated. Portions of PBMC were cryopreserved and later thawed for analysis and displayed as dot plot with SS versus FS. The cytograms with WB and PBMC samples were different. WB samples contained all three main clusters of lymphocytes, monocytes, and polymorphonuclear granulocytes. As expected, isolated PBMC were mainly lymphocytes and monocytes without granulocyte clusters (Figure 2A). To examine whether HLA-mismatched (donor) cells could be lost during PBMC isolation procedure, mismatched cells (0.3%) in original WB samples were backgated for their location in SS vs. FS dot plots. HLA-mismatched cells were found in all three cell clusters in WB samples, with different distributions (40%–50% in lymphocytes, 20%–40% in monocytes, and 10% in granulocytes). However, when cells in the lymphocyte cluster were analyzed, WB and PBMC samples exhibited similar levels of mismatched cells, suggesting that there was little, if any, loss of lymphocytes during Ficoll-Hypaque isolation process, although the majority of granulocytes were eliminated. In contrast, when frozen PBMC were thawed and analyzed with a comparison to fresh PBMC, the percentage of HLA-mismatched cells was reduced compared with the original artificial mixture of 0.3% (Figure 2B). These results indicate that significant numbers (i.e., half) of HLA-mismatched cells may be lost during freeze/thaw processes.
FIGURE 2.
Comparison of blood sample types. Artificial mixture (0.3%) prepared in whole blood (WB) was further processed to obtain fresh peripheral blood mononuclear cells (PBMC) and frozen PBMC. Different types of samples were stained as described in methods section. (A) Levels of human leukocyte antigen (HLA) mismatched (HLA-A3) cells are reliably detected in WB and fresh PBMC. (B) Frozen PBMC demonstrate significantly decreased percentages of HLA-mismatched cells (HLA-B8), compared with fresh PBMC. Results are of one representative experiment out of three performed.
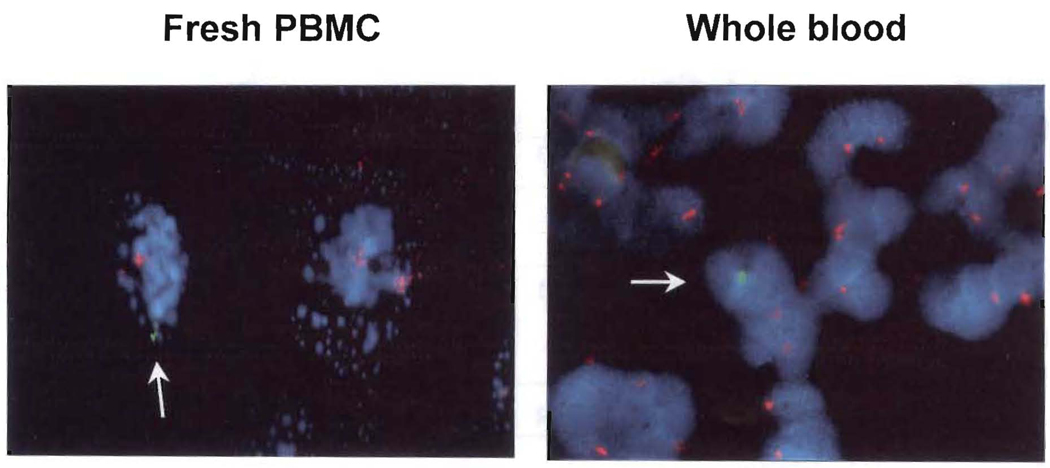
In parallel to flow cytometry, cytospin slides were created from the same artificial mixture samples (0.3%) of WB and fresh PBMC for XY FISH. Figure 3 illustrates the presence of one male donor cell among many female recipient cells with a ratio of 1:300, confirming the result of flow cytometry. Importantly, Ficoll-Hypaque isolated PBMC in the cytospin preparation revealed cell fragmentation and enhanced adherence, making cell visualization difficult. In contrast, cytospin slides prepared from WB samples demonstrated intact cell morphology.
FIGURE 3.
XY fluorescent in situ hybridization (FISH). Cytospin slides were created from artificial mixtures (male 0.3% and female 99.7%) of whole blood and fresh peripheral blood mononuclear cells (PBMC) samples used in Figure 1 and 2A, and analyzed with XY FISH. Arrow indicates male cell with Y hybridization signal (green) among female cells of two X (red) hybridization signals. This is one representative experiment our of several performed.
Studies of Organ Recipients
A total of 69 consented recipients of kidney (n = 44), liver (n = 15), and intestine/multivisceral (n = 10) grafts transplanted between July 2001 and November 2001 were prospectively analyzed for chimerism using peripheral blood samples obtained during 1–5 months post-transplantion. Patients were conditioned with pretransplant thymoglobulin (5 mg/kg) and treated postoperatively with minimal tacrolimus-based immunosuppression [12]. Donor splenocytes and pretransplant recipient blood samples were used as positive and negative controls, respectively. Four-color flow cytometry in WB samples was performed in 48 of 69 recipients. PCR was also performed in 47 of 69 patients to detect low-level chimerism. Thirty-eight patients were tested with flow cytometry and PCR in parallel (i.e., same samples). Nine kidney recipients were not analyzed with either method due to zero HLA antigen mismatches (n = 5) or lack of available anti-HLA mAbs or probes.
Characteristics of Peripheral Blood Chimerism
Frequency and level
The kind of allograft was a prime determinant of the frequency and level of early chimerism [4, 13, 14]. Between 30 and 60 days macrochimerism was detected by flow cytometry in 62% and 80% of liver and intestine recipients, respectively. In contrast, only 13% of kidney recipients had macrochimerism (Table 2). The percentages of donor cells ranged from 0.2%–4.0% in this early period.
TABLE 2.
Frequency of chimerism in organ transplant recipients using four-color flow cytometry
| Number | 30–60 Days | 60–150 Days | |
|---|---|---|---|
| Kidney | 44 | 13% (3/23) | 0% (0/14) |
| Liver | 15 | 62% (5/8) | 33% (4/12) |
| Intestine | 10 | 80% (4/5) | 66% (4/6) |
| Total | 69 | 33% (12/36) | 25% (8/32) |
Between 60 and 150 days both the incidence and level of macrochimerism waned, particularly in the kidney recipients who had an incidence of zero. In contrast, :33% of liver and 66% of intestine recipients remained macrochimeric with levels of 0.2%–0.8% (Table 2). The results were consistent with previous observations in rats [15] and in humans [16] that early chimerism diminishes with time and becomes undetectable by six months in most organ recipients.
In early and late samples that were analyzed with flow cytometry as well as PCR, chimerism was detected by both methods in 45% and 50% of liver and intestine recipients, respectively, whereas chimerism in kidney recipients could be detected mainly by PCR (Table 3).
TABLE 3.
Blood samples analyzed for chimerism with both flow cytometry and PCR
| Number | Flow+ PCR+ | Flow− PCR+ | Flow− PCR− | |
|---|---|---|---|---|
| Kidney | 44 | 9% (2/23) | 17% (4/23) | 74% (17/23) |
| Liver | 14 | 45% (5/11) | 9% (1/11) | 45% (5/11) |
| Intestine | 10 | 50% (2/4) | 25% (1/4) | 25% (1/4) |
| Total | 69 | 24% (9/38) | 16% (6/38) | 60% (23/38) |
PCR = polymerase chain reaction.
Lineages
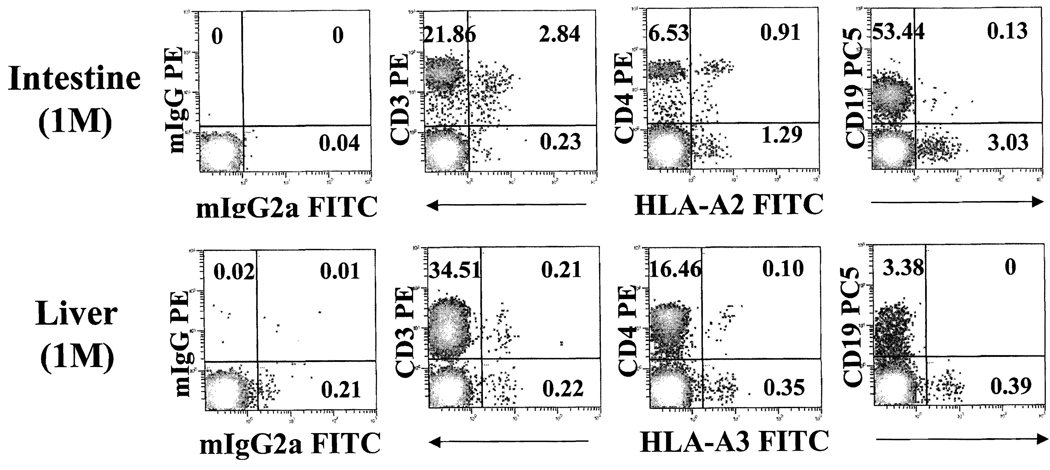
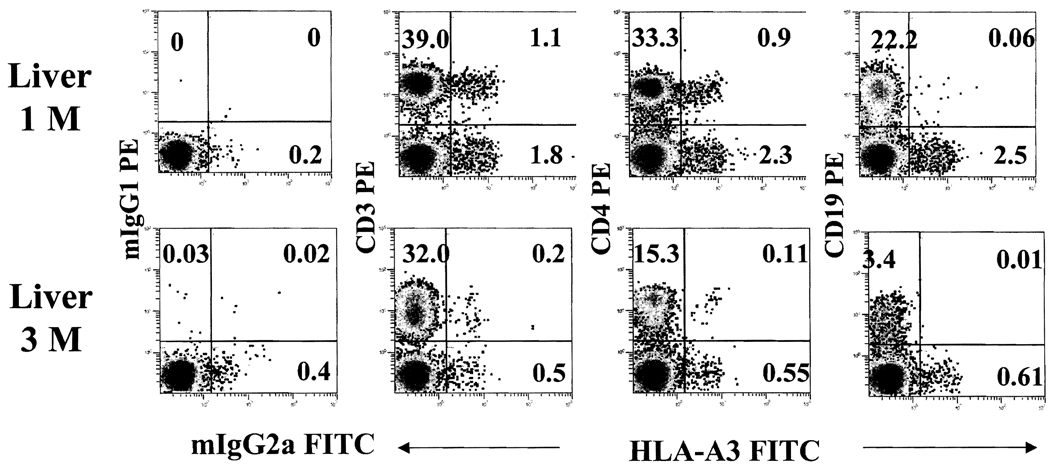
The majority (> 90%) of donor cells in intestine recipients were CD3+, with a distribution in both CD4+ and CD8+ populations (Figure 4). Donor B cells (CD19+) or natural killer (NK) cells (CD56+) were also detected, but at a much lower frequency, In contrast, the CD3+ and CD3− cells of donor phenotypes in liver recipients were nearly equal (Figures 4 and 5). The CD3− cells included small numbers of donor Band NK cells and a large fraction that was not stained with any lineage marker, suggesting the presence of immature or undifferentiated cells. Although levels of chimerism declined with time, the lineage profile of donor cells in general was not significantly different (Figure 5).
FIGURE 4.
Donor cells in liver and intestine transplant patients early after transplantation. Whole blood obtained at 1-month after intestine and liver transplantation were stained with monoclonal antibodies for CD45 (ECD), HLA-A2 or -A3 (FITC) and CD3 (PE), CD4 (PE) and CD19 (PC5).
FIGURE 5.
Donor cells decrease with time after transplantation. Four-color flow cytometric analyses of a liver patient at 1- and 3-months after transplantation demonstrate the dynamics of donor cells with time. Anti-HLA-A3 (FITC) together with anti-CD3 (PE), -CD4 (PE), and -CD19 (PE) monoclonal antibodies were used to detect donor cells and their lineage specificity.
DISCUSSION
With our use of four-color flow cytometry, HLA-mismatched donor cells in the peripheral blood samples of organ recipients can be reliably detected at frequencies as low as 0.1%–0.2%. The assay incorporates several ways of improving its dependability and quality: 1) the rigorous selection of mAbs that have high specificity for the particular HLA and low nonspecificity; (2) discriminating selection of CD45+ leukocytes for analysis; and (3) simultaneous staining with leukocyte lineage specific mAbs that delineate subpopulations while differentiating nonspecific background staining from genuinely positive staining.
Below some levels of HLA-mismatched cells, methods other than flow cytometry must be used for the detection of microchimerism (e.g., PCR or in-situ hybridization). One of the goals of our study was to define the cutoff point above which results of flow cytometry were reliable. In addition, to be useful, it was important for the method to be rapid, simple, and applicable for the study of large numbers of recipient blood samples. We limited our patient studies to the early period after transplantation, in part because of the availability of patient samples during this interval. In addition, immune events soon after transplantation have been reported to have the most significant impact on long-term graft outcome [5].
Previous studies during this early post-transplant period have been with a cocktail of mAbs of different HLA specificities (donor and recipient specificities) that were reported to detect levels of HLA-mismatched cells as low as a frequency of 1 per 10,000 [17]. The foregoing method may be applicable, however, only for the study of a few selected reports with particular HLA mismatches. Other flow cytometry studies have not been this sensitive [18–20].
It was clear from the experiment demonstrating a significant decrease of donor cells in frozen compared with fresh PBMC samples that the study of frozen PBMC is not an ideal way to determine the presence or extent of donor leukocyte chimerism. Because freeze/thaw procedures routinely result in the loss of certain numbers of cells, it is reasonable to assume that a small population of donor cells could be brought below the detection threshold by the freezing procedure. In another comparison, donor cells were more frequently detected in blood samples from liver and intestine recipients than from the blood of kidney recipients [4, 7, 14]. As high as 3%–4% of CD45+ circulating leukocytes were donor-phenotype 30-days after intestinal and liver transplantation. In intestinal recipients, > 95% of donor cells were CD3+ (CD4 and CD8) T cells, whereas the CD3+ cells in liver recipients made up only 50% of the donor cells. The remaining CD3− fraction contained a significant number of cells that were not stained with lineage-specific mAbs for CD3, CD19, or CD56. Several experimental studies have reported that the liver contains heterogenous leukocyte subsets: immature dendritic cells [21, 22], immature B cells [23], and NK T cells [24]. Although some authors have attributed tolerogenic properties to these cells, further studies will be needed to determine if such “lineage negative” have a special role in tolerance induction.
With the flow cytometry technology, the majority of chimeric cells were found early after transplantation within the lymphocyte cluster (60%–70%), with few donor cells in the monocyte or granulocyte gates (10%–20%). This could suggest either that organ-based leukocytes do not contain a large number of granulocytes, or that granulocytes have a short survival time. However, the most likely explanation for the dominant presence of donor lymphocytes in blood is their rapid proliferation, that is, in a graft-versus-host reaction [3, 5, 6] which occurs in SCID mouse recipients of human PBMC infusion [25].
In summary, the study describes the simple and reliable four-color flow cytometry method to detect HLA-mismatched donor cells with a threshold sensitivity of 0.1%–0.2%. The method may be useful in monitoring the donor cells during the critical early post-transplant period and studying their impact on long-term graft outcome.
ACKNOWLEDGMENTS
We wish to thank Kathy Cieply, Adam Czaikowski, Jason Mihalcin, Angie Farren, and Pam McGregor for their excellent technical support; and Carla Forsythe for preparation and organization of manuscript.
This study was supported by NJH and National Institutes of Health Grant R01#AI038899.
ABBREVIATIONS
- mAb
monoclonal antibody
- PBMC
peripheral blood mononuclear cells
- WB
whole blood
- FISH
fluorescent in situ hybridization
- SS
side scatter
- FS
forward scatter
REFERENCES
- 1.Lechler RI, Batchelor JR. Restoration of immunogenicity to passenger cell-depleted kidney allografts by the addition of donor strain dendritic cells. J Exp Med. 1982;155:31. doi: 10.1084/jem.155.1.31. [DOI] [PMC free article] [PubMed] [Google Scholar]
- 2.Larsen CP, Morris PJ, Austyn JM. Migration of dendritic leukocytes from cardiac allografts into host spleens. A novel pathway for initiation of rejection. J Exp Med. 1990;171:307. doi: 10.1084/jem.171.1.307. [DOI] [PMC free article] [PubMed] [Google Scholar]
- 3.Starzl TE, Demetris AJ, Murase N, Ildstad S, Ricordi C, Trucco M. Cell migration, chimerism, and graft acceptance. Lancet. 1992;339:1579. doi: 10.1016/0140-6736(92)91840-5. [DOI] [PMC free article] [PubMed] [Google Scholar]
- 4.Starzl TE, Demetris AJ, Trucco M, Murase N, Ricordi C, Ildstad S, Ramos H, Todo S, Tzakis A, Fung JJ, et al. Cell migration and chimerism after whole-organ transplantation: the basis of graft acceptance. Hepatology. 1993;17:1127. [PMC free article] [PubMed] [Google Scholar]
- 5.Starzl TE, Zinkernagel RM. Antigen localization and migration in immunity and tolerance. N Engl J Med. 1998;339:1905. doi: 10.1056/NEJM199812243392607. [DOI] [PMC free article] [PubMed] [Google Scholar]
- 6.Starzl TE, Zinkernagel RM. Transplantation tolerance from a historical perspective. Nat Rev Immunol. 2001;1:233. doi: 10.1038/35105088. [DOI] [PMC free article] [PubMed] [Google Scholar]
- 7.Fontes P, Rao AS, Demetris AJ, Zeevi A, Trucco M, Carroll P, Rybka W, Rudert WA, Ricordi C, Dodson F, et al. Bone marrow augmentation of donor-cell chimerism in kidney, liver, heart, and pancreas islet transplantation. Lancet. 1994;344:151. doi: 10.1016/s0140-6736(94)92756-1. [DOI] [PMC free article] [PubMed] [Google Scholar]
- 8.Garcia-Morales R, Esquenazi V, Zucker K, Gomez CI, Fuller L, Carreno M, Cirocco R, Alamo A, Karatzas T, Burke GW, 3rd, Ciancio G, Temple D, Fernandez H, Ricordi C, Tzakis A, Miller J. An assessment of the effects of cadaver donor bone marrow on kidney allograft recipient blood cell chimerism by a novel technique combining PCR and flow cytometry. Transplantation. 1996;62:1149. doi: 10.1097/00007890-199610270-00021. [DOI] [PubMed] [Google Scholar]
- 9.Garcia-Morales R, Carreno M, Mathew J, Zucker K, Cirocco R, Ciancio G, Burke G, Roth D, Temple D, Rosen A, Fuller L, Esquenazi V, Karatzas T, Ricordi C, Tzakis A, Miller J. The effects of chimeric cells following donor bone marrow infusions as detected by PCR-flow assays in kidney transplant recipients. J Clin Invest. 1997;99:1118. doi: 10.1172/JCI119240. [DOI] [PMC free article] [PubMed] [Google Scholar]
- 10.Boyum A. Separation of leukocytes from blood and bone marrow. Introduction. Scand J Clin Lab Invest Suppl. 1968;97:7. [PubMed] [Google Scholar]
- 11.Gjertson D, Geer L, Lee S, Tsai E, Locke A, Lei C, Yeh C. Population studies. In: Gjertson D, Terasaki P, editors. HLA 1998. Lenexa, Kansas: American Society for Histocompatibility and Immunogenetics; 1998. [Google Scholar]
- 12.Starzl TE, Murase N, Abu-Elmagd K, Gray EA, Shapiro R, Eghtesad B, Corry RJ, Jordan ML, Fontes P, Gayowski T, Bond G, Scantlebury VP, Potdar S, Randhawa P, Wu T, Zeevi A, Nalesnik MA, Woodward J, Marcos A, Trucco M, Demetris AJ, Fung JJ. Tolerogenic immunosuppression for organ transplantation. Lancet. 2003;361:1502. doi: 10.1016/s0140-6736(03)13175-3. [DOI] [PMC free article] [PubMed] [Google Scholar]
- 13.Murase N, Starzl TE, Tanabe M, Fujisaki S, Miyazawa H, Ye Q, Delaney C, Fung JJ, Demetris AJ. Variable chimerism, graft versus host disease, and tolerance after different kinds of cell and whole organ transplantation from Lewis to brown Norway rats. Transplantation. 1995;60:158. doi: 10.1097/00007890-199507000-00009. [DOI] [PMC free article] [PubMed] [Google Scholar]
- 14.Reinsmoen NL, Jackson A, McSherry C, Ninova D, Wiesner RH, Kondo M, Krom RA, Hertz MI, Bolman RM, 3rd, Matas AJ. Organ-specific patterns of donor antigen-specific hyporeactivity and peripheral blood allogeneic microchimerism in lung, kidney, and liver transplant recipients. Transplantation. 1995;60:1546. doi: 10.1097/00007890-199560120-00029. [DOI] [PubMed] [Google Scholar]
- 15.Murase N, Demetris AJ, Woo J, Tanabe M, Furuya T, Todo S, Starzl TE. Graft-versus-host disease after brown Norway-to-Lewis and Lewis-to-Brown Norway rat intestinal transplantation under FK506. Transplantation. 1993;55:1. doi: 10.1097/00007890-199301000-00001. [DOI] [PMC free article] [PubMed] [Google Scholar]
- 16.Schlitt HJ, Hundrieser J, Hisanaga M, Uthoff K, Karck M, Wahlers T, Wonigeit K, Pichlmayr R. Patterns of donor-type microchimerism after heart transplantation. Lancet. 1994;343:1469. doi: 10.1016/s0140-6736(94)92584-4. [DOI] [PubMed] [Google Scholar]
- 17.Pei R, Chen T, Orpilla J, Lee JH. A simultaneous negative and positive selection method that can detect chimerism at a frequency of 1 per 10,000 by flow cytometry. Tissue Antigens. 1997;50:197. doi: 10.1111/j.1399-0039.1997.tb02859.x. [DOI] [PubMed] [Google Scholar]
- 18.Schlitt HJ, Kanehiro H, Raddatz G, Steinhoff G, Richter N, Nashan B, Ringe B, Wonigeit K, Pichlmayr R. Persistence of donor lymphocytes in liver allograft recipients. Transplantation. 1993;56:1001. doi: 10.1097/00007890-199310000-00042. [DOI] [PubMed] [Google Scholar]
- 19.Dahmen UM, Boettcher M, Krawczyk M, Broelsch CE. Flow cytometric “rare event analysis:” a standardized approach to the analysis of donor cell chimerism. J Immunol Methods. 2002;262:53. doi: 10.1016/s0022-1759(02)00017-0. [DOI] [PubMed] [Google Scholar]
- 20.Rao AS, Fontes P, Zeevi A, Trucco M, Dodson FS, Rybka WB, Shapiro R, Jordan M, Pham SM, Rilo HL, et al. Augmentation of chimerism in whole organ recipients by simultaneous infusion of donor bone marrow cells. Transplant Proc. 1995;27:210. [PMC free article] [PubMed] [Google Scholar]
- 21.Lu L, Bonham CA, Liang X, Chen Z, Li W, Wang L, Watkins SC, Nalesnik MA, Schlissel MS, Demestris AJ, Fung JJ, Qian S. Liver-derived DEC205 + 8220 +CD19-dendritic cells regulate T cell responses. J Immunol. 2001;166:7042. doi: 10.4049/jimmunol.166.12.7042. [DOI] [PubMed] [Google Scholar]
- 22.Lau AH, Thomson AW. Dendritic cells and immune regulation in the liver. Gut. 2003;52:307. doi: 10.1136/gut.52.2.307. [DOI] [PMC free article] [PubMed] [Google Scholar]
- 23.Yokoi Y, Noorchashm H, Rostami SY, Barker CF, Naji A. Origin, kinetics, and function of chimeric B lymphocytes in liver allografts. Transplantation. 1999;68:118. doi: 10.1097/00007890-199907150-00022. [DOI] [PubMed] [Google Scholar]
- 24.Kawamura H, Kameyama H, Kosaka T, Kuwahara O, Bannai M, Kawamura T, Watanabe H, Abo T. Association of CD8+ natural killer T cells in the liver with neonatal tolerance phenomenon. Transplantation. 2002;73:978. doi: 10.1097/00007890-200203270-00027. [DOI] [PubMed] [Google Scholar]
- 25.Gysemans C, Waer M, Laureys J, Depovere J, Pipeleers D, Bouillon R, Mathieu C. Islet xenograft destruction in the hu-PBL-severe combined immunodeficient (SCID) mouse necessitates anti-CD3 preactivation of human immune cells. Clin Exp Immunol. 2000;121:557. doi: 10.1046/j.1365-2249.2000.01300.x. [DOI] [PMC free article] [PubMed] [Google Scholar]


