

Abstract
Nature frequently utilizes opposing factors to create a stable activator gradient to robustly control pattern formation. This study employs a biomimicry approach, by delivery of both angiogenic and antiangiogenic factors from spatially restricted zones of a synthetic polymer to achieve temporally stable and spatially restricted angiogenic zones in vivo. The simultaneous release of the two spatially separated agents leads to a spatially sharp angiogenic region that is sustained over 3 wk. Further, the contradictory action of the two agents leads to a stable level of proangiogenic stimulation in this region, in spite of significant variations in the individual release rates over time. The resulting spatially restrictive and temporally sustained profiles of active signaling allow the creation of a spatially heterogeneous and functional vasculature.
Keywords: controlled drug delivery, peripheral ischemia, VEGF antibody, diffusion reaction, Turing pattern
Strategies leading to the creation of organized and functional networks of blood vessels are likely to have significant utility in the treatment of ischemic diseases and the engineering of high-dimensional tissues (1, 2). Numerous molecular players are involved in different mechanisms of vascular growth (3, 4), and VEGF, in particular, plays a prominent role in activating endothelial cells to form new vessels (5). To date, much of the effort in therapeutic angiogenesis has been focused on the delivery of VEGF to restore blood perfusion (6, 7). However, formation of truly functional vasculature will likely require control over the location and magnitude of the angiogenic region. Undirected vessel growth can result in pathological effects (8), and improperly organized vascular networks resulting from this overstimulation can reduce perfusion (9, 10). This may be particularly problematic with angiogenic delivery approaches currently utilized, as systemic delivery leads to supraphysiologic concentrations, and even polymeric sustained delivery systems frequently demonstrate an early burst release that leads to oversaturated local VEGF concentration in situ (11). Importantly, although clearly documented with VEGF delivery, this issue permeates all current approaches to locally manipulate regenerative processes via exogenous factor delivery.
During developmental processes, tight spatial regulation often results from the combined action of stimulatory and inhibitory factors (12, 13). Diffusion/reaction of stimulatory factors alone results in formation of shallow gradients that make cellular discrimination of spatial cues difficult; in contrast, it has long been appreciated that sharp cutoffs can result from Turing’s reaction-diffusion mechanism, where an inhibitor and activator act together to form distinct patterns (14, 15). In such reaction schemes, the reactions of morphogens and their diffusion through a tissue are adequate in describing morphogenesis and creating sharp boundaries in patterns. This concept has been exploited previously in vitro to control differentiation of PC12 cells (16). Aside from that work, the focus to date on delivery of stimulatory factors alone to promote regeneration has largely ignored this fundamental principle of developmental biology.
This study was based on the hypothesis that clear demarcation of stimulatory zones for regeneration can be achieved via appropriate codelivery of stimulatory and inhibitory factors. This hypothesis was examined in the context of VEGF-driven angiogenesis, using delivery of both recombinant human VEGF and an angiogenic inhibitor, anti-VEGF antibody (anti-VEGF) (17), and utilizing a biodegradable polymer scaffold system to allow local and sustained release of the two factors. The ability of this approach to spatially regulate angiogenesis was examined in a model of hind-limb ischemia (18), due to its relevance to clinical situations requiring revascularization interventions.
Materials and Methods
Cell Culture and in Vitro Sprouting Assay.
Dermal human vascular endothelial cells were seeded onto microcarrier beads and subsequently embedded in fibrin gels. Detailed protocols are included in SI Text. Gels were incubated at 37 °C for 30 min, and media of experimental conditions were placed on top of the gel. Experimental media were prepared by adding appropriate concentrations of VEGF and anti-VEGF to EGM-2MV without the growth factor supplements, but with the addition of 10 ng/mL hepatocyte growth factor for all conditions. After 4 d, the gels were fixed with 4% paraformaldehyde. Subsequent to fixing, samples were stained with DAPI and visualized at 10× objective magnification with an Olympus IX2 microscope. Sprouts were identified as continuous multicellular structures extended from the microcarrier beads with a minimum of two cells in the structure.
Scaffold Fabrication.
An 85∶15, 120-kD copolymer of D,L-lactide and glycolide (PLG) (Alkermes) was used in a gas-foaming process to form macroporous PLG matrix scaffolds (19). All scaffolds were cylinders 4.2 mm in diameter and 3 mm in thickness. Detailed protocol for constructing scaffolds is included in SI Text. Four types of scaffolds were fabricated: (i) blank scaffolds without protein incorporation (B), (ii) scaffolds with 4 μg of VEGF (V), (iii) 3-layered scaffolds with a 1-mm central layer containing 4 μg of VEGF and two surrounding 1-mm layers without protein incorporation (BVB for Blank-VEGF-Blank), and (iv) three-layered scaffolds with a 1-mm central layer containing 4 μg of VEGF and two surrounding 1-mm layers each incorporating 20 μg of anti-VEGF (R&D Systems AB-293-NA) (AVA for anti-VEGF-VEGF-anti-VEGF).
Quantification of Protein Release Kinetics.
The release kinetics of anti-VEGF and VEGF from each layer of the scaffold were determined using 0.11 μCi 125I-labeled anti-mouse IgG (PerkinElmer) and 0.11 μCi 125I-labeled human VEGF (PerkinElmer), respectively, as tracers. The tracers were entrapped in scaffolds using an identical process with the remaining bulk quantities consisting of unlabeled anti-VEGF and unlabeled VEGF, respectively. The total radioactivity of each scaffold layer (n = 5) was measured with a WIZARD Automatic Gamma Counter (PerkinElmer) prior to incubation at 37 °C in 2 mL of PBS. At specific measurement time points, release solutions were measured using the Gamma counter and the scaffolds were placed in fresh release solutions. The cumulative protein release from the scaffolds at each time point was normalized as a percentage of total protein incorporated.
Mathematical Model.
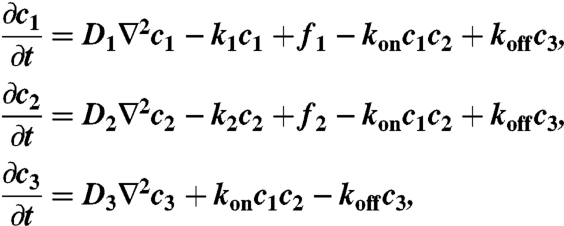
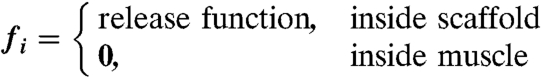
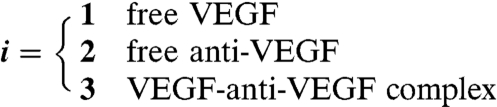
A computational model was generated to depict the concentration profiles of free VEGF, anti-VEGF, and VEGF complexed with anti-VEGF. This model accounted for diffusion, release from scaffolds, binding kinetics, and protein degradation. The governing equations of the VEGF and anti-VEGF concentrations inside the scaffold and underlying muscle were
 |
where
 |
 |
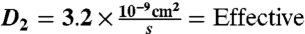
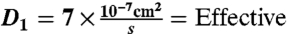 interstitial diffusion coefficient of VEGF165 (20–22).
 interstitial diffusion coefficient of IgG Ab (23, 24).
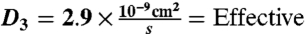 interstitial diffusion coefficient of complex (25).
k1 = 2.31 × 10⁻⁴ s-1 = Degradation rate of VEGF (20).
k2 = k3 = 1.34 × 10⁻⁶ s-1 = Degradation rate of free anti-VEGF and VEGF-anti-VEGF complex (26, 27).
kon = 5.5 × 10⁴ M-1 s-1 = VEGF-anti-VEGF complex formation rate (28).
koff = 11 × 10-4 s-1 = VEGF-anti-VEGF complex dissociation rate (28).
The constants were obtained from experimental measurements in other published studies, as referenced beside each constant. In the model, the VEGF-anti-VEGF-body complex was assumed to have no degradation. VEGF and anti-VEGF were modeled to only degrade when not bound together. This should have a negligent impact on the overall dynamics of the system due to the small magnitude of degradation rates compared to koff. The release function inside each layer of the scaffolds was determined by the initially incorporated amount of protein multiplied by the instantaneous release curve. Effective diffusion coefficients and degradation rates were assumed to be time-invariant and spatially uniform. Because the effective diffusion coefficients were experimentally measured, they were assumed to incorporate binding kinetics to the ECM proteins as well as uptake by cells. The system geometry, equation system, and initial conditions were constructed in COMSOL Multiphysics using the 3D coefficient form partial differentiation equation model. The time-dependent system was solved, and the output was exported and analyzed in Matlab.
Mouse Model of Hind-Limb Ischemia and Scaffold Implantation.
Scaffolds were implanted in 6-wk-old SCID mice (Taconic) that had undergone unilateral ligation of hind-limb blood vessels to create a severe model of hind-limb ischemia (18). The SCID model was chosen because it offered a stable loss of perfusion over weeks and the angiogenic effects from inflammation were reduced. Briefly, animals were anesthetized by i.p. injection of a 7∶1 mixture of ketamine and xylazine. Ligation sites were made on the external iliac artery and vein, and on the femoral artery and vein using 5–0 Ethilon (Ethicon). The vessels were severed between the ligation sites. A scaffold was implanted such that its rotational axis was perpendicular to the direction of the severed vessels, with the round edge sitting on top of the muscle. This orientation effectively made each layer parallel to the original femoral artery and vein.
Analysis of Vascularization.
Scaffolds and the surrounding muscles from the ischemic hind limbs were retrieved after 1, 2, and 4 wk. Samples were embedded in paraffin and sectioned onto slides, as illustrated in Fig. S1. Detailed protocols are included in SI Text. Muscle and scaffold sections were stained for CD31. Blood vessel densities, marked by CD31, were manually determined in the entire scaffold and underlying muscle tissues as previously described (1, 18). Measurements of the blood perfusion in the ischemic and normal limb of the anesthetized animals (n = 5) were performed using laser Doppler perfusion imaging (LDPI; Perimed). To minimize variability due to ambient light, temperature, and individual heart rate, perfusion in the ischemic hind limb was normalized by the perfusion in the normal hind limb of the same animal.
Results
System Development.
The relation between VEGF and anti-VEGF concentrations on angiogenesis was first evaluated using a common in vitro sprouting assay, in order to quantitatively determine the appropriate doses of the two factors for subsequent in vivo studies. VEGF induced angiogenic sprouting, an analog to the initial stage of angiogenesis, whereas anti-VEGF reduced the angiogenic effects of VEGF (Fig. S2), as expected. The dose-dependent effects of anti-VEGF at a constant VEGF of 50 ng/mL were analyzed, and an anti-VEGF concentration 50-fold greater than that of VEGF effectively eliminated the angiogenic effects of VEGF (Fig. S2b).
To allow local and sustained delivery of VEGF and anti-VEGF, the proteins were incorporated into poly(lactide-co-glycolide) scaffolds that have been commonly utilized in the past for delivery of single stimulatory factors (18). However, in this situation, three-layer PLG scaffolds were fabricated, and the different proteins were localized into the distinct layers. Protein that was incorporated into each layer of the scaffold remained confined to that layer, as demonstrated previously (20). Radiolabeled tracers were used to model the release of the two proteins from the scaffolds, and there was a sustained release of the proteins over several weeks (Fig. 1). Approximately 60% and 75%, respectively, of VEGF and anti-VEGF were released in the first 3 d. Notice that the initial burst release for anti-VEGF was greater than that of VEGF. Over the next 11 d, the release rates varied between 0.5% to 3% per day, and from day 14 to 31, only 1–2% of the proteins were released.
Fig. 1.

In vitro cumulative release kinetics of anti-VEGF antibody and VEGF from scaffolds. Initial mass of proteins incorporated were 4 μg of VEGF and 20 μg of anti-VEGF. Values represent mean, and error bars represent standard deviations (n = 5).
Computational Model of Protein Distribution.
In order to design appropriate encapsulated doses of VEGF and anti-VEGF to create spatially defined angiogenic regions, mass transport PDEs of the proteins in the scaffolds and the underlying tissues were simulated. Parameters for the models were obtained from empirical release kinetics and diffusion and degradation coefficients from literature. To validate the model, predictions of the model were compared to experimentally determined VEGF concentration profiles in vivo that were published previously (11). Predicted concentrations were comparable to the experimental results (see Fig. S3).
In the layered AVA scaffolds in this study, an initial amount of 4 μg VEGF was encapsulated in the central layer of the scaffold, and 20 μg anti-VEGF was encapsulated in each of the surrounding layers (Fig. 2A). For these scaffolds, the concentration profiles of total VEGF, free VEGF (not bound to anti-VEGF), and free anti-VEGF over time at a tissue cross-section 0.5 mm into the underlying muscle were simulated (Fig. 2 B–D). These simulations showed a sharp peak for the total VEGF concentration (free VEGF + VEGF bound to antibody) centered at the central layer and two anti-VEGF peaks on the two sides. However, the diffusion of anti-VEGF into the central layer caused most of the total VEGF to become bound to antibody in the central layer, creating significantly reduced peaks of free VEGF compared to total VEGF (Fig. 2E). Strikingly, the binding of free VEGF by antibody had a dramatic smoothing effect on the concentration of free VEGF as a function of time. In contrast, the total VEGF concentration started extremely high and then rapidly dropped, due to the changing release rate over time and its simultaneous degradation. These effects were largely dose-independent (Figs. S4 and S5), although the absolute value of the quasi-steady-state free-VEGF concentration was strongly influenced by the VEGF and anti-VEGF doses. From previous in vitro VEGF dosage studies of endothelial sprouting (29) and in vivo measurement of tissue VEGF concentrations (11), the minimum effective VEGF concentration in vivo to induce angiogenesis is ∼5 ng/mL. As shown by the computational model, utilization of the 4-μg doses led to free-VEGF concentrations that were still above this threshold for a 3-wk time frame. In addition, as a comparison of the profile stability, the standard deviations of the daily peak for total VEGF and free VEGF over 28 d were computed: 558 ng/mL for total VEGF and 132 ng/mL for free VEGF. Most of the fluctuations came from the spike in concentrations on day 2 (Fig. 2G). The concentration peak of active VEGF on day 2 was reduced by 72% by the binding activity of anti-VEGF.
Fig. 2.

Results from computational simulation of an AVA implanted scaffold. (A) Orientation of implanted scaffold in a mouse that underwent ischemic hind-limb surgery. The orientation of the scaffold was chosen to create an angiogenic zone directly over the section of the femoral artery that was ligated—with a goal of creating new blood vessels that would bypass the ligated vessel. The spatially restricted APR was designed to limit angiogenesis in other limb regions that presumably would not provide perfusion recovery function. The axes definitions are such that x is perpendicular to the severed femoral artery and vein, y is parallel to the femoral artery and vein, and positive z points away from the underlying muscle. Note that the x-y plane lies tangential to the interface between the scaffold and the underlying muscle, and that the coordinate (0,0,2.1 mm) is located at the center of the scaffold. Simulation results of the concentration profiles of (B) total VEGF, (C) free VEGF, and (D) free anti-VEGF over time at y = 0 and z = -0.5 mm. (E) Cross-sectional plots of concentration profiles of total anti-VEGF (blue solid) and free anti-VEGF (green dashed) at 3, 7, 14, and 21 d. (F) Cross-sectional plots of concentration profiles of total VEGF (blue solid) and free VEGF (green dashed) at 3, 7, 14, and 21 d. (G) The maximum concentrations of total VEGF and free VEGF over time. (H) APR at 1, 7, and 14 d for AVA (Left) and BVB (Right). The angiogenic promotion signal is defined as 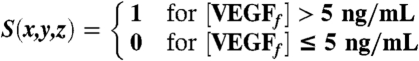 .
.
To determine the spatial control over angiogenesis with this approach, the level of angiogenic promotion was expressed as a binary event, defined as angiogenic promotion signal (S),
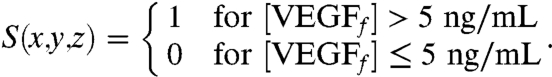 |
S(x,y,z) = 1 indicated that angiogenesis was promoted at said coordinate and local S = 0 indicated that angiogenesis was inhibited. Plots of S vs. x (Fig. 2H) demonstrated that angiogenic promotion was restricted with this system in the approximate 1-mm central region, which was defined as the angiogenic-promoting region (APR). This spatial restriction was maintained for 3 wk, demonstrating a highly stable environment, although the APR first broadened then contracted slowly. In the first 19 d, the APR width expanded gradually from 0.84 mm to 1.2 mm, although there is a brief drop to 0.48 mm on day 4. From day 20 to day 28, the APR contracted from 1.2 mm to 0.72 mm. Compared to the sole delivery of VEGF, the codelivery of VEGF and anti-VEGF showed improved ability to constrict the width of APR (Fig. 2H). In this computational model, 5 ng/mL was chosen as the minimum threshold for angiogenic promotion, consistent with other groups (30, 31). The choice of this parameter did not affect the temporal stability of the free-VEGF concentration profiles, though the width of the APR deviated by ± 25% with the minimum threshold ranging from 2 ng/mL to 10 ng/mL (Fig. S6). Thus, both temporal stability and spatial restriction of active VEGF were robust to the minimum biologically active threshold. The results of this modeling suggest that highly stable, in terms of both time and space, regions of proangiogenic activity could be readily created by appropriate dosing of VEGF and anti-VEGF. The maintenance of the APR is also robust against changes in the amount of anti-VEGF and VEGF encapsulated initially. When the initial encapsulated mass of anti-VEGF was varied from 80% to 110% of the base level, the width of the APR deviates for less than 25% (Fig. S4). Similarly, the width of the APR deviated for less than 25% when the degradation rate of anti-VEGF was varied from 80% to 130% (Fig. S5).
Spatially Regulated Angiogenesis in Vivo.
To test the ability of this system to provide spatial control over angiogenesis, scaffolds were subsequently implanted into the ischemic hind limbs of SCID mice. Both the vasculature that formed within the infiltrated scaffold and the vasculature in the muscle underneath the scaffold were analyzed. To this end, four types of scaffolds were examined: (i) B, (ii) V, (iii) AVA, and (iv) BVB. The aforementioned computational model suggested that implanted AVA scaffolds would result in a distinct region that promoted angiogenesis and that this region would be maintained in the first two weeks. This spatially restricted signal was expected to lead to spatially heterogeneous blood vessel densities. At the experimental end point (4 wk), mice were sacrificed and blood vessel densities of the cell-infiltrated scaffolds and underlying muscles were quantified. Delivery of VEGF in all scaffold types (V, BVB, and AVA) resulted in an approximate twofold increase in blood vessel density in the scaffolds (Fig. 3 A and B). Furthermore, layers “B” in BVB showed a similar level of increase (Fig. 3B), indicating that the region of angiogenesis promotion was not restricted to the central layer. In contrast, layers “A” in the AVA scaffolds showed a reduction of blood vessel density, to a similar value as the blank condition (Fig. 3B). Similarly, analysis of the underlying muscle showed that increased blood vessel densities were generated in the muscles underneath a polymer initially encapsulated VEGF, and AVA scaffolds effectively restricted this increase to the muscle directly underneath the central layer (Fig. 4). Histologic analysis demonstrated no other detectable differences in the surrounding muscular tissues exposed to anti-VEGF antibody, as compared to the blank control conditions (Fig. S7). Additional analysis (Fig. S8) also demonstrated the development of the spatially restricted angiogenic zone at week 1 and week 2 for both the implanted scaffold and the underlying muscle.
Fig. 3.

Blood vessel densities within layered scaffolds 4-wk postimplantation (n = 5). Representative images (A) of CD31 stained sections of various types of scaffolds implanted in ischemic hind limbs. B only, blank scaffolds; V only, scaffolds delivering only VEGF; BVB, trilayered scaffolds with a VEGF-containing layer sandwiched by two blank layers; AVA, trilayered scaffolds with a VEGF-containing layer sandwiched by two anti-VEGF-containing layers. Scale bar represents 200 μm. Quantification of vessel densities (B) within each layer of implanted scaffolds (*p ≤ 0.05, **p ≤ 0.01, ***p ≤ 0.001). Values represent mean, and error bars represent standard deviations (n = 5).
Fig. 4.

Blood vessel densities within muscle tissue sections (n = 5) directly underneath the corresponding scaffold layer. Representative images (A) of CD31 stained muscle sections directly underneath the layers of various types of implanted scaffolds. Scale bar represents 200 μm. Quantification of vessel densities (B) within the underlying muscles (*p ≤ 0.05, **p ≤ 0.01, ***p ≤ 0.001). Values represent mean and error bars represent standard deviations (n = 5).
Finally, LDPI was performed in order to assess the effects on functional perfusion by local restriction of angiogenesis (Fig. 5). In all groups, perfusion decreased immediately subsequent to induction of ischemia. However, implantation of all three types of scaffolds containing VEGF led to significant recovery of perfusion, well above the control (no VEGF delivery), and spatially restricting angiogenesis did not compromise the ability of VEGF delivery to improve regional perfusion. Necrosis in the limbs was also analyzed (Fig. S9); the AVA scaffold was demonstrated to lead to moderate prevention of necrosis as compared to the control BVB scaffolds.
Fig. 5.

Quantitative analyses of hind-limb perfusion using LDPI in mice (n = 5). Blood flow was expressed as ischemic limb/untreated limb perfusion in mice. B, blank scaffolds; V, scaffolds delivering only VEGF; BVB, trilayered scaffolds with a VEGF-containing layer sandwiched by two blank layers; AVA, trilayered scaffolds. Implantations of scaffolds containing VEGF (V, AVA, BVB) all resulted in enhanced perfusion in the ischemic limb compared to the implantation of blank scaffolds (B).
Discussion
The results from these studies demonstrated that one can spatially control regenerative processes by simultaneously delivering spatially segregated promoting and inhibitory agents with polymeric scaffolds. More specifically, the simultaneous, but spatially distinct, delivery of anti-VEGF and VEGF reduced the initial burst concentration of active VEGF and maintained the temporal stability of the active VEGF concentration profile. Furthermore, the spatial separation of the encapsulated pro- and antiangiogenic agents resulted in a spatially sharp and restricted angiogenic region, leading to a heterogeneous distribution of vessels in the scaffolds and in underlying muscles.
The in vitro sprouting assay from this study confirmed that the anti-VEGF was functional and inhibited angiogenesis in a dose-dependent manner. These findings were consistent with a previously reported ND50 of 4 to 15 times the mass of VEGF (30). The release profiles of VEGF and its antibody showed that the two agents were released in a sustained manner, albeit with initial bursts as observed in other studies utilizing poly(lactic-co-glycolic acid) (32, 33).
By simultaneously delivering anti-VEGF with VEGF in AVA scaffolds, the overly high concentration of VEGF that typically results from the initial burst release was mitigated. Computational simulations accounting for release, diffusion, degradation, and binding dynamics of VEGF and anti-VEGF showed that excessive VEGF was bound by anti-VEGF in this situation. The remaining free VEGF is the only active angiogenic agent delivered. Because release profiles of VEGF and anti-VEGF both exhibit initial bursts, the resulting concentration profile peak of free VEGF in the beginning was drastically reduced. Thus, a temporally stable concentration profile of an active angiogenic agent is achieved with a delivery device that has an inherent initial burst release. This methodology can also likely be applied to other drug delivery applications in order to mitigate the negative effects of initial bursts. The capillary densities achieved in VEGF-containing layers were comparable to previous studies with protracted release of VEGF (18, 20). Despite the reduction in total active VEGF delivered in the AVA scaffolds, the resulting vessel densities and perfusion in the scaffold and in the underlying muscles were not statistically different from those of the scaffolds delivering VEGF only. The AVA scaffolds also showed moderate improvement in preventing necrosis compared to VEGF only and BVB. The free-VEGF concentration in the V and BVB scaffolds likely was an oversaturating dose, or the excessive VEGF created nonproductive vasculature in these conditions (9, 10, 34). Another possibility is that the lowered microenvironmental VEGF concentration in the AVA condition resulted in more structurally effective blood vessels in the central layer that compensated for the reduced blood vessel densities in the two side layers.
Aside from a reduction in the concentration of the free activator, VEGF, the initial spatial separation of the inhibitor and activator lead to a spatially sharp and restricted angiogenic region. This methodology mimics developmental processes in nature that use opposing factors as a method of control. Reaction-diffusion mechanisms involving an inhibitor and an activator manifest in murine interfollicular patterns, angelfish skin patterns, and avian feather size and spacing (35–37). The polymer system described in the present paper is also robust against fluctuations in angiogenic VEGF threshold and initial encapsulated mass. Similarly, natural processes employ mechanisms to enhance the robustness of morphogen gradients against fluctuations in gene dosage or environmental conditions (38). These mechanisms include self-enhanced degradation (39), complexes with restricted diffusion (40), feedback (41), or their combination. In the polymeric system described, since VEGF and anti-VEGF have a canceling effect, increased doses in both of these proteins will likely not affect the width of the APR. In order to alter the width of the APR, VEGF and anti-VEGF doses are expected to be inversely adjusted.
Many researchers have proposed the delivery of multiple agents with different release methodologies in order to address complex biological events (1, 42, 43). This study achieves spatial restriction and temporal stability of an active concentration profile of a drug by simultaneously delivering a direct inhibitor.
Supplementary Material
Acknowledgments.
Financial support was provided by Wyss Institute and by National Institutes of Health R01 HL069957. We also thank Biological Resources of the National Cancer Institute for providing VEGF for our studies.
Footnotes
The authors declare no conflict of interest.
This article is a PNAS Direct Submission.
This article contains supporting information online at www.pnas.org/lookup/suppl/doi:10.1073/pnas.1001192107/-/DCSupplemental.
References
- 1.Richardson TP, et al. Polymeric system for dual growth factor delivery. Nat Biotechnol. 2001;19:1029–1034. doi: 10.1038/nbt1101-1029. [DOI] [PubMed] [Google Scholar]
- 2.Bonauer A, et al. MicroRNA-92a controls angiogenesis and functional recovery of ischemic tissues in mice. Science. 2009;324:1710–1713. doi: 10.1126/science.1174381. [DOI] [PubMed] [Google Scholar]
- 3.Carmeliet P. Mechanisms of angiogenesis and arteriogenesis. Nat Med. 2000;6:389–395. doi: 10.1038/74651. [DOI] [PubMed] [Google Scholar]
- 4.Folkman J. Angiogenesis. Annu Rev Med. 2006;57:1–18. doi: 10.1146/annurev.med.57.121304.131306. [DOI] [PubMed] [Google Scholar]
- 5.Yancopoulos GD, et al. Vascular-specific growth factors and blood vessel formation. Nature. 2000;407:242–248. doi: 10.1038/35025215. [DOI] [PubMed] [Google Scholar]
- 6.Takeshita S, et al. Therapeutic angiogenesis. A single intraarterial bolus of vascular endothelial growth factor augments revascularization in a rabbit ischemic hind limb model. J Clin Invest. 1994;93:662–670. doi: 10.1172/JCI117018. [DOI] [PMC free article] [PubMed] [Google Scholar]
- 7.Henry TD, et al. The VIVA trial: Vascular endothelial growth factor in Ischemia for Vascular Angiogenesis. Circulation. 2003;107:1359–1365. doi: 10.1161/01.cir.0000061911.47710.8a. [DOI] [PubMed] [Google Scholar]
- 8.Dor Y, Djonov V, Keshet E. Making vascular networks in the adult: Branching morphogenesis without a roadmap. Trends Cell Biol. 2003;13:131–136. doi: 10.1016/s0962-8924(03)00022-9. [DOI] [PubMed] [Google Scholar]
- 9.Noguera-Troise I, et al. Blockade of Dll4 inhibits tumour growth by promoting non-productive angiogenesis. Nature. 2006;444:1032–1037. doi: 10.1038/nature05355. [DOI] [PubMed] [Google Scholar]
- 10.Thurston G, Noguera-Troise I, Yancopoulos GD. The Delta paradox: DLL4 blockade leads to more tumour vessels but less tumour growth. Nat Rev Cancer. 2007;7:327–331. doi: 10.1038/nrc2130. [DOI] [PubMed] [Google Scholar]
- 11.Silva EA, Mooney DJ. Spatiotemporal control of vascular endothelial growth factor delivery from injectable hydrogels enhances angiogenesis. J Thromb Haemost. 2007;5:590–598. doi: 10.1111/j.1538-7836.2007.02386.x. [DOI] [PubMed] [Google Scholar]
- 12.Barrio RA, et al. A two-dimensional numerical study of spatial pattern formation in interacting Turing systems. Bull Math Biol. 1999;61:483–505. doi: 10.1006/bulm.1998.0093. [DOI] [PubMed] [Google Scholar]
- 13.Faissner A, Steindler D. Boundaries and inhibitory molecules in developing neural tissues. Glia. 1995;13:233–254. doi: 10.1002/glia.440130402. [DOI] [PubMed] [Google Scholar]
- 14.Turing AM. The chemical basis of morphogenesis. Philos Trans R Soc London B. 1952;237:37–72. [Google Scholar]
- 15.Turing AM. The chemical basis of morphogenesis. 1953. Bull Math Biol. 1990;52:153–197. doi: 10.1007/BF02459572. discussion pp 119–152. [DOI] [PubMed] [Google Scholar]
- 16.Fleming AB, Saltzman WM. Simultaneous delivery of an active protein and neutralizing antibody: Creation of separated regions of biological activity. J Control Release. 2001;70:29–36. doi: 10.1016/s0168-3659(00)00318-7. [DOI] [PubMed] [Google Scholar]
- 17.Ferrara N, Kerbel RS. Angiogenesis as a therapeutic target. Nature. 2005;438:967–974. doi: 10.1038/nature04483. [DOI] [PubMed] [Google Scholar]
- 18.Sun Q, et al. Sustained vascular endothelial growth factor delivery enhances angiogenesis and perfusion in ischemic hind limb. Pharm Res. 2005;22:1110–1116. doi: 10.1007/s11095-005-5644-2. [DOI] [PubMed] [Google Scholar]
- 19.Harris LD, Kim BS, Mooney DJ. Open pore biodegradable matrices formed with gas foaming. J Biomed Mater Res. 1998;42:396–402. doi: 10.1002/(sici)1097-4636(19981205)42:3<396::aid-jbm7>3.0.co;2-e. [DOI] [PubMed] [Google Scholar]
- 20.Chen RR, et al. Spatio-temporal VEGF and PDGF delivery patterns blood vessel formation and maturation. Pharm Res. 2007;24:258–264. doi: 10.1007/s11095-006-9173-4. [DOI] [PubMed] [Google Scholar]
- 21.Helm CLE, et al. Synergy between interstitial flow and VEGF directs capillary morphogenesis in vitro through a gradient amplification mechanism. Proc Natl Acad Sci USA. 2005;102:15779–15784. doi: 10.1073/pnas.0503681102. [DOI] [PMC free article] [PubMed] [Google Scholar]
- 22.Brouwers JEM, et al. Can the growth factors PTHrP, Ihh and VEGF, together regulate the development of a long bone? J Biomech. 2006;39:2774–2782. doi: 10.1016/j.jbiomech.2005.10.004. [DOI] [PubMed] [Google Scholar]
- 23.Clauss MA, Jain RK. Interstitial transport of rabbit and sheep antibodies in normal and neoplastic tissues. Cancer Res. 1990;50:3487–3492. [PubMed] [Google Scholar]
- 24.Pluen A, et al. Role of tumor-host interactions in interstitial diffusion of macromolecules: Cranial vs. subcutaneous tumors. Proc Natl Acad Sci USA. 2001;98:4628–4633. doi: 10.1073/pnas.081626898. [DOI] [PMC free article] [PubMed] [Google Scholar]
- 25.Crank J. The Mathematics of Diffusion. 2d Ed. viii. Oxford, England: Clarendon; 1975. p. 414. [Google Scholar]
- 26.Vieira P, Rajewsky K. The half-lives of serum immunoglobulins in adult mice. Eur J Immunol. 1988;18:313–316. doi: 10.1002/eji.1830180221. [DOI] [PubMed] [Google Scholar]
- 27.Vieira P, Rajewsky K. The bulk of endogenously produced IgG2a is eliminated from the serum of adult C57BL/6 mice with a half-life of 6–8 days. Eur J Immunol. 1986;16:871–874. doi: 10.1002/eji.1830160727. [DOI] [PubMed] [Google Scholar]
- 28.Presta LG, et al. Humanization of an anti-vascular endothelial growth factor monoclonal antibody for the therapy of solid tumors and other disorders. Cancer Res. 1997;57:4593–4599. [PubMed] [Google Scholar]
- 29.Chen RR, et al. Integrated approach to designing growth factor delivery systems. FASEB J. 2007;21:3896–3903. doi: 10.1096/fj.06-7873com. [DOI] [PubMed] [Google Scholar]
- 30.Wang Y, et al. Biological activity of bevacizumab, a humanized anti-VEGF antibody in vitro. Angiogenesis. 2004;7:335–345. doi: 10.1007/s10456-004-8272-2. [DOI] [PubMed] [Google Scholar]
- 31.Ozawa CR, et al. Microenvironmental VEGF concentration, not total dose, determines a threshold between normal and aberrant angiogenesis. J Clin Invest. 2004;113:516–527. doi: 10.1172/JCI18420. [DOI] [PMC free article] [PubMed] [Google Scholar]
- 32.Sheridan MH, et al. Bioabsorbable polymer scaffolds for tissue engineering capable of sustained growth factor delivery. J Control Release. 2000;64:91–102. doi: 10.1016/s0168-3659(99)00138-8. [DOI] [PubMed] [Google Scholar]
- 33.Jain RA. The manufacturing techniques of various drug loaded biodegradable poly(lactide-co-glycolide) (PLGA) devices. Biomaterials. 2000;21:2475–2490. doi: 10.1016/s0142-9612(00)00115-0. [DOI] [PubMed] [Google Scholar]
- 34.Ridgway J, et al. Inhibition of Dll4 signalling inhibits tumour growth by deregulating angiogenesis. Nature. 2006;444:1083–1087. doi: 10.1038/nature05313. [DOI] [PubMed] [Google Scholar]
- 35.Sick S, et al. WNT and DKK determine hair follicle spacing through a reaction-diffusion mechanism. Science. 2006;314:1447–1450. doi: 10.1126/science.1130088. [DOI] [PubMed] [Google Scholar]
- 36.Kondo S, Asai R. A reaction-diffusion wave on the skin of the marine angelfish Pomacanthus. Nature. 1995;376:765–768. doi: 10.1038/376765a0. [DOI] [PubMed] [Google Scholar]
- 37.Jiang TX, et al. Self-organization of periodic patterns by dissociated feather mesenchymal cells and the regulation of size, number and spacing of primordia. Development. 1999;126:4997–5009. doi: 10.1242/dev.126.22.4997. [DOI] [PubMed] [Google Scholar]
- 38.Eldar A, Shilo BZ, Barkai N. Elucidating mechanisms underlying robustness of morphogen gradients. Curr Opin Genet Dev. 2004;14:435–439. doi: 10.1016/j.gde.2004.06.009. [DOI] [PubMed] [Google Scholar]
- 39.Eldar A, et al. Self-enhanced ligand degradation underlies robustness of morphogen gradients. Dev Cell. 2003;5:635–646. doi: 10.1016/s1534-5807(03)00292-2. [DOI] [PubMed] [Google Scholar]
- 40.Eldar A, et al. Robustness of the BMP morphogen gradient in Drosophila embryonic patterning. Nature. 2002;419:304–308. doi: 10.1038/nature01061. [DOI] [PubMed] [Google Scholar]
- 41.von Dassow G, et al. The segment polarity network is a robust development module. Nature. 2000;406:188–192. doi: 10.1038/35018085. [DOI] [PubMed] [Google Scholar]
- 42.Carmeliet P, Jain RK. Angiogenesis in cancer and other diseases. Nature. 2000;407:249–257. doi: 10.1038/35025220. [DOI] [PubMed] [Google Scholar]
- 43.Richards Grayson AC, et al. Multi-pulse drug delivery from a resorbable polymeric microchip device. Nat Mater. 2003;2:767–772. doi: 10.1038/nmat998. [DOI] [PubMed] [Google Scholar]
Associated Data
This section collects any data citations, data availability statements, or supplementary materials included in this article.