

Abstract
Overexpression of the c-Myc proto-oncogene is associated with a broad spectrum of human cancers. The nuclease hypersensitivity element III1 (NHE III1) of the c-Myc promoter can form transcriptionally active and silenced forms and the formation of DNA G-quadruplex structures has been shown to be critical for c-Myc transcriptional silencing. The major G-quadruplex formed in the c-Myc NHE III1 is a mixture of four loop-isomers, which have all been shown to be biologically relevant to c-Myc transcriptional control. In this study we performed a thorough thermodynamic and kinetic study of the four c-Myc loop-isomers in K+ solution. The four loop-isomers all form parallel-stranded G-quadruplexes with short loop lengths. While the parallel-stranded G-quadruplex has been known to favor short loop lengths, our results show that the difference in thermodynamic and kinetic properties of the four loop-isomers, and hence between the parallel G-quadruplexes with similar loop lengths, is more significant than previously recognized. At 20 mM K+, the average difference of the Tm values between the most stable loop-isomer 14/23 and the least stable loop-isomer 11/20 is greater than 10 degrees. In addition, the capping structures formed by the extended flanking segments are shown to contribute to a stabilization of 2–3°C in Tm for the c-Myc promoter G-quadruplex. Understanding the intrinsic thermodynamic stability and kinetic properties of the c-Myc G-quadruplex loop-isomers can help understand their biological roles and drug targeting.
Keywords: c-Myc promoter G-quadruplex, loop-isomers, parallel-stranded G-quadruplex, thermodynamic stability, folding kinetics
Overexpression of the c-Myc proto-oncogene is associated with a broad spectrum of human cancers, including colon, breast, prostate, cervical, and lung carcinomas, osteosarcomas, lymphomas, and leukemias (1–9). In addition, elevated levels of c-Myc expression are often associated with poor therapeutic prognosis. c-Myc overexpression can be caused by different mechanisms, including gene amplification (10, 11), translocation (12–14), and simple upregulation of transcription (1, 15). The transcriptional regulation of c-Myc expression is complex and involves multiple promoters and transcriptional start sites, with P1 and P2 being the predominant promoters (16). A highly conserved NHE III1, a 27-base-pair sequence located 142 to 115 base pairs upstream from the P1 promoter, has been shown to be required for 80–95% of c-Myc transcription, regardless of whether the P1 or P2 promoter is used (17, 18). This NHE III1 element can form transcriptionally active and silenced forms in the promoter (19); the formation of DNA G-quadruplex structures is critical for c-Myc transcriptional silencing (20–22), and compounds that stabilize the G-quadruplex can repress c-Myc gene expression (20, 23).
DNA G-quadruplexes are a family of secondary DNA structures that consist of stacked G-tetrads connected by Hoogsteen hydrogen bonds and stabilized by monovalent cations such as potassium and sodium. Intramolecular G-quadruplexes have been found in a number of G-rich regions with biological significance, such as human telomeres and oncogene promoters (24, 25). The G-rich strand of the c-Myc NHE III1 is a 27-nt long segment (mycPu27) comprised of five consecutive runs of guanines (Figure 1A). It has been previously shown by mutational analysis in conjunction with a luciferase reporter system that the major G-quadruplex structure formed in MycPu27 in K+ solution involves four consecutive 3′ runs of guanines (G7–G9, G11–G14, G16–G18, G20–G23) but not the 5′ run of guanines (G2–G5) (Figure 1A) (20, 26). However, the sequence containing four consecutive 3′ guanine runs (Myc2345, Figure 1A) can form a mixture of four loop-isomers because only three consecutive guanines of the two four-guanine runs (G11–G14, G20–G23) are involved in the G-tetrad formation (26) (Figure 1B). The four loop-isomers have different arrangements of 1- and 2-nt loops and can be separately formed by dual G-to-T substitutions at (14,23), (11,23), (14,20), and (11,20) positions, respectively. While the 14/23 isomer is the major conformation of Myc2345, all of the four loop-isomers have been shown to be biologically relevant to c-Myc transcriptional control (26). We have determined the molecular structure of the major loop-isomer (1:2:1) of the c-Myc G-quadruplex in K+ solution using the 14/23 sequence (Figure 1A) (27). The four loop-isomers have been shown to adopt parallel-stranded folding topology in K+ solution (26, 28). The wild-type sequence, which forms a mixture of all four loop-isomers, shows the highest inhibition of c-Myc transcription, indicating that each loop-isomer contributes to this inhibitory effect (26). Thus, the biological function of the c-Myc promoter G-quadruplex depends on the equilibrium of the four loop-isomers; however, it is not known yet what the relative stability and folding kinetics of each loop-isomer are and how each loop-isomer contributes to the equilibrium.
Figure 1.
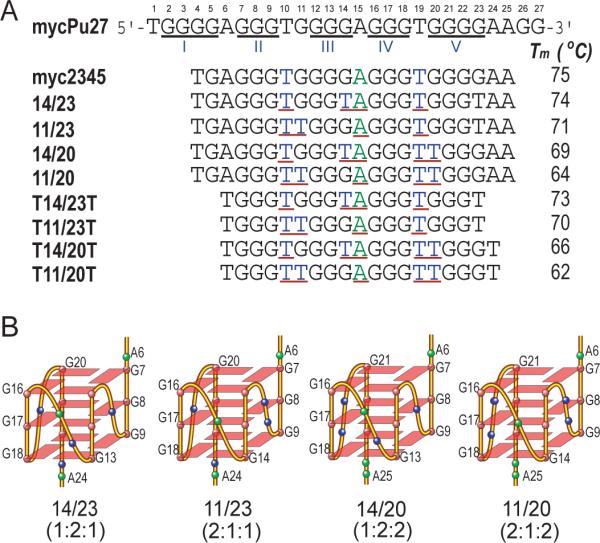
(A) The promoter sequence of the NHE III1 element of the c-Myc gene and its modifications. MycPu27 is the wild-type 27-mer G-rich sequence of the c-Myc NHE III1. The five runs of guanines are underlined and numbered from 5'-end. The numbering system is shown above mycPu27. Myc2345 is the 22-nt G-rich sequence that adopts the major c-Myc promoter G-quadruplex. Myc2345 has four loop-isomers, which can be isolated by dual G-to-T substitutions at (14,23), (11,23), (14,20), and (11,20) positions, namely, 14/23, 11/23, 14/20, and 11/20, respectively. 14/23 is the mutant Myc2345 that forms the major loop-isomer and was used for NMR structure determination (26). The truncated sequences of four loop-isomers have only one flanking T at each end. The three loops of each loop-isomer are underlined. The melting temperatures (Tm) of all the sequences in 20 mM K+ solution are also shown. (B) Schematic drawing of the folding topologies of the four loop-isomers of the major c-Myc G-quadruplex Myc2345 in K+ solution. The four loop-isomers all adopt parallel-stranded folding and have different arrangements of 1- and 2-nt loops. Base colors: red = guanine, blue = thymine, green = adenine.
In this report, we performed a complete thermodynamic and folding kinetic study of the four loop-isomers of the major G-quadruplex formed in the c-Myc promoter in K+ solution. We also examined the effect of the flanking sequences by comparing sequences with and without flanking segments. The different loop-isomers may have different protein interactions and could be recognized by different small molecule compounds. Understanding the intrinsic thermodynamic stability and folding kinetics of the four loop-isomers may thus help understand the biological role of the c-Myc loop-isomers and their drug targeting. In addition, it has been found that the intramolecular G-quadruplex structures formed in gene promoters are in general a mixture of multiple loop-isomers due to the unequal number of guanines in each G-tract, and that parallel-stranded structural motifs with short loops are prevalent in promoter quadruplexes (29). While the parallel-stranded structural motifs have been shown to favor short loop lengths in K+ solution (24, 27, 30–32), it is unclear how much difference exists between the single- or double-nt loops. Thus our results also provide information on the effects of the loop sizes and arrangements, as well as of the flanking segments, on the thermodynamic stability and folding kinetics of parallel-stranded G-quadruplexes with short loops in general.
MATERIALS AND METHODS
Oligonucleotides
The DNA oligonucleotides were synthesized using β-cyanoethylphosphoramidite solid-phase chemistry on an Expedite™ 8909 Nucleic Acid Synthesis System (Applied Biosystem, Inc., Foster City, CA) in DMT-on mode and were purified using MicroPure II columns from BioSearch Technologies (Novato, CA) according to the provided protocol. Concentrations were determined using UV spectroscopy by recording the absorbance at 260 nm. Oligonucleotide extinction coefficients (ε260) were calculated using the nearest neighbor method (33) as follows: myc2345, 266,170 M−1 cm−1; 14/23, 11/23, 14/20, & 11/20, 258,933 M−1 cm−1; T14/23T & T11/23T, 201,329 M−1 cm−1; T14/20T & T11/20T, 209,732 M−1 cm−1.
Circular Dichroism (CD) spectroscopic study
CD spectroscopic study of the oligonucleotides was performed on a Jasco J-810 spectropolarimeter (Jasco, Easton, MD) equipped with a thermoelectrically controlled cell holder. DNA samples were prepared at 10 μM in 10 mM Li3PO4 (pH 7.0) with various concentrations of KCl in a total volume of 200 μL. The DNA samples were annealed by being heated at 95°C for 10 min and cooled to room temperature, and then transferred into a quartz cell of 1 mm optical path length for CD measurements. A blank sample containing only buffer was used for the baseline correction.
CD spectroscopic measurements were the averages of three scans collected between 350–200 nm at 25°C. The scanning speed of the CD instrument was 100 nm/min, and the response time was 1 s.
For CD melting or annealing experiments, CD measurements were performed at 265 nm, with a heating or cooling rate of 2–0.5°C/min, respectively. A heating or cooling rate lower than 0.5°C/min gave notable instrument-related noises.
NMR spectroscopic study
NMR experiments were performed on a Bruker DRX-600 spectrometer as described previously(30). Samples in water were prepared in 10%/90% D2O/H2O solution. The final NMR samples contained 0.1–2.5 mM DNA in 25 mM potassium phosphate buffer (pH 7.0) and 70 mM KCl. Before running the experiments, samples were annealed by heating to 95°C for 10 min and then cooled to room temperature. The 1D 1H NMR spectra were recorded at 25°C with a Watergate pulse sequence to suppress the water signal. The spectral width was 25 ppm and 256 scans were collected. In each scan 16k of data points were used.
Data analysis
Thermodynamic analysis
The melting temperature (Tm) values were calculated from Van't Hoff analysis of the CD melting profiles and from the maximum in the first derivative of the melting curves using SigmaPlot 8.0. We also used SigmaPlot 8.0 to determine the T1/2 values where T1/2 is the temperature for which the normalized absorbance is 0.5. These two methodologies gave similar results for Tm and T1/2, which is expected for intramolecular quadruplexes. The folded fraction was determined from the difference between the absorbance of the upper and lower asymptotes as previously described (34). In order to test the reproducibility of the technique, all the experiments were repeated at least twice; the Tm values of the repeats differed by <1°C.
In the case of a two-state folding-unfolding process with no significant intermediate formed, the process can be symbolized by
| (1) |
In this expression, F and UF refer to the folded and the unfolded fraction of the oligonucleotides, respectively, Keq is the equilibrium constant and k1 and k−1 are the folding and the unfolding rate constants, respectively. The equilibrium constant (Keq = F/UF) can be calculated from the equation:
| (2) |
where a is the folded fraction obtained from the normalized experimental absorbance in melting and annealing curves. For complete folding, a = 1, and for complete unfolding, a = 0. In order to calculate the equilibrium constants precisely, the analysis must be restricted to the temperature range for which 0.03 < a < 0.97 (34). From the equations:
| (3) |
| (4) |
where T is the temperature in Kelvins and R is the gas constant (8.314 J K−1 mol−1), the following equation can be obtained:
| (5) |
Based on this equation, in a two-state model, ΔH and ΔS values can be determined by plotting the line of lnKeq(T) (y axis) vs 1/T (x axis), where −ΔH/R is the slope and ΔS/R is the y-intercept. ΔG values can be calculated from equation 3 (assuming that ΔCp = 0). Tm values can also be determined from the same equation: at the melting temperature Tm, ΔG = 0, and therefore Tm = ΔH/ΔS.
Number of bound potassium cations
As previously described (35), assuming a simple model of the transition between the folded and the unfolded state:
here, Δn is the difference between the number of monovalent ions bound in the folded and unfolded states, and thus is the number of cations specifically bound to the folded state. The Δn value can be calculated from the rate of change in ΔG25 as a function of log[K+] based on the following equation:
| (6) |
where Δ ΔG25/ Δlog[K+] is the slope of the line which relates ΔG25 and log[K+].
Kinetic analysis
k1 and k−1 rate constants for folding and unfolding processes can be derived using the hysteresis between the CD melting and annealing curves, as previously described (34, 36, 37).
The rate equation associated with a two state model (eq. 1) is:
| (7) |
The use of folded fraction a in equation 7 gives:
| (8) |
| (9) |
where am and aa are the fractions of the folded DNA at any temperatures in the melting and the annealing curves, respectively. Additionally, d(aa)/dt and d(am)/dt can be determined from the equation
| (10) |
where dT/dt is the temperature gradient used in melting and annealing experiments and the term da/dT can be determined from the experimental melting and annealing curves. By solving equations 8 and 9, k1 and k−1 values can be calculated in a wide range of temperatures. Since k1 = k−1 at the melting temperature, Tm values can be calculated for oligonucleotides with very slow kinetics, for which hysteresis occurs even at a very slow rate of heating and cooling. Activation energies can be determined using the Arrhenius equation
| (11) |
where Ea is the activation energy and A is the pre-exponential factor (or frequency factor). Equation 11 can be transformed to
| (12) |
In the Arrhenius relationship (lnk vs 1/T), the slope of the line is –Ea/R and the y-intercept is lnA.
RESULTS
Four loop-isomers of the major c-Myc G-quadruplex Myc2345 formed well-defined parallel-stranded conformations under physiologically relevant conditions, as shown by CD and NMR
For the two four-guanine runs (G11–G14, G20–G23) of the c-Myc promoter NHE III1 element (Figure 1A), only three consecutive guanines are involved in the G-tetrad formation, therefore the sequence containing four consecutive 3′ guanine runs (Myc2345) (Figure 1B) can form a mixture of four loop-isomers. Strategic dual G-to-T substitutions at (14,23), (11,23), (14,20), and (11,20) positions, respectively, lead to DNA sequences that can form only one of the four possible loop-isomers, i.e., the 1:2:1, 2:1:1, 1:2:2, or 2:1:2 loop-isomer (Figure 1B). The 1:2:1 loop-isomer has been shown to be the major loop-isomer of the c-Myc promoter G-quadruplex, with a parallel-stranded folding (26). We have determined the NMR structure of this major loop-isomer in physiologically relevant K+ solution using the 14/23 sequence, a 22-mer c-Myc promoter sequence with dual G-to-T substitutions at (14,23) positions (Figure 1A) (27). The 14/23 sequence exhibits a NMR spectrum with sharp line-width and good spectral resolution in 100 mM K+ at pH 7 (Figure 2A top). Twelve sharp imino peaks in the region of 10.5–12.5 ppm, which is a characteristic region for tetrad-guanines in a G-quadruplex, indicate the formation of a single stable intramolecular G-quadruplex structure with three G-tetrads (Figure 1B left) (27).
Figure 2.

(A) The imino regions of 1D 1H NMR spectra of the 14/23, 11/23, 14/20, 11/20 sequences which form four loop-isomers of the major c-Myc G-quadruplex. All four modified 22-nt Myc2345 sequences show high quality 1H NMR spectra, indicating the formation of a single and stable G-quadruplex structure. Experimental conditions: 25°C, 30 mM K+-phosphate, 70 mM KCl, pH 7.0, 0.2 mM DNA. (B) CD spectra of 14/23, 11/23, 14/20, 11/20 in the presence of 10 mM Li3PO4 (pH 7) and 2 mM [K+] at 25°C. Each sample contained 10 μM DNA. All four loop-isomers are shown to adopt a parallel-stranded topology with all anti glycosidic sugar conformations for tetrad guanines, as indicated by a positive peak around 265 nm and a negative peak around 240 nm.
To systematically examine the stability of the four c-Myc G-quadruplex loop-isomers, we modified the Myc2345 sequence with different dual G-to-T substitutions at (11,23), (14,20), and (11,20) positions, namely, 11/23, 14/20, and 11/20, for the 2:1:1, 1:2:2, and 2:1:2 loop-isomers, respectively (Figure 1A). The same 5' flanking segment is used for all four loop-isomers for a fair comparison. We applied NMR spectroscopy for each sequence to monitor the formation of G-quadruplex. The imino proton regions of the 1D 1H NMR spectra of the four loop-isomer sequences in 100 mM K+ solution at pH 7 are shown in Figure 2A. All of the four modified c-Myc promoter sequences give rise to excellent quality NMR spectra with sharp peaks. As anticipated, 12 well-resolved and sharp imino proton peaks are observed for each loop-isomer sequence, indicating the formation of a single stable intramolecular G-quadruplex with three G-tetrads (Figure 1B).
The CD spectra of the four loop-isomer sequences in K+ solution, which showed a positive peak at 265 nm and a negative peak at 240 nm (Figure 2B), confirmed that they all adopt a parallel-stranded topology as previously suggested (26). CD spectroscopy has become a useful method to infer the topology of a DNA G-quadruplex (31, 38–41). The stacking tetrad-guanines with the same anti glycosidic bond conformation, as seen in G-quadruplexes with a parallel-stranded topology, give rise to a CD profile with a positive peak around 265 nm and a negative peak around 240 nm; whereas the stacking tetrad-guanines with alternating syn and anti glycosidic conformations, as seen in G-quadruplexes with antiparallel-stranded topologies, gives rise to a positive CD peak at 295 nm.
The CD profiles of the four c-Myc G-quadruplex loop-isomers were not affected by the concentrations of K+ in the range of 2–100 mM K+. At very low K+ concentrations, such as 0.5 mM, a decrease in molecular ellipticity was observed, likely caused by partial unfolding of G-quadruplexes due to the low melting temperatures.
CD melting studies of the four c-Myc loop-isomers with flanking segments show a clear difference in their stability, with 14/23 being the most stable
In order to examine the stability of the four c-Myc G-quadruplex loop-isomers, CD melting experiments were performed at 265 nm, which was the maximum in CD profiles for all four parallel-stranded loop-isomers. Lithium phosphate at pH 7 was used as the buffer for all DNA samples in the CD melting study, because the lithium cation has been shown not to stabilize the G-quadruplex structures (42) and thus does not interfere with accurate measurements of the stabilizing effects of the potassium cation. No aggregation was observed for any DNA samples. The melting temperature (Tm) of a G-quadruplex, at which half of the DNA molecules are unfolded, were determined using the CD melting curve. Additionally, thermodynamic parameters, such as ΔH, ΔS and ΔG, were calculated from melting profiles using van't Hoff analysis. At concentrations lower than 0.5 mM, the c-Myc G-quadruplex loop-isomers were too unstable to have their melting temperatures accurately measured. At K+ concentrations higher than 50 mM, the Tm values of some loop-isomers, such as 14/23, are too high to be measured by CD melting (Tm > 90°C). Therefore, K+ concentrations between 0.5 mM and 50 mM were used for the CD melting studies and thermodynamic calculations.
No hysteresis was observed in CD melting experiments for all of the four loop-isomers at K+ concentrations of 5 mM or higher with the heating/cooling rate of 2°C min−1, indicating that the folding and unfolding processes are at a thermodynamic equilibrium, and hence the Tm values and thermodynamic parameters can be accurately determined. At K+ concentrations lower than 5 mM, a heating/cooling rate of 0.5°C min−1 was needed to prevent any hysteresis. For the 11/20 sequence, even at the rate of 0.5°C min−1 which was the low limit for the CD instrument, some hysteresis was observed (Figure S1), indicating that the temperature change is still too fast for the 11/20 G-quadruplex loop-isomer to reach the thermodynamic equilibrium.
As shown in Table 1, the melting temperatures of the four c-Myc G-quadruplex loop-isomers were all independent of concentration, confirming the intramolecular (monomeric) nature of the molecular systems. CD melting experiments performed at various concentrations of K+ ion showed a strong dependence of the Tm values on the K+ concentration (Table 2). As expected, the increase of the K+ concentration markedly increases the Tm values of the four c-Myc loop-isomers. The CD melting curves of 14/23 at various K+ concentrations is shown as an example in Figure 3A.
Table 1.
Tm (°C) values for 14/23, 11/23, 14/20 and 11/20 using different concentrations of DNA. All experiments were performed in the presence of 10 mM Li3PO4, pH 7.0, containing 2 mM [K+], at a heating rate of 2°C/min.
| [DNA] | 14/23 | 11/23 | 14/20 | 11/20 |
|---|---|---|---|---|
| 5 μM | 59.0 | 54.1 | 51.5 | 48.0 |
| 10 μM | 58.8 | 53.3 | 51.0 | 47.5 |
| 20 μM | 59.0 | 54.1 | 51.3 | 48.0 |
| 50 μM | 58.0 | 53.5 | 50.8 | 47.2 |
Table 2.
Thermodynamic data for the c-Myc G-quadruplex loop-isomers formed by the extended and truncated DNA sequences, determined in the presence of 10 mM Li3PO4 (pH=7) containing different concentrations of K+. Samples were heated and cooled at a rate of 2°C /min.a
| [K+] (mM) | DNA | Tm (°C) | CTmb (°C) | ΔH (kJ/mol) | ΔS (kJ/molK) | ΔG37 (kJ/mol) | DNA | Tm (°C) | CTmb (°C) | ΔH (kJ/mol) | ΔS (kJ/molK) | ΔG37 (kJ/mol) |
|---|---|---|---|---|---|---|---|---|---|---|---|---|
| 0.5c | 14/23 | 43 | 42 | −129 | −0.412 | −1.86 | ||||||
| 2c | 14/23 | 57 | 56 | −173 | −0.526 | −9.92 | T14/23T | 57 | 57 | −167 | −0.508 | −9.96 |
| 5 | 14/23 | 64 | 63 | −181 | −0.540 | −14.03 | T14/23T | 65 | 65 | −165 | −0.491 | −13.40 |
| 10 | 14/23 | 69 | 69 | −185 | −0.542 | −17.57 | T14/23T | 69 | 69 | −162 | −0.475 | −14.92 |
| 20 | 14/23 | 75 | 74 | −212 | −0.612 | −22.59 | T14/23T | 73 | 72 | −184 | −0.535 | −18.32 |
| 50 | 14/23 | 80 | 79 | −192 | −0.548 | −22.93 | ||||||
| 0.5c | 11/23 | 39 | 37 | −120 | −0.390 | 0.05 | ||||||
| 2c | 11/23 | 52 | 52 | −154 | −0.476 | −6.90 | T11/23T | 53 | 53 | −156 | −0.481 | −7.18 |
| 5 | 11/23 | 60 | 60 | −146 | −0.439 | −10.03 | T11/23T | 61 | 60 | −166 | −0.501 | −11.60 |
| 10 | 11/23 | 64 | 63 | −173 | −0.516 | −13.65 | T11/23T | 65 | 64 | −159 | −0.473 | −12.37 |
| 20 | 11/23 | 72 | 71 | −189 | −0.550 | −18.50 | T11/23T | 70 | 69 | −189 | −0.553 | −17.45 |
| 50 | 11/23 | 75 | 75 | −158 | −0.454 | −17.51 | ||||||
| 0.5c | 14/20 | 34 | 34 | −129 | −0.421 | 1.41 | ||||||
| 2c | 14/20 | 50 | 49 | −154 | −0.479 | −5.70 | T14/20T | 48 | 48 | −165 | −0.515 | −5.60 |
| 5 | 14/20 | 58 | 57 | −159 | −0.483 | −9.70 | T14/20T | 57 | 56 | −172 | −0.523 | −9.95 |
| 10 | 14/20 | 62 | 61 | −159 | −0.480 | −11.10 | T14/20T | 61 | 61 | −180 | −0.540 | −12.78 |
| 20 | 14/20 | 69 | 69 | −178 | −0.521 | −16.49 | T14/20T | 66 | 65 | −187 | −0.553 | −15.45 |
| 50 | 14/20 | 72 | 71 | −158 | −0.462 | −15.39 | ||||||
| 0.5c | 11/20 | 28 | 26 | −108 | −0.363 | 4.03 | ||||||
| 2c | 11/20 | 47 | 46 | −115 | −0.362 | −3.33 | T11/20T | 44 | 44 | −150 | −0.476 | −3.00 |
| 5 | 11/20 | 53 | 52 | −118 | −0.364 | −5.49 | T11/20T | 53 | 53 | −164 | −0.505 | −7.76 |
| 10 | 11/20 | 57 | 56 | −126 | −0.386 | −7.16 | T11/20T | 58 | 58 | −165 | −0.501 | −10.15 |
| 20 | 11/20 | 65 | 64 | −148 | −0.442 | −11.61 | T11/20T | 62 | 62 | −173 | −0.518 | −12.81 |
| 50 | 11/20 | 67 | 66 | −138 | −0.408 | −11.96 |
The samples were prepared at a DNA concentration of 10 μM. All experiments were performed at least twice and Tmvalues are accurate to within 1°C. ΔH, ΔS and ΔG values are given with an experimental error of ±5% determined on the basis of at least two independent experiments. Missing values at low concentrations of K+ correspond to quadruplexes for which the Tm values were too low to measure or for which too high hysteresis was observed between the melting and annealing profiles even by using the lowest rate of cooling and heating.
Melting temperatures (CTm) calculated from the equation (Tm = ΔH/ΔS).
Samples were heated and cooled at a rate of 0.5°C/min.
Figure 3.
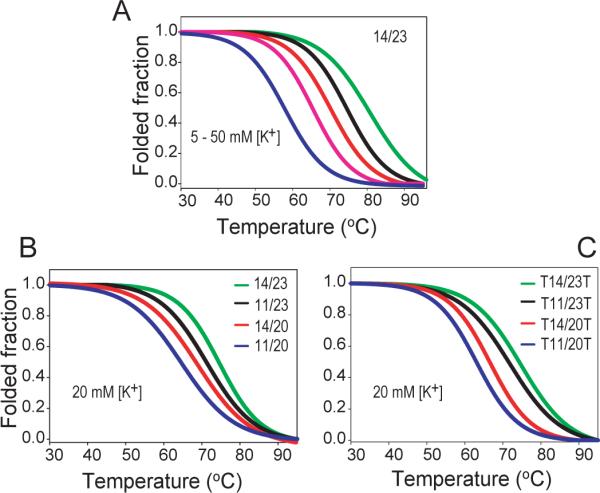
(A). CD melting curves for 14/23 in the presence of 10 mM Li3PO4 (pH 7) and different concentrations of K+ (2 mM to 50 mM, from left to right). 14/23 shows K+ concentration-dependent melting temperatures. The Tm of 14/23 at 50mM K+ concentration is ~80°C. 2 mM [K+], blue; 5 mM [K+], pink; 10 mM [K+], red; 20 mM [K+], black; 50 mM [K+], green. (B) & (C). CD melting curves of 11/20 (blue), 14/20 (red), 11/23 (black), and 14/23 (green) (B) and of the truncated sequences T11/20T (blue), T14/20T (red), T11/23T (black), and T14/23T (green) (C) of four loop-isomers in the presence of 10 mM Li3PO4 (pH 7) and 20 mM [K+]. The 14/23 loop-isomer is shown to be the most stable, followed by 11/23, 14/20 and 11/20. The heating rate of CD melting is 2°C/min.
A clear difference in stability was observed between the four c-Myc loop-isomers. CD melting profiles of the four loop-isomers with flanking segments in 20 mM [K+] were shown in Figure 3B. The 14/23 loop-isomer (1:2:1) is the most stable, followed by 11/23 (2:1:1), 14/20 (1:2:2), and 11/20 (2:1:2), as indicated by the Tm values (Figure 3B, Table 2). The 14/23 and 11/23 loop-isomers, which have one 2-nt loop and two 1-nt loops with a total loop length of 4, have a higher melting temperature than the 14/20 and 11/20 loop-isomers, which have two 2-nt loops and one 1-nt loop with a total loop length of 5. The difference between the Tm values of the most stable loop-isomer 14/23 and the least stable loop-isomer 11/20 is greater than 10°C. In addition, within the two loop-isomers with the same total loop length, 14/23 (T:TA:T loop-isomer) is clearly more stable than 11/23 (TT:A:T), and 14/20 (T:TA:TT) is clearly more stable than 11/20 (TT:A:TT) (Figure 1A), indicating that in addition to the loop length, the loop sequence also contributes to the stability of a G-quadruplex.
Thermodynamic parameters for the quadruplex-single-strand transition for the four c-Myc promoter loop-isomers with flanking segments were derived from van't Hoff analysis of the melting curves at various K+ concentrations (Table 2, S1). For a two-state model where there is no significant population of intermediates, the plot lnKvs 1/T provides a linear relationship with a slope of −Δ/R and a y-intercept of ΔS/R. Note that thermodynamic calculations at K+ concentrations lower than 2 mM were less accurate, due to the presence of hysteresis between the melting and annealing curves as well as to the fact that the quadruplexes were less stable under these conditions. Consistent with the Tm data, the thermodynamic data indicated that 14/23 is the most stable loop-isomer whereas 11/20 is the least stable. The ΔΔG25 between the two loop-isomers is about −13 kJ/mol at 20 mM [K+]. Again, the sequences with a total loop length of 4, i.e., 14/23 and 11/23, were more stable than the sequences with a total loop length of 5, i.e., 14/20 and 11/20; whereas 14/23 appeared to be more stable than 11/23, and 14/20 appeared to be more stable than 11/20. In addition, the ΔH values of all four c-Myc loop-isomers clearly decreased as the concentration of K+ increased from 0.5 mM to 20 mM, indicating the markedly enhanced stability of the c-Myc G-quadruplexes when the [K+] increased to 20 mM. This is consistent with the presence of specific cation binding sites within the G-quadruplex as previously reported (35). However, at 50 mM [K+], although the Tm values still increased from those at 20 mM [K+], the decrease of the ΔG values became much less obvious (14/23, 11/20) or even absent (11/23, 14/20) (Table 2). This phenomenon was also manifested by the shapes of the CD melting curves, which were less sharp at 50 mM [K+] (Figure 3A), suggesting the presence of minor conformations (see Discussion).
CD melting studies of the four truncated c-Myc loop-isomers indicated that the contribution of the longer flanking segments was about 2–3°C in Tm
The flanking segments have been found to be important for the formation of a well-defined c-Myc promoter G-quadruplex in NMR spectroscopic studies (27). As shown in our previous NMR structure study, specific capping structures are formed by the flanking segments at both ends of the 14/23 loop-isomer (27), and the stable formation of capping structures has been suggested to contribute to the stability of this parallel-stranded major c-Myc G-quadruplex. In order to examine how the c-Myc flanking segments and the capping structures contribute to the stability of the c-Myc G-quadruplex loop-isomers, we carried out CD melting studies on truncated c-Myc promoter sequences. While the same sample preparation and annealing process were used for all DNA samples, completely truncated sequences without any flanking segments (i.e., start and end with a guanine in a G-run) often gave unrepeatable results in CD melting studies, implying the high likelihood of the formation of higher-order structures. The formation of higher-order structures in completely truncated sequences was indicated by 1H NMR spectra, which showed a broader envelope of imino resonances in a much narrower range at 10.5–11 ppm (Figure S2). Aggregation was also observed as gel-like solution after multiple melting/annealing processes in completely truncated DNA sequences. Therefore we added a flanking thymine at the 5'- and 3'-ends of the terminal G-runs for the four c-Myc loop-isomers, namely, T14/23T, T11/23T, T14/20T, and T11/20T, respectively (Figure 1A). CD melting studies of the four loop-isomers with terminal thymines appeared to be repeatable, and no aggregation was observed for multiple melting/annealing experiments of those DNA samples. Figure 3C shows CD melting curves of the four truncated sequences at 20 mM [K+]. The results showed that the truncated sequences for the four loop-isomers have a lower Tm than the sequences with the longer flanking segments (Figure 1A), with the differences in Tm being 2°C, 2°C, 3°C, and 3°C for 14/23, 11/23, 14/20, and 11/20, respectively, at 20 mM [K+]. Thus it appeared that the longer flanking segments contributed to a stabilization of 2−3°C in Tm for the major c-Myc promoter G-quadruplexes. The thermodynamic parameters of the four truncated sequences at various K+ concentrations were summarized in Table 2. The relative stabilities for the four loop-isomers are the same as observed in sequences with longer flanking segments as described above. In particular, T14/23T is the most stable, followed by T11/23T, T14/20T, and T11/20T, as measured by both the Tm and ΔG37 values.
The number of monovalent potassium cations (Δn) specifically bound to a G-quadruplex could be calculated by the slopes of the plots of ΔG25 vs log[K+ (see equation (6)) (35, 43). ΔG values at 25 °C were used to ensure the complete folding of all four c-Myc loop-isomers at the K+ concentrations used for the calculation. Δn values were calculated to be 2.63, 2.24, 1.90, and 2.00 for 14/23, 11/23, 14/20, and 11/20, respectively; and 2.00, 1.91, 1.90, and 1.85 for the truncated sequences T14/23T, T11/23T T14/20T, and T11/20T, respectively. The Δn values of 2 appears likely for the four truncated loop-isomers, as two potassium cations are located between the three stacked G-tetrads of the c-Myc quadruplexes which contain only short loops. The higher Δn values of the sequences with longer flanking sequences are likely caused by the binding of potassium cation within the capping structure formed by the flanking segments (27).
Kinetic calculations indicated that the four loop-isomers differ in their folding and unfolding kinetics
No hysteresis was observed in CD melting experiments for all of the four loop c-Myc isomers with flanking segments at K+ concentrations of 5 mM or higher with the heating/cooling rate of 2°C min−1. A clear hysteresis was observed for the four loop-isomers in 2 mM [K+] at the heating/annealing rate of 2 °C min−1. Figure 4 shows the melting and annealing curves for 14/23 at heating/annealing rates of 0.5 °C min−1 and 2 °C min−1, and for 14/20 at heating/annealing rates of 2 °C min−1 and 4 °C min−1, respectively. The melting and annealing curves for 11/23 and 11/20 at heating/annealing rates of 2 °C min−1 and 4 °C min−1 are shown in Figure S3. A clear difference in the levels of hysteresis of the four c-Myc loop-isomers was observed. 14/23 and 11/23 showed the least hysteresis, 14/20 showed a larger hysteresis, and 11/20 showed markedly larger hysteresis (Figure 4, S3). At 2 mM [K+], the ΔTm values between the melting and annealing curves are around 3.5°C, 4°C, 4.7 °C, and 6°C for 14/23, 11/23, 14/20, and 11/20, respectively. Note that the Tm from the melting curve is always higher than that from the annealing curve. The presence of hysteresis between melting and annealing curves of a G-quadruplex indicates that the molecules are not at thermodynamic equilibrium because of the slow folding and/or unfolding processes.
Figure 4.

The CD melting (red) and annealing (black) curves of 14/20 and 14/23 loop-isomers with different temperature gradients. Hysteresis was observed between the melting and annealing curves for (A) 14/20 with temperature gradients of 2°C/min (upper) and 4°C/min (lower) and (B) 14/23 with temperature gradients of 2°C/min (upper) and 0.5°C/min (lower). No hysteresis was observed in 14/23 with a temperature gradient of 0.5°C/min, while the greatest hysteresis was seen in 14/20 with a temperature gradient of 4°C/min. The presence of hysteresis between melting and annealing profiles indicates the molecule is not at thermodynamic equilibrium during melting and annealing processes. Conditions: 10 mM Li3PO4 (pH=7), 2 mM K+.
The hysteresis data can be used to calculate the kinetic parameters, the rate constants of the folding (k1) and unfolding (k−1), for the unimolecular folding, as described previously (34, 37). The kinetic parameters of the four c-Myc loop-isomers with flanking segments were obtained from the melting/annealing curves of the four loop-isomers in 2 mM [K+] at the rate of 2°C min−1. Arrhenius plots for folding and unfolding rates obtained from these data for the four loop-isomers are shown in Figure 5. Based on the slopes of the plots the activation energies of folding and unfolding processes can be determined. The calculated melting temperature (CTm) for each loop-isomer can also be determined using the Arrhenius plots, i.e., the temperature where k1 equals k−1. The kinetic parameters derived form the Arrhenius plots are presented in Table 3. The association reaction, or the folding process, appears to be dominant at lower temperatures, as previously reported (37). The association reaction shows an apparent negative activation energy, indicating the reaction is faster at lower temperatures, as noted by others who suggested a nucleation-zipper reaction mechanism (34, 37). Among the four c-Myc loop-isomers, 14/23 had the most negative activation energy for the folding process, indicating that the 14/23 loop-isomer has the fastest folding. 11/20 had the least negative activation energy for the folding process, indicating that the folding process of 11/20 is the slowest.
Figure 5.
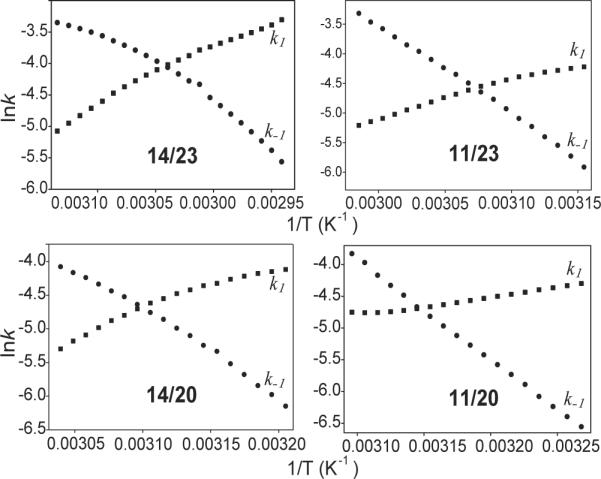
The Arrhenius plots for 14/23, 11/23, 14/20 and 11/20 showing the temperature dependence of the kinetic parameters of the folding and unfolding processes, based on the analysis of the hysteresis between the melting and annealing profiles. The k1 and k−1 values were obtained from the annealing and melting profiles. Using the slopes of these curves, the activation energies of folding and unfolding reactions can be determined. The theoretical melting temperatures can be determined at the intersection of k1 and k−1.curves. k1, squares; k−1, circles. All experiments were performed in the presence of 10 mM Li3PO4, pH 7.0, containing 2 mM [K+], at a cooling and heating rate of 2°C/min.
Table 3.
Kinetic parameters for the folding and unfolding processes for 14/23, 11/23, 14/20 and 11/20, determined from the analysis of the hysteresis between the melting and annealing profiles. All experiments were performed in the presence of 10 mM Li3PO4, pH 7.0, containing 2 mM [K+], at a cooling and heating rate of 2°C/min.
| DNA | k1 | k−1 | CTma (°C) | Tm (°C) melt/ann | ||
|---|---|---|---|---|---|---|
| Ea (kJ/mol) | lnA s−1 | Ea (kJ/mol) | lnA s−1 | |||
| 14/23 | −48 | −29 | 118 | 35 | 56 | 59.0/55.5 |
| 11/23 | −34 | −27 | 120 | 41 | 52 | 53.0/49.0 |
| 14/20 | −28 | −23 | 119 | 42 | 49 | 51.0/46.3 |
| 11/20 | −21 | −12 | 112 | 35 | 45 | 47.0/41.0 |
Calculated melting temperatures (CTm) are the temperatures where k1 equals to k−1.
DISCUSSION
The major G-quadruplex formed in the c-Myc promoter, the Myc-2345 G-quadruplex, has four loop-isomers, namely 1:2:1, 2:1:1, 1:2:2, or 2:1:2, which can be isolated by 14/23, 11/23, 14/20, and 11/20 sequences (Figure 1A). The four c-Myc loop-isomers have been previously shown to form parallel-stranded G-quadruplexes (26). While the 14/23 loop-isomer is the major conformation of the c-Myc promoter G-quadruplex, all of the four loop-isomers have been shown to be biologically relevant to c-Myc transcriptional control (26). The contribution of each loop-isomer to c-Myc transcriptional control is likely to be related with the stability and dynamic equilibrium of the four loop-isomers. In this study, we performed a thorough thermodynamic and kinetic study of the four loop-isomers of the major Myc-2345 G-quadruplex formed in the c-Myc promoter in K+ solution (44).
The four loop-isomers of the major c-Myc promoter G-quadruplex all have short loop lengths, i.e., 1-nt or 2-nt. Specifically, the loop length arrangements of the four loop-isomers, 14/23, 11/23, 14/20, and 11/20, are 1:2:1, 2:1:1, 1:2:2, and 2:1:2, respectively (Figure 1). Among the four loop-isomers, 14/23 and 11/23 have a total loop length of 4, and 14/20 and 11/20 have a total loop length of 5. The NMR and CD data showed that each of the four loop-isomers forms a stable parallel-stranded G-quadruplex under physiological K+ conditions (Figure 2, Table 2). Tm and ΔG values calculated from melting curves and van't Hoff analysis revealed that the thermodynamic stability of c-Myc G-quadruplexes depends strongly on loop lengths, while the loop sequences and the flanking segments also have a considerable effect. The 14/23 loop-isomer is the most stable, followed by 11/23, 14/20 and 11/20 (Figure 3, Table 2). Loop-isomers with only one 2-nt loop such as 14/23 and 11/23 form more stable G-quadruplexes (higher Tm, more negative ΔG), whereas loop-isomers with two 2-nt loops such as 14/20 and 11/20 form less stable G-quadruplexes. This is consistent with the previous reports (31, 32), that the stability of a parallel-stranded G-quadruplex is correlated with its total loop length. It is generally considered that the parallel-stranded G-quadruplexes in K+ solution favor short loop lengths, i.e., 1-nt or 2-nt (24, 27, 30–32). Interestingly, our results show that the difference in thermodynamic and kinetic properties of the four loop-isomers, which are the parallel G-quadruplexes with similar short loop lengths, is more significant than previously recognized. At 20 mM [K+], the average difference of the Tm values between the most stable loop-isomer 14/23 and the least stable loop-isomer 11/20 is greater than 10°C, while the ΔΔG37 between the two loop-isomers is about -11 kJ/mol. It is thus suggested that a notable difference exists between 1-nt and 2-nt loops, which may explain the differential contribution of the four loop-isomers to the c-Myc transcriptional control. It is noteworthy that the Tm of the wild-type Myc2345, which is a mixture of four loop-isomers, is only slightly higher than the Tm of 14/23, the most stable loop-isomer (Figure 1A).
Within the two loop-isomers with the same total loop length, 14/23 (T:TA:T) is clearly more stable than 11/23 (TT:A:T), and 14/20 (T:TA:TT) is clearly more stable than 11/20 (TT:A:TT). It has been previously shown that the loop position does not affect the parallel-stranded G-quadruplex stability (31). Thus it is suggested that the stability of the four parallel-stranded c-Myc G-quadruplex loop-isomers is also loop-sequence-dependent, as have been suggested previously (45). While the G-to-T substitutions were used in this study, it would also be interesting to study the effect of other substitutions, such as G-to-A.
For the four loop-isomers with extended flanking segments, the Tm values increased while ΔG37 became more negative as the K+ concentration increased up to 20 mM (Table 2), indicating a clearly enhanced stability. The observation that the ΔG37 values are dependent on the cation concentration has been reported previously (31, 35) and is consistent with the presence of specific ion binding sites in the G-quadruplex. However, when the K+ concentration further increased to 50 mM, although the Tm values still increased, the ΔG37 values did not change much as compared to those at 20 mM [K+]. This phenomenon was also shown by the shape of the CD melting curves, which was less sharp at 50 mM [K+] (Figure 3A). This is likely to be caused by the co-presence of minor conformations, such as different loop conformations of the flanking segments, which can be stabilized by a higher K+ concentration. Generally, coexistence of two conformations gives biphasic melting curves; but if the stability and melting temperatures of the two conformations are close enough, a superimposed melting profile with less sharpness is observed, which gives lower ΔH, and therefore ΔG, values than expected (44). Moreover, as discussed previously (34, 44), if two G-quadruplexes are completely folded at 37°C, then the one with the sharper melting profile may have more negative thermodynamic values at 37 °C even if its melting temperature is lower, as the shape of the melting curves affects the values of ΔH and therefore of ΔG.
We have also examined the effect of the flanking sequences by comparing sequences with extended flanking segments and truncated sequences with only a single thymine at both ends. The difference in Tm values between the truncated and full-flanking sequences is about 2–3°C. Completely truncated sequences without any flanking residues (i.e., start and end with a guanine in a G-run) were prone to the formation of higher-order structures and thus gave unrepeatable results in CD melting studies. Thus it needs to be noted that the true contribution of the capping structures may be greater than what was observed here, as a partial capping effect may still be imparted by the single flanking-T of the truncated sequences. Using the plots of ΔG vs log[K+, the difference in potassium ions bound to folded and unfolded conformations (Δn) can be calculated as previously described (35). Δn values for the four truncated sequences are all about 2, consistent with the three-tetrad c-Myc G-quadruplex structures which contain two coordinated potassium cations. Higher Δn values were shown for the 14/23 and 11/23 sequences with longer flanking segments, but not for the 14/20 and 11/20 sequences (Figure 1A), suggesting an additional potassium ion may be partially retained by the capping conformation formed with the 3'-flanking TAA of 14/23 and 11/23, which has been well-defined in the NMR structure of 14/23 (27). However, the Δn values need to be used with caution, as factors such as the presence of hysteresis or the coexistence of multiple conformations may affect the accurate determination of Δn values.
Kinetic analysis showed that the four c-Myc loop-isomers had clear differences in their kinetic parameters for folding and unfolding processes. The folding process appears to be dominant at the physiologically relevant conditions and temperature. Sequences with one 2-nt loop (14/23 and 11/23) appears to have a markedly lower amount of hysteresis than sequences with two 2-nt loops (14/20 and 11/20) (Figure 4, Table 3). While 11/20 is the slowest in folding, it is also the slowest in the unfolding process. Between the loop-isomers with the same total loop length, 14/23 appears to fold faster than 11/23 based on a more negative activation energy of 14/23, and 14/20 appears to fold faster than 11/20. This result suggests that, for the parallel-stranded loop-isomers with two 1-nt loops and the same total loop length, the folding kinetics is faster for the loop-isomer with both 1-nt loops at the ends vs one in the middle and one at the end. Thus the folding of a parallel-stranded G-quadruplex may start at the two ends, which is favored by the parallel motifs with 1-nt loop at both ends.
In conclusion, we investigated the thermodynamic and kinetic properties of the G-quadruplex loop-isomers that coexist in the nuclease hypersensitive element of the c-Myc promoter. This study may help understand the dynamic equilibrium between the four loop-isomers and the effect of ligand interactions, such as with a small molecule compound or a protein, on the stability and folding kinetics. Our results showed that the differences between G-quadruplexes of similar loop lengths were more significant than previously realized and also suggested that the loop constitution affected the stability of a G-quadruplex. Results also showed that the flanking segments had a clear effect on the stabilization of a G-quadruplex structure.
Supplementary Material
Acknowledgment
We thank Dr. Megan Carver for proofreading the paper.
This research was supported by the National Institutes of Health (1S10 RR16659, CA122952).
Footnotes
Supporting Information Available. ΔG25 values for the c-Myc G-quadruplex loop-isomers, hysteresis between CD melting and annealing curves of 11/20 with a temperature gradient of 0.5 °C/min, the imino regions of 1D 1H NMR spectra of the completely truncated sequences for the four loop-isomers, hysteresis between CD melting and annealing curves of 11/20 and 11/23 loop-isomers with temperature gradients of 2 °C/min and 4 °C/min. This material is available free of charge via the Internet at http://pubs.acs.org.
References
- 1.Spencer CA, Groudine M. Control of C-Myc Regulation in Normal and Neoplastic-Cells. Advances in Cancer Research. 1991;56:1–48. doi: 10.1016/s0065-230x(08)60476-5. [DOI] [PubMed] [Google Scholar]
- 2.Magrath I. The pathogenesis of Burkitt's lymphoma. Advances in Cancer Research. 1990;55:133–270. doi: 10.1016/s0065-230x(08)60470-4. [DOI] [PubMed] [Google Scholar]
- 3.Kinzler KW, Vogelstein B. Lessons from hereditary colorectal cancer. Cell. 1996;87:159–170. doi: 10.1016/s0092-8674(00)81333-1. [DOI] [PubMed] [Google Scholar]
- 4.Berns E, Klijn JGM, Vanputten WLJ, Vanstaveren IL, Portengen H, Foekens JA. C-Myc Amplification Is a Better Prognostic Factor Than Her2/Neu Amplification in Primary Breast-Cancer. Cancer Research. 1992;52:1107–1113. [PubMed] [Google Scholar]
- 5.Pertschuk LP, Feldman JG, Kim DS, Nayeri K, Eisenberg KB, Carter AC, Thelmo WT, Rhong ZT, Benn P, Grossman A. Steroid-Hormone Receptor Immunohistochemistry and Amplification of C-Myc Protooncogene - Relationship to Disease-Free Survival in Breast-Cancer. Cancer. 1993;71:162–171. doi: 10.1002/1097-0142(19930101)71:1<162::aid-cncr2820710126>3.0.co;2-1. [DOI] [PubMed] [Google Scholar]
- 6.Nupponen NN, Kakkola L, Koivisto P, Visakorpi T. Genetic alterations in hormone-refractory recurrent prostate carcinomas. American Journal of Pathology. 1998;153:141–148. doi: 10.1016/S0002-9440(10)65554-X. [DOI] [PMC free article] [PubMed] [Google Scholar]
- 7.Dang CV. c-Myc Target Genes Involved in Cell Growth, Apoptosis, and Metabolism. Molecular and Cellular Biology. 1999;19:1–11. doi: 10.1128/mcb.19.1.1. [DOI] [PMC free article] [PubMed] [Google Scholar]
- 8.Nesbit CE, Tersak JM, Prochownik EV. MYC oncogenes and human neoplastic disease. Oncogene. 1999;18:3004–3016. doi: 10.1038/sj.onc.1202746. [DOI] [PubMed] [Google Scholar]
- 9.Schlagbauer-Wadl H, Griffioen M, van Elsas A, Schrier PI, Pustelnik T, Eichler HG, Wolff K, Pehamberger H, Jansen B. Influence of increased c-Myc expression on the growth characteristics of human melanoma. Journal of Investigative Dermatology. 1999;112:332–336. doi: 10.1046/j.1523-1747.1999.00506.x. [DOI] [PubMed] [Google Scholar]
- 10.Freier K, Joos S, Flechtenmacher C, Devens F, Benner A, Bosch FX, Lichter P, Hofele C. Tissue Microarray Analysis Reveals Site-specific Prevalence of Oncogene Amplifications in Head and Neck Squamous Cell Carcinoma. Cancer Research. 2003;63:1179–1182. [PubMed] [Google Scholar]
- 11.Harris CP, Lu XY, Narayan G, Singh B, Murty V, Rao PH. Comprehensive molecular cytogenetic characterization of cervical cancer cell lines. Genes Chromosomes & Cancer. 2003;36:233–241. doi: 10.1002/gcc.10158. [DOI] [PubMed] [Google Scholar]
- 12.Dallafavera R, Bregni M, Erikson J, Patterson D, Gallo RC, Croce CM. Human C-Myc Onc Gene Is Located on the Region of Chromosome-8 That Is Translocated in Burkitt-Lymphoma Cells. Proceedings of the National Academy of Sciences of the United States of America-Biological Sciences. 1982;79:7824–7827. doi: 10.1073/pnas.79.24.7824. [DOI] [PMC free article] [PubMed] [Google Scholar]
- 13.Taub R, Kirsch I, Morton C, Lenoir G, Swan D, Tronick S, Aaronson S, Leder P. Translocation of the C-Myc Gene into the Immunoglobulin Heavy-Chain Locus in Human Burkitt-Lymphoma and Murine Plasmacytoma Cells. Proceedings of the National Academy of Sciences of the United States of America-Biological Sciences. 1982;79:7837–7841. doi: 10.1073/pnas.79.24.7837. [DOI] [PMC free article] [PubMed] [Google Scholar]
- 14.Nowell P, Finan J, Favera RD, Gallo RC, Arrushdi A, Romanczuk H, Selden JR, Emanuel BS, Rovera G, Croce CM. Association of Amplified Oncogene C-Myc with an Abnormally Banded Chromosome-8 in a Human-Leukemia Cell-Line. Nature. 1983;306:494–497. doi: 10.1038/306494a0. [DOI] [PubMed] [Google Scholar]
- 15.Marcu KB, Bossone SA, Patel AJ. Myc Function and Regulation. Annual Review of Biochemistry. 1992;61:809–860. doi: 10.1146/annurev.bi.61.070192.004113. [DOI] [PubMed] [Google Scholar]
- 16.Marcu KB, Patel AJ, Yang Y. Differential regulation of the c-MYC P1 and P2 promoters in the absence of functional tumor suppressors: Implications for mechanisms of deregulated MYC transcription. C-Myc in B-Cell Neoplasia. 1997:47–56. doi: 10.1007/978-3-642-60801-8_4. [DOI] [PubMed] [Google Scholar]
- 17.Berberich SJ, Postel EH. Puf/Nm23-H2/Ndpk-B Transactivates a Human C-Myc Promoter-Cat Gene Via a Functional Nuclease Hypersensitive Element. Oncogene. 1995;10:2343–2347. [PubMed] [Google Scholar]
- 18.Simonsson T, Pecinka P, Kubista M. DNA tetraplex formation in the control region of c-myc. Nucleic Acids Research. 1998;26:1167–1172. doi: 10.1093/nar/26.5.1167. [DOI] [PMC free article] [PubMed] [Google Scholar]
- 19.Collins I, Weber A, Levens D. Transcriptional Consequences of Topoisomerase Inhibition. Molecular and Cellular Biology. 2001;21:8437–8451. doi: 10.1128/MCB.21.24.8437-8451.2001. [DOI] [PMC free article] [PubMed] [Google Scholar]
- 20.Siddiqui-Jain A, Grand CL, Bearss DJ, Hurley LH. Direct evidence for a G-quadruplex in a promoter region and its targeting with a small molecule to repress c-MYC transcription. Proceedings of the National Academy of Sciences of the United States of America. 2002;99:11593–11598. doi: 10.1073/pnas.182256799. [DOI] [PMC free article] [PubMed] [Google Scholar]
- 21.Hurley LH, Von Hoff DD, Siddiqui-Jain A, Yang D. Drug targeting of the c-MYC promoter to repress gene expression via a G-quadruplex silencer element. Seminars in Oncology. 2006;33:498–512. doi: 10.1053/j.seminoncol.2006.04.012. [DOI] [PubMed] [Google Scholar]
- 22.Yang DZ, Hurley LH. Structure of the biologically relevant G-quadruplex in the c-MYC promoter. Nucleosides Nucleotides Nucleic Acids. 2006;25:951–968. doi: 10.1080/15257770600809913. [DOI] [PubMed] [Google Scholar]
- 23.Ou TM, Lu YJ, Zhang C, Huang ZS, Wang XD, Tan JH, Chen Y, Ma DL, Wong KY, Tang JCO, Chan ASC, Gu LQ. Stabilization of G-quadruplex DNA and down-regulation of oncogene c-myc by quindoline derivatives. Journal of Medicinal Chemistry. 2007;50:1465–1474. doi: 10.1021/jm0610088. [DOI] [PubMed] [Google Scholar]
- 24.Yang D, Okamoto K. Structural insights into G-quadruplexes: towards new anticancer drugs. Future Medicinal Chemistry. 2010;2:619–646. doi: 10.4155/fmc.09.172. [DOI] [PMC free article] [PubMed] [Google Scholar]
- 25.Punchihewa C, Yang D. Therapeutic Targets and Drugs II: G-Quadruplex and G-Quadruplex Inhibitors. In: Hiyama K, editor. Cancer Drug Discovery and Development: Telomeres and Telomerase in Cancer. Humana Press; Totowa, NJ: 2009. pp. 251–280. [Google Scholar]
- 26.Seenisamy J, Rezler EM, Powell TJ, Tye D, Gokhale V, Joshi CS, Siddiqui-Jain A, Hurley LH. The dynamic character of the G-quadruplex element in the c-MYC promoter and modification by TMPyP4. Journal of the American Chemical Society. 2004;126:8702–8709. doi: 10.1021/ja040022b. [DOI] [PubMed] [Google Scholar]
- 27.Ambrus A, Chen D, Dai J, Jones RA, Yang DZ. Solution structure of the biologically relevant G-quadruplex element in the human c-MYC promoter. Implications for G-quadruplex stabilization. Biochemistry. 2005;44:2048–2058. doi: 10.1021/bi048242p. [DOI] [PubMed] [Google Scholar]
- 28.Phan AT, Modi YS, Patel DJ. Propeller-type parallel-stranded G-quadruplexes in the human c-myc promoter. Journal of the American Chemical Society. 2004;126:8710–8716. doi: 10.1021/ja048805k. [DOI] [PMC free article] [PubMed] [Google Scholar]
- 29.Qin Y, Hurley LH. Structures, folding patterns, and functions of intramolecular DNA G-quadruplexes found in eukaryotic promoter regions. Biochimie. 2008;90:1149–1171. doi: 10.1016/j.biochi.2008.02.020. [DOI] [PMC free article] [PubMed] [Google Scholar]
- 30.Dai JX, Dexheimer TS, Chen D, Carver M, Ambrus A, Jones RA, Yang DZ. An intramolecular G-quadruplex structure with mixed parallel/antiparallel G-strands formed in the human BCL-2 promoter region in solution. Journal of the American Chemical Society. 2006;128:1096–1098. doi: 10.1021/ja055636a. [DOI] [PMC free article] [PubMed] [Google Scholar]
- 31.Rachwal PA, Findlow IS, Werner JM, Brown T, Fox KR. Intramolecular DNA quadruplexes with different arrangements of short and long loops. Nucleic Acids Research. 2007;35:4214–4222. doi: 10.1093/nar/gkm316. [DOI] [PMC free article] [PubMed] [Google Scholar]
- 32.Bugaut A, Balasubramanian S. A sequence-independent study of the influence of short loop lengths on the stability and topology of intramolecular DNA G-quadruplexes. Biochemistry. 2008;47:689–697. doi: 10.1021/bi701873c. [DOI] [PMC free article] [PubMed] [Google Scholar]
- 33.Cantor CR, Warshaw MM, Shapiro H. Oligonucleotide Interactions .3. Circular Dichroism Studies of Conformation of Deoxyoligonucleotides. Biopolymers. 1970;9:1059–1077. doi: 10.1002/bip.1970.360090909. [DOI] [PubMed] [Google Scholar]
- 34.Mergny JL, Lacroix L. Analysis of thermal melting curves. Oligonucleotides. 2003;13:515–537. doi: 10.1089/154545703322860825. [DOI] [PubMed] [Google Scholar]
- 35.Jing NJ, Rando RF, Pommier Y, Hogan ME. Ion selective folding of loop domains in a potent anti-HIV oligonucleotide. Biochemistry. 1997;36:12498–12505. doi: 10.1021/bi962798y. [DOI] [PubMed] [Google Scholar]
- 36.Rougee M, Faucon B, Mergny JL, Barcelo F, Giovannangeli C, Garestier T, Helene C. Kinetics and Thermodynamics of Triple-Helix Formation - Effects of Ionic-Strength and Mismatches. Biochemistry. 1992;31:9269–9278. doi: 10.1021/bi00153a021. [DOI] [PubMed] [Google Scholar]
- 37.Brown NM, Rachwal PA, Brown T, Fox KR. Exceptionally slow kinetics of the intramolecular quadruplex formed by the Oxytricha telomeric repeat. Organic & Biomolecular Chemistry. 2005;3:4153–4157. doi: 10.1039/b511706b. [DOI] [PubMed] [Google Scholar]
- 38.Dapic V, Abdomerovic V, Marrington R, Peberdy J, Rodger A, Trent JO, Bates PJ. Biophysical and biological properties of quadruplex oligodeoxyribonucleotides. Nucleic Acids Research. 2003;31:2097–2107. doi: 10.1093/nar/gkg316. [DOI] [PMC free article] [PubMed] [Google Scholar]
- 39.Xu Y, Sato H, Sannohe Y, Shinohara K, Sugiyama H. Stable Lariat Formation Based on a G-Quadruplex Scaffold. Journal of the American Chemical Society. 2008;130:16470–16471. doi: 10.1021/ja806535j. [DOI] [PubMed] [Google Scholar]
- 40.Guo K, Gokhale V, Hurley LH, Sun D. Intramolecularly folded G-quadruplex and i-motif structures in the proximal promoter of the vascular endothelial growth factor gene. Nucleic Acids Research. 2008;36:4598–4608. doi: 10.1093/nar/gkn380. [DOI] [PMC free article] [PubMed] [Google Scholar]
- 41.Skolakova P, Bednarova K, Vorlickova M, Sagi J. Quadruplexes of human telomere dG(3)(TTAG(3))(3) sequences containing guanine abasic sites. Biochemical and Biophysical Research Communications. 2010;399:203–208. doi: 10.1016/j.bbrc.2010.07.055. [DOI] [PubMed] [Google Scholar]
- 42.De Cian A, Guittat L, Kaiser M, Sacca B, Amrane S, Bourdoncle A, Alberti P, Teulade-Fichou MP, Lacroix L, Mergny JL. Fluorescence-based melting assays for studying quadruplex ligands. Methods. 2007;42:183–195. doi: 10.1016/j.ymeth.2006.10.004. [DOI] [PubMed] [Google Scholar]
- 43.Cantor CR, S. PR. Biophysical Chemistry. W. H. Freedman and Company; New York: 1980. [Google Scholar]
- 44.Rachwal PA, Fox KR. Quadruplex melting. Methods. 2007;43:291–301. doi: 10.1016/j.ymeth.2007.05.004. [DOI] [PubMed] [Google Scholar]
- 45.Rachwal PA, Brown T, Fox KR. Sequence effects of single base loops in intramolecular quadruplex DNA. FEBS Letters. 2007;581:1657–1660. doi: 10.1016/j.febslet.2007.03.040. [DOI] [PubMed] [Google Scholar]
Associated Data
This section collects any data citations, data availability statements, or supplementary materials included in this article.