

Abstract
Advanced cerebrovascular β-amyloid deposition (cerebral amyloid angiopathy, CAA) is associated with cerebral microbleeds, but the precise relationship between CAA burden and microbleeds is undefined. We used T2*-weighted MRI and noninvasive amyloid imaging with Pittsburgh Compound B (PiB) to analyze the spatial relationship between CAA and microbleeds. On co-registered PET and MRI images, PiB retention was increased at microbleed sites compared to simulated control lesions (p=0.002) and declined with increasing distance from the microbleed (p<0.0001). These findings indicate that microbleeds occur preferentially in local regions of concentrated amyloid and support therapeutic strategies aimed at reducing vascular amyloid deposition.
Cerebrovascular deposition of β-amyloid (cerebral amyloid angiopathy, CAA) is most commonly recognized during life as a cause of brain hemorrhage. Hemorrhages associated with CAA can be large, symptomatic strokes or small, typically asymptomatic cerebral microbleeds (CMB). CMB are sensitively imaged by T2*-weighted MRI and have been implicated as markers of, and possible contributors to, small vessel-related brain injury.1
Although the link between CAA and CMB is well established,1 the precise mechanism by which vascular amyloid leads to microhemorrhage remains incompletely understood. It is unknown, for example, whether CMB occur preferentially at sites of greatest amyloid deposition. Circumstantial evidence supports this possibility, as both CAA pathology2 and CAA-related CMB3 tend to favor occipital cortex. Further, a recent study suggested that brains with many CAA-related CMB have greater thickness of vascular amyloid than brains with few CMB.3
The current analysis directly addresses the spatial relationship between CMB and vascular amyloid burden using the amyloid-binding radioligand Pittsburgh Compound B (PiB). Previous studies have used PiB as a noninvasive marker of amyloid pathology in Alzheimer disease (AD)4 and CAA.5,6 We reasoned that if CMB are triggered by severe CAA, then PiB retention at CMB sites would be greater than predicted by chance and would decline with increasing distance from the CMB locus.
METHODS
Image Acquisition and Analysis
We performed T2*-weighted MR and PiB-PET imaging on 16 CAA patients (Table 1) recruited at Massachusetts General Hospital.3 All subjects were diagnosed as probable CAA based on the Boston criteria (7 with supporting pathology, 9 by multiple lobar hemorrhages/CMB),7 were nondemented, and free of symptoms suggestive of new stroke for 1 year prior to PiB-PET. PiB was prepared and PET acquisition performed using methods previously described.5 PET data were reconstructed and expressed as a distribution volume ratio (DVR) with cerebellum as reference tissue. Each subject also underwent research T2*-weighted MRI for detection of CMB.
Table 1.
Subject Demographics and Neuroimaging Properties
| Sex, M/F | 10/6 |
| Mean age ± SD, years | 64.0 ± 11.8 |
| Mean MMSE ± SD | 28.6 ± 1.3 |
| Median CMB count (interquartile range) | 4.5 (2, 69.5) |
| Global Cortical PiB, Mean ± SD, DVR | 1.27 ± 0.14 |
| Occipital to Global PiB ratio, Mean ± SD | 0.96 ± 0.06 |
Full details of MRI acquisition, processing, identification of CMB, co-registration of T2*-weighted and PET images (Figures. 1A and B), and scoring of PiB values are provided in the Supplemental Methods. MR imaging was performed at 1.5 Tesla using protocols for gradient-echo (GRE) or susceptibility-weighted imaging (SWI) as described.8 PiB-PET values within a CMB were measured and averaged to provide mean DVR per voxel for each microbleed. PiB-PET values were also measured in five concentric “shells,” each 2 mm in thickness, surrounding each CMB (Figure 1C). To provide an appropriate control comparison for the observed CMB, 200 “simulated” CMB lesions were distributed throughout each subject’s scan space and scored in a manner identical to actual lesions. The simulated lesions were distributed in the subjects' brains according to a centroid probability distribution function (CPDF; see Supplemental Methods and Supplemental Figure 1) derived from 370 hemorrhagic lesions detected by T2*-weighted MRI of 51 subjects with probable CAA.
Figure 1.

Cerebral microbleeds and Pittsburgh Compound B retention. T2*-weighted MRI (panel A) illustrates the characteristic hypointense lesions indicative of CMB. This image is co-registered to a map of PiB-PET Distribution Volume Ratio (panel B); the locations of some CMB are shown by arrows. Changes in PiB signal with increasing distance from the CMB are finally measured in concentric shells (panel C). Note that the shells are truncated at the edges of brain parenchyma to ensure that values were not obtained from non-brain tissue.
To exclude the possibility that PiB directly binds to CMB, we used Prussian blue and PiB6 to stain formalin-fixed brain tissue from three patients with definite CAA-related hemorrhages and three with hemorrhagic lesions from causes other than CAA The locations of Prussian blue-positive microbleeds and PiB fluorescence were compared in adjacent sections and in individual sections double-stained with both agents.
Statistical Analysis
The primary analyses were comparisons of mean PiB-PET DVR values at sites of observed CMB to 1) mean values at sites of simulated CMB, and 2) mean values in concentric shells placed at increasing distances from observed CMB. These analyses were performed with linear mixed effects models to account for within-subject correlations (see Supplemental Methods).
RESULTS
We analyzed PiB-PET DVR values at the sites of 580 CMB identified on co-registered T2*-weighted MRI scans (Figure 1) of 16 nondemented subjects diagnosed with CAA (Table 1). Similar to our previously reported comparisons, CAA subjects demonstrated increased global PiB retention relative to nondemented elderly subjects and elevated occipital-to-global PiB ratio relative to AD subjects.5
Mean (±standard error) DVR at CMB loci was greater than at the sites of simulated lesions placed on scans according to a probability distribution map (1.20±0.04 at observed CMB vs 1.11±0.04 at simulated lesions, p=0.002). We also examined the falloff of PiB retention at increasing distances from CMB loci. Measured in concentric 2 mm shells surrounding each CMB (Figure 1C), PiB DVR declined with increasing distance from the CMB by an average of 0.016±0.001 (p<0.0001) per shell, greater than the marginal falloff around simulated CMB (0.003±0.0005 per shell, p<0.0001 for comparison). When the data were analyzed with a piecewise linear model to allow for different decreases from shell to shell, PiB appeared to decline up to 5 shells (or 10 mm) from the CMB (Figure 2), though the differences between observed and simulated values were significant at the 0.05 level only through shell 2 (4 mm from the CMB).
Figure 2.

PiB retention in concentric shells surrounding cerebral microbleeds. Mean PiB DVR values and standard errors are derived from a piecewise linear mixed effects models (see Methods). DVR declines with increasing distance from the center (p<0.0001) and is significantly greater than the corresponding values for simulated lesions in center (p=0.002), shell 1 (p=0.007), and shell 2 (p=0.03).
Based on the observation that individuals with many CAA-related CMB may have increased vascular amyloid,9 we performed exploratory analysis to evaluate whether the association between PiB retention and CMB applied preferentially to high CMB-count subjects. Among the 5 subjects with more than 10 CMB (accounting for 545 of the total 580 CMB in the analysis), PiB DVR was 0.09±0.028 (p=0.0001) greater at observed than at simulated CMB. Conversely, there was no significant difference in PiB between observed and simulated CMB for the remaining 11 subjects (observed-simulated DVR=0.003±0.085, p=0.9).
To exclude the possibility that increased PiB retention at CMB sites was due simply to direct binding of PiB to blood products in the tissue, we performed PiB labeling of post-mortem brain sections with CAA- and non-CAA-related hemorrhagic lesions (including both CMB and larger intracerebral hemorrhages). PiB labeled plaques and vessels, but showed no association with any of the hemorrhagic lesions (not shown).
DISCUSSION
We report increased PiB retention at the sites of CAA-related CMB. PiB DVR values were elevated at CMB sites and declined with increasing distance. The findings support the possibility that vessel wall breakdown and consequent hemorrhage occur preferentially in local “islands” of increased vascular amyloid. Although the absolute difference in DVR between observed and simulated CMB (1.20 vs 1.11) appears small, it represents nearly a doubling in amount of PiB retention above the expected background DVR value of 1. This difference is also of comparable magnitude to reported differences in global PiB DVR between CAA and normal control (0.14) or between AD and normal control (0.37).5
In testing whether these findings were greater than expected by chance, we chose a null hypothesis in which simulated lesions were placed preferentially in those brain regions (occipital, posterior parietal, posterior temporal; Supplemental Figure 1) favored by actual CAA-related CMB. Differences from this null hypothesis therefore represent specific correlations between CMB and PiB within individual scans rather than a general tendency of CAA to occur in certain brain regions.
Along with CMB, advanced CAA is also associated with white matter lesions,10 increased tissue diffusivity,11 and small cerebral infarction.12 Although these small lesions might appear clinically “silent,” epidemiologic, pathologic, and radiologic data indicate that they can act additively or synergistically with AD pathology to cause cognitive impairment.13,14 The independent contribution of CMB to neurologic dysfunction remains to be determined; some studies point to a possible associations with functional impairment.15, 21
There are several limitations of our study to consider. PiB-PET detects fibrillar amyloid in senile plaques as well as CAA. Since there is no known relationship between plaque amyloid and microbleeding, however, we would expect this effect to act as background noise biasing our results towards the null hypothesis rather than a positive result. A second technical factor is the larger voxel size (i.e. lower spatial resolution) of PET relative to MRI. We would also expect this effect to bias towards a null result, as the large size of the PiB-PET voxels would make it more difficult to detect changing PiB levels in the examined volumes. As our study was cross-sectional, we were unable to determine the cause-effect relationship between increased PiB retention and CMB. The neuropathologic observation that PiB does not label CMB argues, however, that the results do not simply represent nonspecific binding of this agent to blood products. Finally, we note that our results are dominated by the relatively small number of cases with large CMB counts. It is thus unclear whether the results apply to brains with only a few CAA-related CMB.
The implication of our data is that local accumulation of large amounts of vascular amyloid is a necessary step for CAA-related hemorrhage. From this standpoint, the data suggest that strategies to reduce vascular amyloid burdens might be useful for preventing hemorrhage. The results to date from one such strategy—anti-amyloid immunotherapy—have suggested a more complex picture, as both animal and human studies have found instances of increased hemorrhage.16,17 Hemorrhage in association with amyloid immunotherapy may reflect other dynamics besides reduced vascular amyloid burden, including possible transfer of plaque amyloid into vessels.18 or the acute response of amyloid-laden vessels to antibody-mediated clearance.19 A possibility that remains to be tested is whether the long-term result of anti-amyloid immunotherapy would be to reduce vascular amyloid burden and thus diminish the risk of further CAA-related hemorrhage.
Supplementary Material
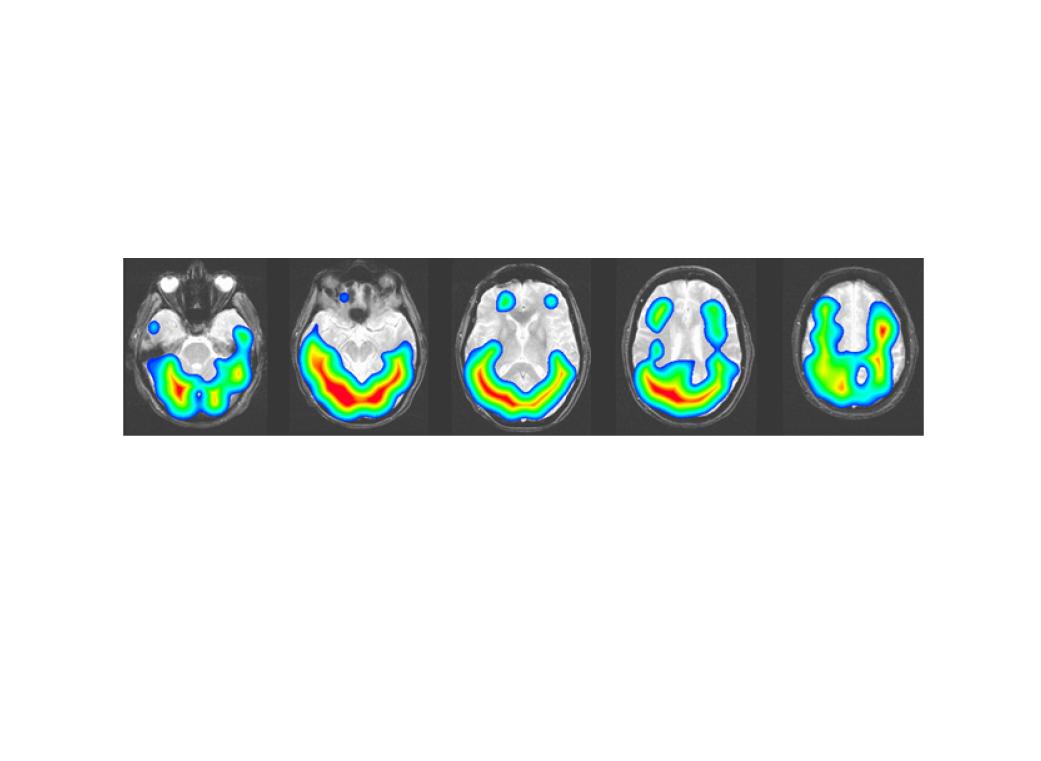
Centroid probability distribution map for cerebral microbleeds related to cerebral amyloid angiopathy. Five representative slices of a template brain are shown with the “Centroid Probability Distribution Function” (CPDF) overlay. Higher colors indicate higher probability of finding a lesion. The CPDF scale has been truncated such that uncolored regions indicate the probability of finding a lesion to be less than 1%.
Acknowledgments
This work was supported by grants from the National Institutes of Health (R01 AG026484) and the Alzheimer’s Association (IIRG-06-26331) and by the Harvard NeuroDiscovery Center (HNDC).
REFERENCES
- 1.Greenberg SM, Vernooij MW, Cordonnier C, et al. Cerebral microbleeds: a guide to detection and interpretation. Lancet Neurol. 2009;8:165–174. doi: 10.1016/S1474-4422(09)70013-4. [DOI] [PMC free article] [PubMed] [Google Scholar]
- 2.Vinters HV, Gilbert JJ. Cerebral amyloid angiopathy: incidence and complications in the aging brain. II. The distribution of amyloid vascular changes. Stroke. 1983;14:924–928. doi: 10.1161/01.str.14.6.924. [DOI] [PubMed] [Google Scholar]
- 3.Rosand J, Muzikansky A, Kumar A, et al. Spatial clustering of hemorrhages in probable cerebral amyloid angiopathy. Ann. Neurol. 2005;58:459–462. doi: 10.1002/ana.20596. [DOI] [PubMed] [Google Scholar]
- 4.Klunk WE, Engler H, Nordberg A, et al. Imaging brain amyloid in Alzheimer's disease with Pittsburgh Compound-B. Ann. Neurol. 2004;55:306–319. doi: 10.1002/ana.20009. [DOI] [PubMed] [Google Scholar]
- 5.Johnson KA, Gregas M, Becker JA, et al. Imaging of amyloid burden and distribution in cerebral amyloid angiopathy. Ann. Neurol. 2007;62:229–234. doi: 10.1002/ana.21164. [DOI] [PubMed] [Google Scholar]
- 6.Greenberg SM, Grabowski T, Gurol ME, et al. Detection of isolated cerebrovascular beta-amyloid with Pittsburgh Compound B. Ann. Neurol. 2008;64:587–591. doi: 10.1002/ana.21528. [DOI] [PMC free article] [PubMed] [Google Scholar]
- 7.Knudsen KA, Rosand J, Karluk D, Greenberg SM. Clinical diagnosis of cerebral amyloid angiopathy: validation of the Boston Criteria. Neurology. 2001;56:537–539. doi: 10.1212/wnl.56.4.537. [DOI] [PubMed] [Google Scholar]
- 8.Nandigam RNK, Viswanathan A, Delgado P, Skehan ME, Smith EE, Rosand J, Greenberg SM, Dickerson BC. MR imaging detection of cerebral microbleeds: effect of susceptibility-weighted imaging, section thickness and field strength. AJNR Am J Neuroradiol. 2009;30:338–343. doi: 10.3174/ajnr.A1355. [DOI] [PMC free article] [PubMed] [Google Scholar]
- 9.Greenberg SM, Nandigam RN, Delgado P, et al. Microbleeds versus macrobleeds: evidence for distinct entities. Stroke. 2009;40:2382–2386. doi: 10.1161/STROKEAHA.109.548974. [DOI] [PMC free article] [PubMed] [Google Scholar]
- 10.Haglund M, Englund E. Cerebral amyloid angiopathy, white matter lesions and Alzheimer encephalopathy - a histopathological assessment. Dement Geriatr Cogn Disord. 2002;14:161–166. doi: 10.1159/000063606. [DOI] [PubMed] [Google Scholar]
- 11.Viswanathan A, Patel P, Rahman R, et al. Tissue microstructural changes are independently associated with cognitive impairment in cerebral amyloid angiopathy. Stroke. 2008;39:1988–1992. doi: 10.1161/STROKEAHA.107.509091. [DOI] [PMC free article] [PubMed] [Google Scholar]
- 12.Soontornniyomkij V, Lynch MD, Mermash S, et al. Cerebral Microinfarcts Associated with Severe Cerebral beta-Amyloid Angiopathy. Brain Pathol. 2009 doi: 10.1111/j.1750-3639.2009.00322.x. [DOI] [PMC free article] [PubMed] [Google Scholar]
- 13.Vermeer SE, Prins ND, den Heijer T, et al. Silent brain infarcts and the risk of dementia and cognitive decline. N. Engl. J. Med. 2003;348:1215–1222. doi: 10.1056/NEJMoa022066. [DOI] [PubMed] [Google Scholar]
- 14.White L, Small BJ, Petrovitch H, et al. Recent clinical-pathologic research on the causes of dementia in late life: update from the Honolulu-Asia Aging Study. J Geriatr Psychiatry Neurol. 2005;18:224–227. doi: 10.1177/0891988705281872. [DOI] [PubMed] [Google Scholar]
- 15.Viswanathan A, Guichard JP, Gschwendtner A, et al. Blood pressure and haemoglobin A1c are associated with microhaemorrhage in CADASIL: a two-centre cohort study. Brain. 2006;129:2375–2383. doi: 10.1093/brain/awl177. [DOI] [PubMed] [Google Scholar]
- 16.Pfeifer M, Boncristiano S, Bondolfi L, et al. Cerebral hemorrhage after passive anti-Abeta immunotherapy. Science. 2002;298:1379. doi: 10.1126/science.1078259. [DOI] [PubMed] [Google Scholar]
- 17.Sperling RA, Salloway S, Fox NC, et al. Risk factors and clinical course associated with vasogenic edema in a phase II trial of bapineuzumab. American Academy of Neurology Annual Meeting; 2009. Abstract S32.001. [Google Scholar]
- 18.Boche D, Zotova E, Weller RO, et al. Consequence of Abeta immunization on the vasculature of human Alzheimer's disease brain. Brain. 2008;131:3299–3310. doi: 10.1093/brain/awn261. [DOI] [PubMed] [Google Scholar]
- 19.Schroeter S, Khan K, Barbour R, et al. Immunotherapy reduces vascular amyloid-beta in PDAPP mice. J. Neurosci. 2008;28:6787–6793. doi: 10.1523/JNEUROSCI.2377-07.2008. [DOI] [PMC free article] [PubMed] [Google Scholar]
- 20.Jenkinson M, Smith S. Optimisation in Robust Linear Registration of Brain Images. Medical Image Analysis. 2001;5:143–156. doi: 10.1016/s1361-8415(01)00036-6. [DOI] [PubMed] [Google Scholar]
- 21.Werring DJ, Frazer DW, Coward LJ, et al. Cognitive dysfunction in patients with cerebral microbleeds on T2*-weighted gradient-echo MRI. Brain. 2004;127:2265–2275. doi: 10.1093/brain/awh253. [DOI] [PubMed] [Google Scholar]
Associated Data
This section collects any data citations, data availability statements, or supplementary materials included in this article.
Supplementary Materials
Centroid probability distribution map for cerebral microbleeds related to cerebral amyloid angiopathy. Five representative slices of a template brain are shown with the “Centroid Probability Distribution Function” (CPDF) overlay. Higher colors indicate higher probability of finding a lesion. The CPDF scale has been truncated such that uncolored regions indicate the probability of finding a lesion to be less than 1%.