Abstract
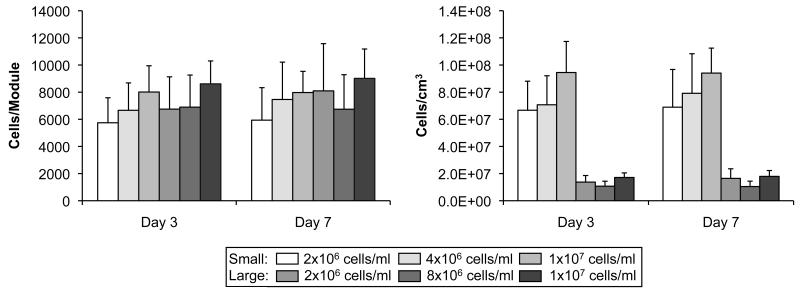
A major obstacle in tissue engineering is overcoming hypoxia in thick, three-dimensional engineered tissues, which is caused by the diffusional limitations of oxygen and lack of internal vasculature to facilitate mass transfer. Modular tissue engineering is a bio-mimetic strategy that forms scalable, vascularized and uniform three-dimensional constructs by assembling small (sub-mm), cell-containing modules. It was previously assumed that mass transfer resistance within the individual modules was negligible, due to their small size. In the present work, this assumption was tested using theoretical analysis of oxygen transport within the module (effectiveness factor) and experimental studies. Small (400μm diameter, post contraction) and large (700μm diameter, post-contraction) HepG2-collagen modules were made for a range of seeding densities (2 × 10⁶ – 1 × 10⁷ cells/ml collagen). Cell density, distribution and morphology within the modules showed that the small modules were capable of sustaining high cell densities (8.0 × 10⁷ ± 4.4 × 10⁷ cells/ cm3) with negligible mass transfer inhibition. Conversely, large modules developed a necrotic core and had significantly (p < 0.05) reduced cell densities (1.5 × 10⁷ ± 9.2 × 10⁶ cells/cm3). It was also observed that the embedded cells responded quickly to the oxygen availability, by proliferating or dying to reach a sustainable density of approximately 8000 cells/module. Furthermore, a simple effectiveness factor calculation was successful in estimating the maximum cell density per module. The results gathered in this study confirm the previous assumption that the small diameter modules avoid the internal mass transfer limitations that are often observed in larger constructs.
1. INTRODUCTION
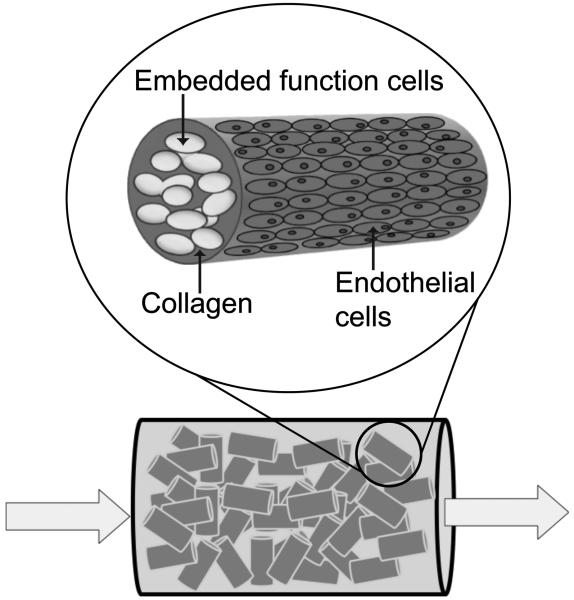
Engineering of thick, three dimensional tissues continues to be limited by the lack of an internal vasculature, which leads to hypoxia and necrosis of cells in the interior of thick tissues. Strategies to address this issue include the incorporation of angiogenic growth factors and/or endothelial cells within the scaffold or the use microfabrication techniques to create a vascular blue-print in the scaffold which can then be seeded with endothelial cells(Kaully et al., 2009). Modular tissue engineering is a bio-mimetic strategy that forms scalable, vascularized and uniform three-dimensional constructs. As implemented, the modules (Figure 1) are sub-mm collagen cylinders (~600 μm in length and 400 μm in diameter) embedded with functional cells and coated with endothelial cells. Randomly packing modules together creates a perfusable construct, where interstitial spaces among the modules form interconnected channels lined with endothelial cells. The modular system has the ability to produce perfusable constructs with high cell densities(McGuigan et al., 2006), indicating that the interconnected channels between packed modules provides sufficient mass transport to prevent overtly hypoxic conditions.
Figure 1.
Modular tissue engineering. Small collagen rods containing embedded functional cells and coated with endothelial cells are randomly packed to form a “packed bed” construct. Interstitial spaces between modules allow the construct to be perfused.
Previous modelling efforts have focused on design constraints of the modular construct, including pressure drop across the construct, shear stress on the endothelial surface layer and oxygen depletion along the axial length of the construct(McGuigan et al., 2007b). The resulting model predicted that for superficial velocities associated with physiological shear stresses and arteriovenous pressure drops, a modular construct should be capable of supporting cell densities of 106 - 107 cells/cm3 (roughly 0.3-3% of normal tissue densities) without suffering necrosis due to hypoxia(McGuigan et al., 2007b). However, a major assumption in this calculation was that mass transfer resistance within the modules themselves was negligible. The present work has focused on testing this assumption using an analysis of oxygen transport within the module and related experimental studies. Module contraction, cell growth and heterogeneous cell distribution complicate the theoretical analysis but support the previous conclusion(McGuigan et al., 2007b) that mass transfer resistance in the modules made previously are negligible.
2. THEORETICAL ANALYSIS
Mass transport within the modules was modeled using the Thiele modulus (the ratio of the rate of reaction and the rate of internal diffusion, ϕ), and the effectiveness factor (the ratio of the actual rate of reaction and the rate of reaction in the absence of internal mass transfer limitations, η). The use of these dimensionless numbers is well-established in the literature for describing transport-reaction kinetics in immobilized cell (Karel et al., 1985; Dalili et al., 1987; Chang et al., 1988; Annesini et al., 2000) and enzyme systems(Do, 1984; Watanabe et al., 2001). Oxygen was selected as the target molecule as it is the primary molecule contributing to cell death due to insufficient mass transfer(Avgoustiniatos et al., 1997). A Thiele modulus expression describing oxygen transport and reaction in immobilized cell aggregates, was based on the work of Karel et al. (1985)(Karel et al., 1985) and the following assumptions: (1) the aggregate is isothermal, (2) mass transfer is governed by Fick’s Law, (3) the aggregate is homogeneous (i.e., a uniform cell distribution), (4) the external transport to the particle is fast (i.e., no external mass transfer resistance), (5) the system is at steady-state, (6) diffusion occurs in only the radial direction and (7) a single molecule (e.g. oxygen) can be studied independently. Further assumptions were made to adapt this model to describe a module: (8) the modules were cylindrical in shape and end-effects were absent, (9) the oxygen uptake rate (OUR) was assumed to be independent of cell density, and (10) only one cell type (i.e. HepG2 cells) was present. These assumptions were used to generate the following Thiele modulus expression:
| (1) |
where ρcell is the cell density (cells/m3), OUR is the oxygen uptake rate per cell (mol O2/cell/sec), dm is the module diameter (m), C* is the molar concentration of oxygen in bulk (mol O2/m3) and Deff is the effective diffusivity of oxygen in the module (m2/sec).
The effectiveness factor equation (equation 2) represents the analytical solution of the effectiveness factor for particles of cylindrical geometry, assuming first-order reaction kinetics(Churchill, 1977).
| (2) |
where I0 and I1 are the modified Bessel functions of the zeroth and first order, respectively. An effectiveness factor of 1.0 represents a system with no mass transfer resistances. For the purposes of this study, it was assumed that mass transfer effects would not be apparent experimentally unless the theoretical effectiveness factor was below 0.9. Consequently, modules with an effectiveness factor of 0.9-1.0 were not expected to show any signs of mass transfer resistance, such as reduced metabolic activity or cell death.
Parameters
Values for the oxygen uptake rate (OUR) of HepG2 cells, the concentration of oxygen in bulk fluid (C*) and the diffusivity constants of oxygen in collagen (Deff(collagen)) were estimated from the literature to be 3.72 × 10⁻¹⁶ mol O2/cell/sec (Rotem et al., 1992; Shatford et al., 1992; Smith et al., 1996), 0.13 mol/m3 (Fournier, 1998) and 2.99 × 10⁻⁵ cm2/sec (Shatford et al., 1992), respectively.
3. MATERIALS AND METHODS
3.1 Cell Culture
Human hepatoma cell line, HepG2 (HB-8065) and human umbilical vein endothelial cell line, HUVEC-C (CRL-1730) were obtained from American Type Culture Collection (American Type Culture Collection, Manassaa, VA, USA). As these cell lines were to be used together, a co-culture medium was prepared by combining the suggested growth medium for HepG2 cells [Eagle’s Minimum essential medium (eMEM), 10% FBS, 1% penicillin-streptomycin] with the HUVEC-C growth medium supplements (ECGS and heparin) suggested by the supplier. HepG2 and HUVEC-C were cultured in 25 mm2 tissue culture flasks in this co-culture medium [eMEM (American Type Culture Collection, Manassas, VA, USA) supplemented with 10% fetal bovine serum (Invitrogen Canada, Burlington, ON), 1% penicillin-streptomycin (Invitrogen Canada, Burlington, ON), 0.03 mg/ml endothelial cell growth supplement (ECGS, BD Biosciences, Mississauga, ON) and 0.01 mg/ml heparin (Heparin LEO, LEO Pharma Inc, Thornhill, ON)] at 37°C in a 5% CO2 humidified air atmosphere. Culture medium was changed every 2-3 days.
3.2 Module Fabrication
Modules containing embedded HepG2 cells were fabricated and then coated with endothelial cells, as described previously(McGuigan et al., 2006; McGuigan et al., 2007a). A collagen solution was prepared by mixing acidified collagen (Type I, bovine dermal, 3.1 mg collagen per ml; Vitrogen, Cohesion technologies, Palo Alto, CA) with 10x minimum essential medium (Invitrogen Canada, Burlington, ON) followed by neutralization using 0.8M NaHCO3. Pelleted HepG2 cells were re-suspended in the neutralized collagen. The suspension was drawn into a gas-sterilized polyethylene tube through the open end by withdrawing the plunger of a 3cc syringe attached to the needle at the opposite end of the tube. The tubing was incubated for 30-45 minutes until the collagen gelled. The tubing was then cut into 2 mm sections using an automated cutter (FCS Technology, London ON). The modules were released from the tubing by vortexing gently in co-culture medium.
Six module fabrication conditions [i.e. initial module diameter and HepG2 seeding density combinations] were selected for experimental analysis based on their theoretical effectiveness factors after contraction (see Results). Modules were made using either 0.762 mm ID-tubing (small modules) or 1.40 mm ID-tubing (large modules) and contained 1 × 10⁶ to 1 × 10⁷ HepG2 cells/ml collagen. Immediately following fabrication, HUVEC-C (7.5 × 10⁵ cells per ml of settled modules) were added to the modules to effect module contraction. The endothelial cells were incubated with modules in a 15 ml centrifuge tube for one hour, while the tube was gently rocked to ensure full coverage. Modules were then transferred to an untreated polystyrene petri dish and placed in a 37°C, 5% CO2 incubator. Medium was changed every 2-3 days. Contraction of the modules by the HUVEC-C occurred within the first 72 hours.
Modules were selected randomly and transferred to a 24-well plate for imaging using an inverted microscope (Zeiss, Axiovert 135) at 2.5x objective magnification. AxioVision, digital imaging software supplied by Zeiss, was used to measure the module lengths and diameters.
3.3 Western Blotting
Western blots probing for the GAPDH housekeeping protein were used to estimate the total number of cells per module (combined HepG2 and HUVEC-C). The rationale for selecting this method is discussed below. On day 3 and 7, sixty modules were transferred to a 1.5 mL Eppendorf tube and centrifuged at 50,000 RPM for 2 minutes and the supernatant was removed. To prepare protein samples for Western blotting, 100 μL of Laemmli sample buffer (Biorad, containing 5% β-Mercaptoethanol) was added to each module sample and the mixtures were heated in a dry bath at 100°C for 5 minutes to lyse cells and solubilise proteins, including collagen gel. After heating, samples were passed through a 23-gauge syringe to further homogenize the modules, which tended to agglomerate. Samples were stored at −20°C until used.
Proteins were separated on 10% SDS-PAGE, transferred to a nitrocellulose membrane (Amersham Hybond-ECL, GE Healthcare) and probed with 1 μg/ml of anti-GAPDH (rabbit) (Santa Cruz Biotechnology, Inc.) in milk for one hour at room temperature. An HRP-conjugated IgG goat-anti-rabbit antibody was used to visualize the blot with ECL reagents. The bands were quantified using a Versadoc 3000 and Quantity 1-D Analysis Software (Bio-Rad Laboratories). Standard curves for each gel were generated using band density (intensity/mm2) for known numbers of HepG2 cells (processed in the same way as module samples) and were used to calculate the number of cells per module.
3.4 Alamar Blue Reduction Assay
On day 3 and 7, ten modules were transferred to a 24 well-plate (in triplicate) in 250 μL of fresh co-culture medium. AlamarBlue™ (AB) (Biosource, Inc, Camarillo, CA) was added to each well, such that the final solution (500 μL) contained 10% AB. Samples were incubated for 4-6 hours. Supernatant samples were transferred to 96-well plates and the absorbances were measured at 570 nm and 600 nm using a Sunrise plate reader. Co-culture medium containing 10% AB was used as the negative control. The reduction of AB was calculated from the absorbances according to supplier instructions.
3.5 Human Albumin ELISA
On day 3 and 7, the rate of albumin secretion from the modules was measured. Ten modules were transferred to a 24 well-plate (in triplicate) in 500 μL of fresh medium. Fresh co-cultured medium was used as a negative control. The plate was incubated for 24 hours, after which samples of supernatant were transferred to 1 ml Eppendorf tubes and stored at 4°C until the albumin concentration was measured using a Human Albumin ELISA Quantitation Kit (Bethyl Laboratories Inc., Texas, USA). The ELISA protocol outlined by the manufacturer was followed. The standard curve was constructed in Statistica 6.1 (StatSoft, Inc, Tulsa, OK, USA) using a three-parameter logistics curve-fit.
3.6 Histology
Large and small modules were fabricated with an initial HepG2 cell density of 8 × 10⁶ cells/ml and were seeded with HUVEC-C as described above. Cell distribution within the modules was assessed using histology and confocal imaging. For histological analysis, modules were fixed in 4% paraformaldehyde, rinsed with PBS and embedded in agar blocks. The blocks were stored in formalin prior to being embedded in paraffin. The paraffin blocks were cut into 4 μm sections and stained with Masson’s trichrome. Cell viability in modules was assessed using a Live/Dead® cell viability assay (Molecular Probes, Invitrogen). Modules were stained according to the supplier’s instruction, rinsed with PBS and imaged immediately using a Zeiss LSM510 Confocal microscope and software (Advanced Optical Microscopy facility, Princess Margaret Hospital, Toronto, Canada).
3.7 Statistics
One-factor or two-factor analysis of variances (ANOVA) were used to analyze the effect of initial module diameter, or module seeding density and initial module diameter, respectively, using α = 0.05. All error bars on graphs represent standard deviation.
4. RESULTS
4.1 Theoretical Analysis
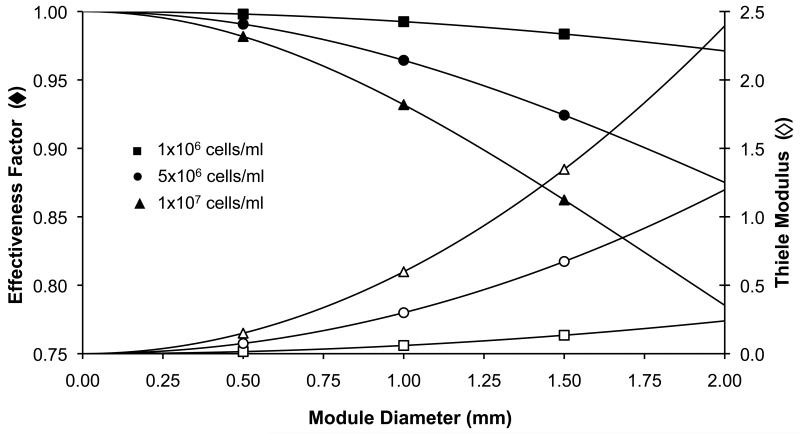
The Thiele modulus and effectiveness factor were used to estimate the theoretical availability of oxygen within the modules with a view to estimating appropriate and attainable conditions for experimental evaluation. For small modules (< 0.5 mm diameter), the effectiveness factor was very high ( > 0.95) and cell density had a negligible effect (Figure 2). As the module diameter increased, the cell density began to affect the effectiveness factor and Thiele modulus to a greater extent and mass transfer limitations appeared to become increasingly severe. For the purpose of this study, it was assumed that the effects of mass transfer inhibition would not be evident in the experimental data for modules with an effectiveness factor above 0.90. Hence and for example, a module with a contracted diameter of 0.40 mm, approximately the size of modules used earlier(McGuigan et al., 2006; McGuigan et al., 2007a), was expected to be able to support a maximum 9.4 × 10⁷ cells/cm3 before experiencing significant intramodule mass transfer resistance (based on the literature oxygen uptake rate, etc).
Figure 2.
Theoretical analysis of Thiele modulus and effectiveness factor for tissue engineering modules. Modules with very small diameters (< 0.40 mm) or very low cell densities (1 × 10⁶ cells/ml) are not expected to experience significant mass transfer limitations (η > 0.9). However, as cell density increases (1 × 10⁷ cells/ml) the negative effect of module diameter on effectiveness factor becomes more pronounced.
4.2 Module fabrication, size and effectiveness factors (based on seeding density)
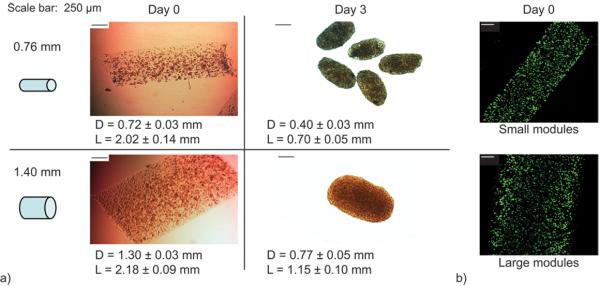
In previous studies, modules were made with 0.76 mm tubing. In order to study the effect of module diameter on diffusional limitations, (i.e. have a η < 0.9), large modules were prepared using 1.40 mm tubing. The latter were indeed larger than the normal small diameter tubing modules when freed from the polyethylene tubing (Figure 3a, day 0) and live cells were distributed uniformly throughout both large and small modules (Figure 3b).
Figure 3.
Module fabrication and contraction. Module contraction occurred during the three days following HUVEC-C seeding. (a) Following contraction (day 3), modules made with 1.40 mm ID-tubing were significantly larger in diameter and length than modules made with 0.76 mm ID-tubing (p < 0.05). (b) Embedded HepG2 cells were uniformly distributed within modules at time of fabrication and retained high viability. [Scale bars are 250 μm, Live cells – green; dead cells – red]
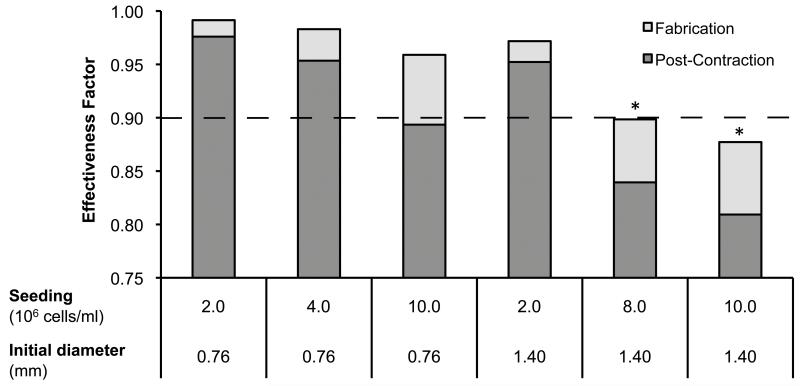
Collagen gel modules containing only HepG2 cells are too soft and weak to be used as is. Hence modules were seeded with HUVEC-C immediately following fabrication, which resulted in the contraction of modules by day 3 (Figure 3a); these modules are more robust and are similar to what we have used in earlier studies(McGuigan et al., 2006). Following contraction, modules made with 0.76 mm tubing were significantly smaller in both diameter and length than modules made with 1.40 mm tubing; modules had been the same length at day 0. Using only the seeding density, the change in volume (i.e. both cell density and diameter) was used to re-calculate the effectiveness factor (Figure 4) for modules post-contraction, assuming no cell proliferation or death had occurred in the 3 days of contraction. This “no change in cell number” assumption was, not surprisingly, proven to be incorrect (see below). Nonetheless this assumption was sufficient to ensure that the selected experimental conditions would highlight conditions under which diffusion limitations should have appeared. From the adjusted effectiveness factor values, it was expected that all the small diameter modules would not show evidence of mass transfer resistance (i.e., their η > 0.9). Only the large modules seeded at 8 × 10⁶ or 1 × 10⁷ cells/ml would be expected to have an η < 0.9, and therefore have a reduced, diffusion limited, cellular metabolism and viability.
Figure 4.
Six module fabrication conditions were selected for experimental analysis. Modules made from either 0.76 mm ID-tubing or 1.40mm ID- tubing were seeded with 2 × 10⁶ to 1 × 10⁷ cells/ml. Following module contraction, two module sets (*) were predicted to experience mass transfer restrictions (i.e. η < 0.9).
4.3 Effect of module diameter on cell density, metabolism and albumin
The total number of cells (HUVEC-C and HepG2 combined) per module was determined from the amount of GAPDH present in a sample of 60 modules. The number of cells per module (based on GAPDH) was similar among all module sets (Figure 5a). However, small modules had significantly higher (p < 0.05) cell densities (cells/cm3) than the large modules when module volumes were taken into account (Figure 5b). Two-way ANOVAs were used to determine if seeding density and module diameter had significant affects on module cell density and cell number. The cell density (cells/cm3) was found to be significantly affected by module size (p < 0.05) but not by seeding density (p > 0.88) on day 3 and day 7 (Figure 5b). Neither module size nor seeding density had a significant effect on the number of cells per module (p > 0.67 and p > 0.90, Figure 5a). It was concluded that the cellular content of the modules (cells/mod and cells/cm3) was independent of the seeding density (p = 0.88). Consequently, the remaining data has been presented as the mean for small and large modules. For example, small modules contained 8.0 × 10⁷ ± 4.4 × 10⁷ cells/cm3 on day 7, while the average density for large modules was 1.5 × 10⁷ ± 9.2 × 10⁶ cells/cm3, independent of the original seeding density.
Figure 5.
(a) The number of cells per module was estimated from the amount of GAPDH per modules, using western blots. No differences were found in the number of cells per module among large and small modules, regardless of cell number and time (p > 0.88) (b) Cell density was calculated from the cell number per module using the module volumes. Small diameter modules had a significantly higher (p < 0.05) cell density compared to large diameter modules, although these were not different from day 3 to day 7. The results are average +/− SD, n = 2.
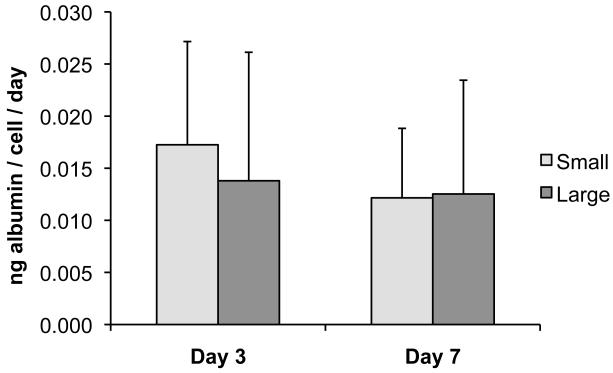
Although large and small modules had similar cell numbers (per module), large modules had significantly higher Alamar blue (AB) reduction rates per module on day 3 and day 7 compared to small modules (p < 0.05) (Figure 6), again combining results by module size and ignoring the small effect of seeding density. The reduction rate per cell was also greater in large modules (p < 0.05) on both days. No significant (p > 0.10) difference was seen in the albumin secretion rates (per cell) of large and small modules at either time point (combining results regardless of seeding density), although there was a high degree of variability among all modules for all time points, as indicated by the relatively large error bars (Figure 7).
Figure 6.
(a) Alamar blue (AB) reduction per module was higher for large modules (p < 0.05), even though according to Figure 5a, there was a similar number of cells in small and large modules. (b) The large modules also had a higher AB reduction rate when normalized on a per cell basis. The results are average +/− SD, regardless of initial seeding density, n =9.
Figure 7.
Albumin secretion from modules was measured using an enzyme-linked immunosorbent assay. No significant difference in secretion rate per cell was seen between large and small modules on day 3 or day 7. The results are average +/− SD, regardless of initial seeding density, n =16.
4.4 Cell distribution, morphology and viability within modules
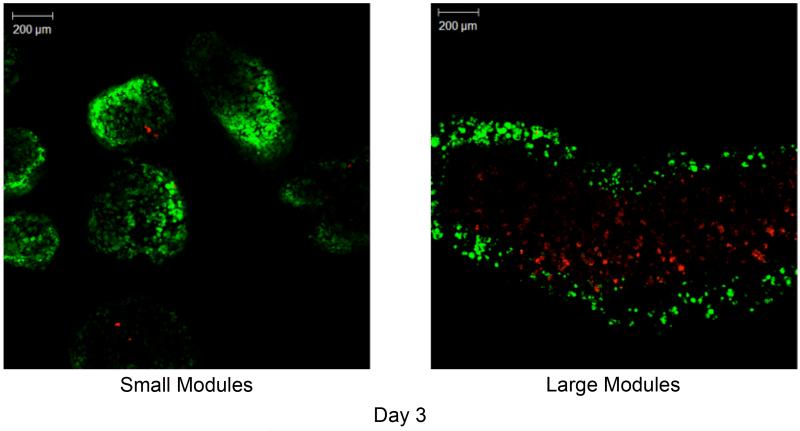
While cells were uniformly distributed in modules on day 0 (Figure 3a), images of modules on day 3 clearly show a core of dead cells in the large modules and a thick band of viable (green) cells along the perimeter of the module (approximately 150-200 μm deep) (Figure 8b). In contrast, the small diameter modules had retained a homogeneous distribution of embedded cells, similar to what was present on day 0, and showed very little cell death (Figure 8a). Dye penetration was not sufficient to determine cell viability in the core of modules on day 7.
Figure 8.
Confocal microscopy images of small (a) and large (b) modules at day 3. At day 3, a large number of dead cells had formed within the core of the large modules (right panel), leaving only a thin rim (~200 μm thick) of viable cells. Conversely, the small modules retained a uniform and high distribution of live cells. [Live– green; dead– red]
Histology sections showed uniformly dispersed embedded cells prior to HUVEC-C seeding for both module sizes (Figure 9). By day 3, the HepG2 cells in the small modules had formed spheroids which were still present and well distributed within the module at day 7. Spheroid formation was also seen in the large modules on day 3; however, it appeared that a smaller percentage of HepG2 cells aggregated to form spheroids and the majority of the cells remained isolated from each other. A large mass of cell debris and voids was visible in the center of the large modules by day 7, indicating the presence of a necrotic core.
Figure 9.
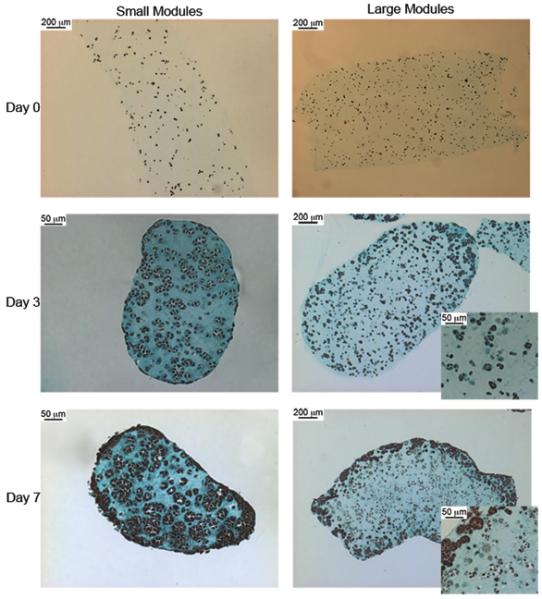
Histology sections of modules stained with Trichrome. Cells are distributed evenly on Day 0 for both large and small modules. On day 3, the cells in the small modules had assembled into spheroids within the module. Some cells in the large modules had also formed spheroids, however many cells did not aggregate and instead remained suspended in the collagen module as single cells. By day 7, many of the cells in the core of the large module appeared to have died, while the edges of the modules are densely populated with spheroids. The entire volume of the small modules are densely populated with HepG2 spheroids at day 7 and do not show the dead core seen in the large modules.
4.5 Effectiveness factor based on actual cell density
Figure 4 was used to calculate effectiveness factors based on initial seeding densities and day 3 experimental volumes on the assumption that there was no change in cell number over these three days. This led to the choice of experimental conditions. Using the experimental cell densities, experimental effectiveness factors were calculated (Table 1) based on the oxygen uptake rate (OUR) of 3.7 × 10⁻¹⁶ mol O2/cell/sec that was based on the reported OUR of hepatocytes and HepG2 cells grown in different configurations(Rotem et al., 1992; Shatford et al., 1992; Smith et al., 1996). The experimental effectiveness factor was surprisingly consistent among all groups, ranging from 0.91 - 0.94.
Table 1.
Effectiveness factors calculated from experimental cell densities and diameters
| Day 3 | Day 7 | |
|---|---|---|
| Small Modules | 0.92 ± 0.01 | 0.91 ± 0.01 |
| Large Modules | 0.94 ± 0.01 | 0.94 ± 0.01 |
5. DISCUSSION
The theoretical and experimental analysis supported the assumption that mass transfer limitations do not pose a major design constraint for modular tissue engineering, as very high cell densities were reached in the small modules without the formation of a necrotic core. As expected, mass transfer became a greater concern both theoretically and experimentally as module diameter increased. More interestingly, it appeared that the cell density and cell distribution within the modules “self-regulates” to accommodate to the available nutrient supply, at least in the system investigated here.
5.1 Experimental protocol
HepG2 cells were selected for study here due to their ease of culture, production of unique, liver-specific markers (e.g. albumin) and high OUR(Hay et al., 2000). These cells were studied previously in modules(McGuigan et al., 2006; McGuigan et al., 2007a; McGuigan et al., 2007b). Additional benefits lie in the extensive literature on bioartificial livers studying HepG2 and hepatocytes in multiple culture configurations, which provide suitable benchmarks for evaluating hepatic activity and cell density. HepG2 were cultured in a co-culture medium because the modules also contained HUVEC-C. In 96 well plate culture, the chosen medium yielded higher metabolic activity for both HepG2 and HUVEC-C (measured by Alamar blue reduction) and higher albumin secretion rates in HepG2 cells (measured by human albumin ELISA) than either normal HepG2 culture medium or normal HUVEC-C culture medium.
The highest seeding density that was useable was 1 × 10⁷ cells/ml. At 1.5 × 10⁷ cells/ml, the modules lacked the necessary structural integrity. This constraint prevented the fabrication of modules with very low theoretical effectiveness factors, even following contraction by endothelial cells. The endothelial layer was not required to reduce the thrombogenicity of the modules(McGuigan et al., 2006; McGuigan et al., 2007a; McGuigan et al., 2007b; McGuigan et al., 2008), rather the HUVEC-C were used to contract the modules to enhance their robustness for experimental study and to enable their comparison to earlier studies using the same 0.762 mm ID tubing for module fabrication.
The total number of cells per module was calculated from the amount of GAPDH present in a sample of 60 modules. Other cell enumeration methods were attempted, including manual cell counting following collagenase digestion of modules, and total DNA quantification following SDS-based module digestion and cell lysis. However, Western blotting was found to produce the most consistent and reproducible results. These other standard means of determining cell number are typically used with larger cell aliquots (and without the contaminating effects of collagen) than we had available.
GAPDH was selected to be the reference protein because its expression is not regulated by hypoxia in HepG2 cells: mRNA and protein GAPDH levels were unchanged in severely hypoxic, normoxic conditions and following reoxygenation(Said et al., 2009). GAPDH is known to be regulated by hypoxia in endothelial cells(Graven et al., 1994); but, this was not expected to impact the results as the endothelial cell were seeded at low density and being at the surface of the modules they were not expected to experience hypoxic conditions. The cell density for small modules (8 × 10⁷ cells/cm3 or about 8000 cells/module) obtained using the GAPDH western blot was consistent with previously reported cell densities (3 – 10 × 107 cells/cm3) for HepG2-collagen modules(McGuigan et al., 2007a). Histology sections of small and large modules stained with CD31 antibody showed only 1-2 positively stained cells per 4 um-thick module section (data not shown), indicating that less than 1% of the 8000 cells/module were endothelial cells. Alpha-tubulin was also considered for the western blot cell enumeration assay, but the modules samples did not contain sufficient amounts of alpha-tubulin to obtain reproducible data (data not shown). It did, however, support the trends seen with GAPDH in which small modules had significantly higher cell densities (but not number per module) than large modules.
5.2 Effect of Module diameter
The small modules, the size normally made(McGuigan et al., 2006), were capable of supporting significantly higher cell densities than large modules, and these high densities were reached rapidly with the majority of the proliferation occurring within the first three days (Figure 5). The cell density (8.0 × 10⁷ ± 4.4 × 10⁷ cells/cm3) of the small modules (ignoring the small fraction of these that are endothelial cells) was higher than hepatocytes or liver cell lines cultured in PMDS-microfluidic devices (4 × 10⁷ cells/cm3)(Leclerc et al., 2004), microcarriers (7 × 10⁶ cells/cm3)(Werner et al., 2000), hollow-fibre bioreactors (2.5 × 10⁷ cells/cm3)(Jasmund et al., 2002) and packed-bed bioreactors (4.8 × 10⁷ cells/cm3)(Fukuda et al., 2003), but was lower than reported values for radial flow bioreactors (1 × 10⁸ cells/cm3 - scaffold)(Hongo et al., 2005). The consistency of albumin secretion per cell among all modules (Figure 7) implies the viable cells within both large and small modules had similar hepatic activity, independent of cell density (ignoring the small fraction of endothelial cells). The average albumin secretion rate (14 μg/106 cell/day) was comparable to those of both primary hepatocytes and HepG2 spheroids reported in literature(Yamashita et al., 2002; Chen et al., 2003; Verma et al., 2007).
Although cell densities were higher with small modules, the number of cells per module were similar (because large modules had a higher volume than small modules). Initially, the HepG2 cells were well-dispersed and within both large and small modules. The HepG2 cells in the small modules proliferated, formed spheroids and remained uniformly distributed, while in the large modules the cell density increased less or not at all (relative to the seeding density) and the core became necrotic (Figures 8 and 9). This dead core is commonly observed with hypoxia-induced necrosis in large tissue engineering constructs and tumors(Carmeliet et al., 2000), and is an excellent example of why vascularized constructs are critical in developing clinically relevant tissues. The shell of viable cells at the surface of the large modules was approximately the same depth as oxygen’s diffusion limit (~200 μm), as expected from literature22. In small modules, whose diameter is ~400 μm, this necrotic core was not seen and by day 7, a highly dense “micro-tissue” was observed.
On the other hand, Alamar blue reduction results (Figure 6) indicate a greater metabolic activity for the cells in larger modules on a per module basis (despite similar cell numbers per module) or per cell basis. Here we presume that a difference in distribution (spheroidal aggregates in small molecules, a viable periphery/necrotic core in large modules) results in phenotypic differences such that metabolic activity is lower in small modules. A similar effect was reported by Cho and Yarmush (2007) who found that hepatocytes in low and medium hepatocytes density co-cultures (with 3T3 fibroblasts) had higher oxygen consumption, albumin synthesis and urea formation rates per cell than hepatocytes cultured at high densities(Cho et al., 2007).
5.3 Theoretical Model
The results from this study highlight the importance of construct thickness when creating engineered tissues. Although three different seeding densities were used for each module diameter when fabricating the modules, only the diameter elicited any obvious effect. Changing the seeding density did not result in different final cell densities. In small diameter modules, where diffusion limitations for the seeding density were not expected (theoretical effectiveness factors were all greater than 0.9 after module contraction) cells grew throughout the module until they reached the apparently maximum permissible cell number (about 8000 cells/module) with a uniform (throughout the module) density of 8 × 10⁷ cells/cm3. That is, the module’s dimensions can enable support for no more than these 8000 metabolically active cells. At this cell density, the calculated effectiveness factor was 0.91 – 0.92 (Table 1, using the estimated oxygen uptake rate of 3.7 × 10⁻¹⁶ mol O2/cell/sec), which may be an upper limit in effectiveness factor. The actual numerical value is dependent on the oxygen uptake rate. Embedded HepG2 cells may have a significantly lower OUR than HepG2 cultured on flat surfaces, perhaps as low as 1.5 × 10⁻¹⁶ mol O2/cell/sec(Mishra et al., 2009). Using this value (and ignoring the small fraction of endothelial cells) would raise the effectiveness factor of the modules to ~ 0.97, close to the value of 1 that would be expected if there were indeed no diffusion limitations.
In larger modules, there were also about the same number of cells per module, as in small modules, but the cells were not distributed uniformly. The viable cells were clustered at the periphery of the module, leaving a necrotic core. When the seeding density was high the module’s dimensions could not support the viability of all the seeded cells and cell density (especially in the core where hypoxia was greatest) decreased to reach the maximum supportable density. As a result the effectiveness factor again became > 0.9 (actually 0.94) although it had been much lower at seeding (Figure 4). It is interesting to note that the effectiveness factors for large and small modules were almost identical, suggesting that the 0.91-0.94 range (for the assumed OUR) is as high as is achievable and that the cells in the module adjust their number (and distribution) to reach this limit, regardless of module diameter and seeding density. Some caution is needed, however, in applying the Thiele modulus/effectiveness calculation for the large modules, since such modules did not have a homogeneous distribution of cells, an assumption within the model. On the other hand, formally taking into account the non-uniform cell distribution is unlikely to have much impact on the estimated effectiveness factor(Do, 1984; Karel et al., 1985).
The simple theoretical model used here was effective as a means of selecting suitable experimental conditions for further study. While this model is limited due to the numerous assumptions and simplistic kinetics used, it was useful for estimating appropriate seeding densities for modules. Had we not used this model, we would not have known what size of module and seeding conditions would likely suffer from diffusion limitations. Using the model it is apparent that under most circumstances there would be no diffusion limitations even without cells growing after seeding. When cells, like HepG2 cells can adjust their cell density to suit their environment, it becomes even harder to make modules that are “too big”. Or rather, “too big” means a necrotic core not too low an effectiveness factor.
6. CONCLUSION
The data gathered from this study clearly demonstrates the ability of the small diameter modules to support high cell densities (8 × 10⁷ cells/cm3) with negligible mass transfer inhibition. This confirms the assumption made previously by our group that these modules avoid the internal mass transfer limitations to which larger constructs fall victim. Furthermore, the maximum cell density per module can be estimated using a simple effectiveness factor calculation based on the oxygen uptake rate of the embedded cell and the module diameter. It was also observed that the cells embedded in the modules quickly responded to oxygen availability, by either proliferating or undergoing necrosis in the module core to reach a sustainable density. The self-regulation of cell density implies that the target cells embedded in modules will proliferate (if capable) to and maintain optimal cell densities, so long as the critical depth of oxygen penetration (~200 μm) is not exceeded.
7. ACKNOWLEDGEMENTS
This work was supported by funding from the Natural Sciences and Engineering Research Council and the US National Institutes of Health (EB 006903) and through an Ontario Graduate Scholarship and National Science and Engineering Council Canadian Graduate Masters Scholarship. The authors would like to thank the Advanced Optical Microscope Facility (AOMF) for the use of their equipment and the Histological Services for Animal Research in the Pathology Research Program at University Health Network (Toronto, Ontario) for the services provided.
8. References
- Annesini MC, Castello G, Conti F, et al. Transport and consumption rate of O2 in alginate gel beads entrapping hepatocytes. Biotechnol Lett. 2000;22(10):865–870. [Google Scholar]
- Avgoustiniatos ES, Colton CK, Lanza RP, Langer R. Design considerations in immunoisolation. In: Chick WL, editor. Principles of Tissue Engineering. Academic Press; Austin TX: 1997. pp. 333–346. [Google Scholar]
- Carmeliet P, Jain RK. Angiogenesis in cancer and other diseases. Nature. 2000;407(6801):249–257. doi: 10.1038/35025220. [DOI] [PubMed] [Google Scholar]
- Chang HN, Moo-Young M. Estimation of oxygen penetration depth in immobilized cells. Appl Microbiol Biotechnol. 1988;29(2-3):107–112. [Google Scholar]
- Chen JP, Yu SC, Hsu BR, et al. Loofa sponge as a scaffold for the culture of human hepatocyte cell line. Biotechnol Prog. 2003;19(2):522–527. doi: 10.1021/bp025720j. [DOI] [PubMed] [Google Scholar]
- Cho CH, Park J, Nagrath D, et al. Oxygen uptake rates and liver-specific functions of hepatocyte and 3T3 fibroblast co-cultures. Biotechnol Bioeng. 2007;97(1):188–199. doi: 10.1002/bit.21225. [DOI] [PubMed] [Google Scholar]
- Churchill SW. A generalized expression for the effectiveness factor of porous catalyst pellets. AIChE J. 1977;23(2):208–210. [Google Scholar]
- Dalili M, Chau PC. Intraparticle diffusional effects in immobilized cell particles. Appl Microbiol Biotechnol. 1987;26(6):500–506. [Google Scholar]
- Do D. Enzyme immobilization in porous solid supports-penetration of immobilized enzyme. Biotechnol Bioeng. 1984;26(9):1032–1937. doi: 10.1002/bit.260260904. [DOI] [PubMed] [Google Scholar]
- Fournier RL. Basic Transport Phenomena in Biomedical Engineering. Taylor & Francis; Philadelphia PA: 1998. [Google Scholar]
- Fukuda J, Okamura K, Nakazawa K, et al. Efficacy of a polyurethane foam/spheroid artificial liver by using human hepatoblastoma cell line (Hep G2) Cell Transplant. 2003;12(1):51–58. doi: 10.3727/000000003783985151. [DOI] [PubMed] [Google Scholar]
- Graven KK, Troxler RF, Kornfeld H, et al. Regulation of endothelial cell glyceraldehyde-3-phosphate dehydrogenase expression by hypoxia. J Biol Chem. 1994;269(39):24446–24453. [PubMed] [Google Scholar]
- Hay PD, Veitch AR, Smith MD, et al. Oxygen transfer in a diffusion-limited hollow fiber bioartificial liver. Artif Organs. 2000;24(4):278–288. doi: 10.1046/j.1525-1594.2000.06499.x. [DOI] [PubMed] [Google Scholar]
- Hongo T, Kajikawa M, Ishida S, et al. Three-dimensional high-density culture of HepG2 cells in a 5-ml radial-flow bioreactor for construction of artificial liver. J Biosci Bioeng. 2005;99(3):237–244. doi: 10.1263/jbb.99.237. [DOI] [PubMed] [Google Scholar]
- Jasmund I, Langsch A, Simmoteit R, et al. Cultivation of primary porcine hepatocytes in an OXY-HFB for use as a bioartificial liver device. Biotechnol Prog. 2002;18(4):839–846. doi: 10.1021/bp025501y. [DOI] [PubMed] [Google Scholar]
- Karel SF, Libicki SB, Robertson CR. The Immobilization of Whole Cells: Engineering Principles. Chemincal Engineering Science. 1985;40:1321–1354. [Google Scholar]
- Kaully T, Kaufman-Francis K, Lesman A, et al. Vascularization-the conduit to viable engineered tissues. Tissue Eng Part B Rev. 2009;15(2):159–169. doi: 10.1089/ten.teb.2008.0193. [DOI] [PubMed] [Google Scholar]
- Leclerc E, Sakai Y, Fujii T. Microfluidic PDMS (polydimethylsiloxane) bioreactor for large-scale culture of hepatocytes. Biotechnol Prog. 2004;20(3):750–755. doi: 10.1021/bp0300568. [DOI] [PubMed] [Google Scholar]
- McGuigan AP, Sefton MV. Vascularized organoid engineered by modular assembly enables blood perfusion. Proc Natl Acad Sci U S A. 2006;103(31):11461–11466. doi: 10.1073/pnas.0602740103. [DOI] [PMC free article] [PubMed] [Google Scholar]
- McGuigan AP, Sefton MV. Design and fabrication of sub-mm-sized modules containing encapsulated cells for modular tissue engineering. Tissue Eng. 2007a;13(5):1069–1078. doi: 10.1089/ten.2006.0253. [DOI] [PubMed] [Google Scholar]
- McGuigan AP, Sefton MV. Design criteria for a modular tissue-engineered construct. Tissue Eng. 2007b;13(5):1079–1089. doi: 10.1089/ten.2006.0245. [DOI] [PubMed] [Google Scholar]
- McGuigan AP, Sefton MV. The thrombogenicity of human umbilical vein endothelial cell seeded collagen modules. Biomaterials. 2008 doi: 10.1016/j.biomaterials.2008.02.010. [DOI] [PMC free article] [PubMed] [Google Scholar]
- Mishra A, Starly B. Real time in vitro measurement of oxygen uptake rates for HEPG2 liver cells encapsulated in alginate matrices. Microfluid Nanofluidics. 2009;6 [Google Scholar]
- Rotem A, Toner M, Tompkins RG, et al. Oxygen Uptake Rates in Cultured Rat Hepatocytes. Biotechnol Bioeng. 1992;40:1286–1291. doi: 10.1002/bit.260401020. [DOI] [PubMed] [Google Scholar]
- Said HM, Polat B, Hagemann C, et al. Absence of GAPDH regulation in tumor-cells of different origin under hypoxic conditions in - vitro. BMC Res Notes. 2009;2:8. doi: 10.1186/1756-0500-2-8. [DOI] [PMC free article] [PubMed] [Google Scholar]
- Shatford RA, Nyberg SL, Meier SJ, et al. Hepatocyte function in a hollow fibre bioreactor: a potential bioartificial liver. J Surg Res. 1992;53(6):549–557. doi: 10.1016/0022-4804(92)90253-v. [DOI] [PubMed] [Google Scholar]
- Smith MD, Smirthwaite AD, Cairns DE, et al. Techniques for measurement of oxygen consumption rates of hepatocytes during attachment and post-attachment. Int J Artif Organs. 1996;19(1):36–44. [PubMed] [Google Scholar]
- Verma P, Verma V, Ray P, et al. Formation and characterization of three dimensional human hepatocyte cell line spheroids on chitosan matrix for in vitro tissue engineering applications. In Vitro Cell Dev Biol Anim. 2007;43(10):328–337. doi: 10.1007/s11626-007-9045-1. [DOI] [PubMed] [Google Scholar]
- Watanabe H, Matsuyama T, Yamamoto H. Preparation of immobilized enzyme gel particles using an electrostatic atomization technique. Biochem Eng J. 2001;8(2):171–174. [Google Scholar]
- Werner A, Duvar S, Muthing J, et al. Cultivation of immortalized human hepatocytes HepZ on macroporous CultiSpher G microcarriers. Biotechnol Bioeng. 2000;68(1):59–70. doi: 10.1002/(sici)1097-0290(20000405)68:1<59::aid-bit7>3.0.co;2-n. [DOI] [PubMed] [Google Scholar]
- Yamashita Y, Shimada M, Ijima H, et al. Hybrid-artificial liver support system. Surgery. 2002;131(1 Suppl):S334–S340. doi: 10.1067/msy.2002.120118. [DOI] [PubMed] [Google Scholar]


