

Abstract
Diffusion tensor imaging (DTI) is important for characterizing the structure of white matter fiber bundles as well as detailed tissue properties along these fiber bundles in vivo. There has been extensive interest in the analysis of diffusion properties measured along fiber tracts as a function of age, diagnostic status, and gender, while controlling for other clinical variables. However, the existing methods have several limitations including the independent analysis of diffusion properties, a lack of method for accounting for multiple covariates, and a lack of formal statistical inference, such as estimation theory and hypothesis testing. This paper presents a statistical framework, called VCMTS, to specifically address these limitations. The VCMTS framework consists of four integrated components: a varying coefficient model for characterizing the association between fiber bundle diffusion properties and a set of covariates, the local polynomial kernel method for estimating smoothed multiple diffusion properties along individual fiber bundles, global and local test statistics for testing hypotheses of interest along fiber tracts, and a resampling method for approximating the p–value of the global test statistic. The proposed methodology is applied to characterizing the development of four diffusion properties along the splenium and genu of the corpus callosum tract in a study of neurodevelopment in healthy rhesus monkeys. Significant time effects on the four diffusion properties were found.
1 Introduction
In the existing literature, there are three major approaches to the group analysis of diffusion imaging data including region-of-interest (ROI) analysis, voxel-wise analysis, and fiber tract based analysis [1], [2], [3]. The region-of-interest (ROI) method primarily computes averages diffusion properties in some manually drawn ROIs, generates various summary statistics per ROI, and then carries out statistical analysis on these summary statistics [3]. ROI analysis suffers from identifying meaningful ROIs, particularly the long curved structures common in fiber tracts, the instability of statistical results obtained from ROI analysis, and the partial volume effect in relative large ROIs.
Compared with the other two methods, voxel-wise analysis has been widely used in neuroimaging studies [4]. The voxel-wise analysis involves two sequential steps. The first step is to fit a statistical model to diffusion properties at each voxel and generating a parametric map of test statistics (or p–values). The second step includes a correction to the multiple comparisons across the many voxels of imaging volume [5]. However, the voxel-wise analysis suffers from the issues of misalignment and arbitrary smoothing extent [6], [7]. As pointed out in [7], the final statistical results of voxel-wise analysis can strongly depend on the amount of smoothing applied to the diffusion tensor imaging data.
The third method is to develop fiber tract based analysis of diffusion properties, such as eigenvalues and fractional anisotropy (FA) values [1], [2], [8], [9]. In [1], a tract-based spatial statistics framework is proposed to carry out a point-wise analysis along the white matter skeleton. In [8], a model-based framework is developed for the analysis of diffusion properties on the medial manifolds of fiber tracts followed by testing pointwise hypotheses on the medial manifolds. In [9], a functional principal component analysis (PCA) is used to compare a univariate diffusion property, such as fractional anisotropy, across two (or more) populations for a single hypothesis test per tract [9]. Furthermore, in [10], a constrained PCA method is proposed to fit age-related changes white matter diffusion of fiber tracts. The functional and constrained PCA methods suffer from the issues of the independent analysis of diffusion properties, a lack of method for accounting for multiple covariates, and a lack of formal statistical inference, such as estimation theory and hypothesis testing. In [11], a functional regression framework, called FRATS, is proposed for the analysis of multiple diffusion properties along fiber bundle as functions and their association with a set of covariates of interest in real applications.
The goal of this paper is to develop a multivariate varying coefficient model framework, called VCMTS, to completely address the issues of the functional and constrained PCA. Compared with the existing literature including [10], [11], and [9], we have made several novel contributions. We develop a multivariate varying coefficient model to statistically characterize the association between multiple fiber bundle diffusion properties and a set of covariates of interest. We use the local polynomial kernel method to regularize multiple diffusion properties along individual fiber bundles. We propose both local and global test statistics for testing hypothesis of interest along and on fiber tracts. We approximate the p–value of the global test statistic using a resampling method.
2 Method
A schematic overview of VCMTS is given in Figure 1. We have proven that each component of VCMTS is statistically sound under some mild conditions and the detailed proof can be found in [12]. The associated software for implementing VCMTS will be available in https://bios.unc.edu/~hzhu/ and disseminated to imaging researchers through http://www.nitrc.org/. We describe each of these components in detail below.
Fig. 1.
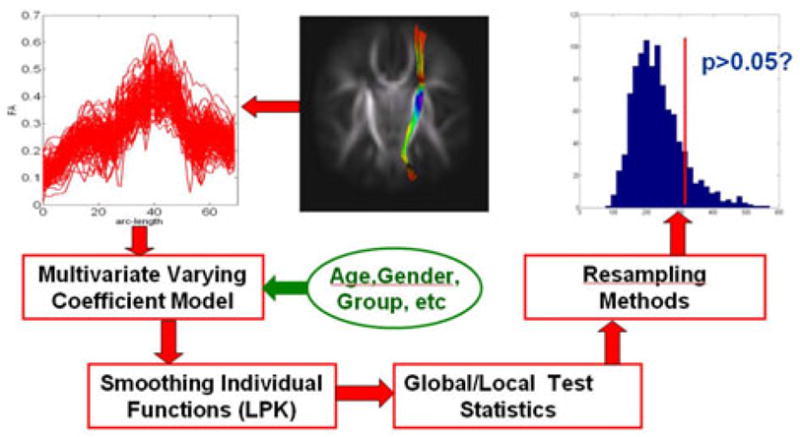
A schematic overview of VCMTS, in which the right internal capsule tract is used as an illustration
2.1 Multivariate Varying Coefficient Model
We develop a multivariate varying coefficient model to characterize the relationship between multiple diffusion properties along fiber tracts and a set of covariates of interest, such as age, group status, and gender. For the i-th subject, we consider an m × 1 vector of diffusion properties, denoted by yi(sj) = (yi,1(sj), ···, yi,m(sj))T, and its associated arc length sj for the j-th location grid point on the fiber bundle for j = 1, ···, nG and i = 1, ···, n, where nG and n denote the numbers of grid points and subjects, respectively. We assume that
| (1) |
where Bk (s) = (bk1(s), ···, bkp(s))T is a p × 1 vector of functions of s, xi is a p × 1 vector of covariates of interest, εi,k (s) are measurement errors and ηi,k (s) characterize individual curve variations from . The varying coefficient matrix B(s) = [B1(s), ···, Bm(s)] characterizes the association between fiber bundle diffusion properties and the covariates of interest xi. Model (1) is a multivariate varying coefficient model [13]. Let SP(μ, Σ) denote a stochastic process vector with mean function μ(t) and covariance function Σ(s, t). We assume that εi(s) = (εi,1(s), ···, εi,m(s))T and ηi(s) = (ηi,1(s), ···, ηi,m(s))T are independent, and ηi(s) and εi(s) are independent and identical copies of SP(0, Ση) and SP(0, Σε), respectively. Moreover, εi(s) and εi(s′) are assumed to be independent and thus Σε (s, t) takes the form of Σε (s, s)1(s = t), where 1(·) is an indicator function. Finally, the covariance structure of yi(s), denoted by Σy (s, t), takes the form of Σy (s, t) = Cov(yi (s), yi(t)) = Ση (s, t) + Σε (s, s)1(s = t).
As an illustration, in our clinical study on early rhesus monkey brain development, we are interested in studying the evolution of the three eigenvalues λi of diffusion tensor (λ1 ≥ λ2 ≥ λ3) along two selected fiber tracts in 24 healthy rhesus monkeys (Fig. 2(a)–(c)). See clinical data for details. We consider a model of λ1 and λ(2,3) = (λ2 + λ3)/2 along a specific tract as follows:
| (2) |
where λi,k are the three eigenvalues the i-th subject for k = 1, 2, 3, and gi and agei denote gender and age, respectively. In this case, m = 2, B(s) = (βjk (s)) is a 2 × 4 matrix, and . It is trivial to extend model (2) to other nonlinear and nonparametric functions of age [13].
Fig. 2.
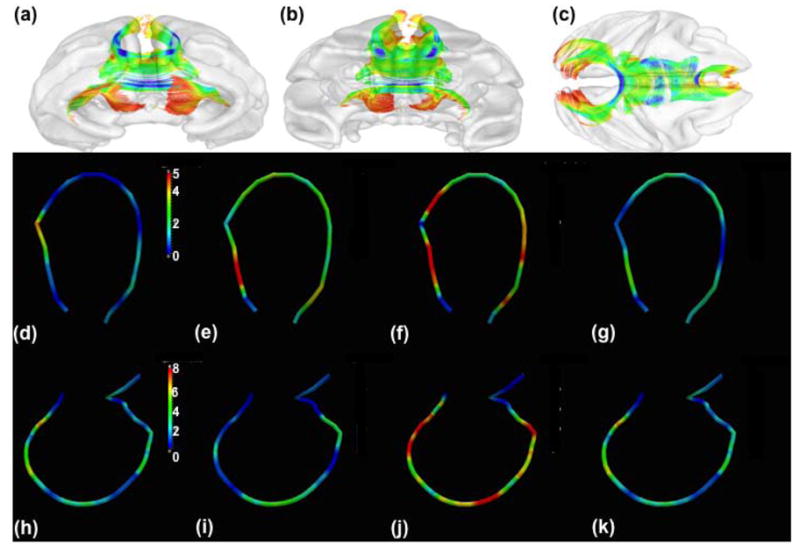
Results from a study of neurodevelopment in healthy rhesus monkeys: panels (a)–(c): (a) anterior, (b) posterior, and (c) superior views of corpus callosum tracts; panels (d)–(g): −log10(p)–values of Sn(sj ) for testing time effect in the genu tract: (d) λ1, (e) λ(2,3), (f) FA, (g) MD; panels (h)–(k): −log10(p)–values of Sn(sj ) for testing time effect in the splenium tract: (d) λ1, (e) λ(2,3), (f) FA, (g) MD
To estimate the coefficient functions in B(s), we develop an adaptive local polynomial kernel smoothing technique [14], whereas it is possible to use spline type of methods including B-spline and smoothing spline. Specifically, using Taylor’s expansion, we can expand Bk (sj) at s to obtain Bk (sj) = Bk (s)+Ḃk (s)(sj −s) = Ak (s)zhnG,k (sj − s), where zhnG,k (sj − s) = (1, (sj − s)/hnG,k)T and Ak (s) = [Bk (s), hnG,k Ḃk (s)] is a p × 2 matrix, in which Ḃk (s) = (ḃk1(s), ···, ḃkp(s)) is a p × 1 vector and ḃkl(s) = dbkl(s)/ds for l = 1, ···, p. We calculate a weighted least squares estimate of Ak (s) as follows. Let K(·) be a kernel function, such as the Gaussian and uniform kernels [14]. For a fixed bandwidth h and each k, we estimate Ak (s) by minimizing an objective function given by
| (3) |
where KhnG,k (·) = K(·/hnG,k)/hnG,k is a rescaled kernel function. For each k, we pool the data from all n subjects and select an optimal bandwidth hnG,k, denoted by , by minimizing the cross-validation score. Based on , we can obtain an estimate of Bk(s), denoted by B̂k,o(s).
2.2 Smoothing Individual Functions and Covariance Estimating
To simultaneously construct all individual functions ηi,k (s), we also employ the local polynomial kernel smoothing technique [14]. Specifically, using Taylor’s expansion, we can expand ηi,k (sj) at s to obtain , where is a 2 × 1 vector. We develop an algorithm to estimate di,k (s) as follows. For each k and a fixed bandwidth , we estimate di,k (s) by minimizing an objective function given by
| (4) |
For each k, we pool the data from all n subjects and select the optimal bandwidth hnG, k, denoted by , by minimizing the generalized cross-validation score. Based on , we can estimate ηi,k (s) and ηi(s), denoted by η̂i,ko (s) and η̂i,o (s), respectively, for all i and k.
After obtaining η̂i,o(s), we can estimate the mean function η(s) and the covariance function Ση (s, t) of ηi(s). Specifically, we estimate η(s) and Ση (s, t) by using their empirical counterparts of the estimated η̂i,o(s) as follows: and .
We construct a nonparametric estimator of the covariance matrix Σε (s, s) as follows. Let B̂o(s) = [B̂1,o(s), ···, B̂m,o(s)] and ε̂i(sj) = yi(sj) − B̂o(sj)T xi − η̂i,o(sj) be estimated residuals for i = 1, ···, n and j = 1, ···, nG. We consider an estimate of Σε (s, s) given by , where . To select the optimal bandwidth h(3), denoted by , we minimize the cross-validation score. Based on , we can estimate Σε (s, s), denoted by Σεo(s, s).
2.3 Test Statistics and Resampling Method
In neuroimaging studies, most scientific questions require the comparison of fiber bundle diffusion properties along fiber bundles across two (or more) diagnostic groups and the assessment of the development of fiber bundle diffusion properties along time. Such questions can often be formulated as linear hypotheses of B(s) as follows: H0: Cvec(B(s)) = b0(s) for all s vs. H1: Cvec(B(s)) ≠ b0(s), where C is a r ×mp matrix of full row rank and b0(s) is a given r ×1 vector of functions. We propose both local and global test statistics. The local test statistic can identify the exact location of significant grid point on a specific tract. At a given grid point sj on a specific tract, we test the local null hypothesis H0(sj): Cvec(B(sj)) = b0(sj) using a local test statistic , where and d(s) = Cvec(B̂o(s) − b0(s)). We test the null hypothesis H0: Cvec(B(s)) = b0(s) for all s using a global test statistic , where L0 is the whole arc length of a specific fiber bundle. In order to use Sn as a test statistic, we can show that Sn has appropriate asymptotic distribution as n → ∞. We develop a resampling method (or wild bootstrap method) to approximate the p-value of Sn. The key ideas are to fit model (1) under the null hypothesis H0, which yields and for i = 1, ···, n and j = 1, ···, nG, and then to generate random samples from the fitted model in order to approximate the null distribution of Sn.
3 Results
Clinical Data
Twenty four healthy rhesus monkeys (male and female included) at the Harlow Primate Laboratory with age between 10 to 72 months were scanned on a 3 Tesla GE scanner (SIGNA Excite) with a high-resolution 3DSPGR sequence (0.2344 × 0.2344 × 0.4980mm3), a T2-weighted spin-echo sequence (0.2344 × 0.2344 × 1.5mm3) and a 12-direction diffusion-weighted EPI sequence (0.5469×0.5469×2.5mm3). After DTI estimation, a nonlinear fluid deformation based high-dimensional, unbiased atlas computation method was used to carry out a large deformation non-linear registration [15]. Detailed information regarding the DTI atlas building procedure has been described in [9]. Major fiber bundles are tracked in the atlas space within 3D Slicer (www.slicer.org). With the fiber bundles in atlas space, each subject’s DTI data is transformed into the atlas space. For each subject at a given time point, the data within the fiber bundle is parameterized as a sampled function of equidistance steps along the fiber. The result of the procedure is thus a set of corresponding sampled functions, including FA, MD, etc. parameterized by arc length from the atlas fiber tract for each individual subject using invert of the atlas-building transformation. These sampled functions at each point along the fiber tract were then used to study the effect of age, gender and other covariates on neural development.
For the sake of space, we chose two tracts of interest including the splenium and genu of the corpus callosum tract and then computed fractional anistropy (FA), mean diffusivity (MD), and λ1 and λ(2,3) of diffusion tensors at each grid point on both tracts for each of the 24 monkeys. FA denotes the inhomogeneous extent of local barriers to water diffusion, while MD measures the averaged magnitude of local water diffusion. The three eigenvalues of diffusion tensor may, respectively, reflect the magnitude of water diffusivity along and perpendicular to the long axis of white matter fibers [16].
We applied VCMTS to the joint analysis of λ1, λ(2,3), FA, and MD values along the splenium tract as follows. We fitted the functional linear model (2) to these four diffusion properties from all 24 subjects, in which and m = 2, and then we estimated the function of regression coefficient vector B̂(s). Secondly, we constructed the global test statistic Sn to test the effects of all the age effect for each of the four diffusion properties, and performed hypothesis testing on the whole splenium and genu tracts. The p-value of Sn was approximated using the resampling method with G = 10, 000.
We considered the genu tract and performed hypothesis testing on time effect for the whole tract. The p–values of Sn corresponding to λ1, λ(2,3), FA, and MD equal 0.31, 0.19, 0.007, and 0.29, respectively. This indicates a significant change of the degrees of anisotropy, not the degree of diffusivity, along the genu tract. We further performed hypothesis testing at each grid point along the splenium tract (Figs. 2). For λ1, λ(2,3), and MD, no significant effect of time effect was found, even though the −log10(p) values of Sn(s) for age at several single grid points were slightly greater than 2 (Fig. 2(d), (e), (g)). For FA alone, the effects of time were significant in the middle and tail of the genu tract (Fig. 2(f)).
We considered the splenium tract and performed hypothesis testing on time effect for the whole tract. The p–values of Sn corresponding to λ1, λ(2,3), FA, and MD equal 0.001, 0.002, 0.000, and 0.004, respectively. This indicates a significant change of the degrees of diffusivity and anisotropy, along the splenium tract. We further performed hypothesis testing at each grid point along the splenium tract (Fig. 2(h)–(k)). For all diffusion properties, the effects of time were significant in most of grid points along the splenium tract (Fig. 2(h)–(k)).
4 Discussion
We have developed VCMTS for statistically analyzing multiple diffusion properties along fiber bundle and assessing their association with a set of covariates in real applications. The proposed methodology is demonstrated in a study of neurodevelopment in rhesus monkey. Significant time effect on multiple diffusion properties were examined and localized in two representative tracts. VCMTS is able to delineate the complex inhomogeneous spatial-temporal maturation patterns as the apparent changes in FA, MD, and the eigenvalues of diffusion tensors. Specifically, our results suggest that white matter maturation patterns are different in different white matter regions. We expect that this novel statistical tool will lead to new findings in our clinical applications.
Footnotes
This work was supported in part by NSF grant BCS-08-26844 and NIH grants UL1-RR025747-01, MH086633, P01CA142538-01 and AG033387 to Dr. Zhu, NIH grants MH064065, HD053000, and MH070890 to Dr. Gilmore, NIH grants R01NS055754 and R01EB5-34816 to Dr. Lin, Lilly Research Laboratories, the UNC NDRC HD 03110, Eli Lilly grant F1D-MC-X252, and NIH Roadmap Grant U54 EB005149-01, NAMIC to Dr. Styner.
References
- 1.Smith SM, Jenkinson M, Johansen-Berg H, Rueckert D, Nichols TE, Mackay CE, Watkins KE, Ciccarelli O, Cader M, Matthews P, Behrens TE. Tractbased spatial statistics: voxelwise analysis of multi-subject diffusion data. NeuroImage. 2006;31:1487–1505. doi: 10.1016/j.neuroimage.2006.02.024. [DOI] [PubMed] [Google Scholar]
- 2.O’Donell LJ, Westin CF, Golby AJ. Tract-based morphometry for white matter group analysis. NeuroImage. 2009;45:832–844. doi: 10.1016/j.neuroimage.2008.12.023. [DOI] [PMC free article] [PubMed] [Google Scholar]
- 3.Snook L, Plewes C, Beaulieu C. Voxel based versus region of interest analysis in diffusion tensor imaging of neurodevelopment. NeuroImage. 2007;34:243–252. doi: 10.1016/j.neuroimage.2006.07.021. [DOI] [PubMed] [Google Scholar]
- 4.Snook L, Paulson LA, Roy D, Phillips L, Beaulieu C. Diffusion tensor imaging of neurodevelopment in children and young adults. NeuroImage. 2005;26:1164–1173. doi: 10.1016/j.neuroimage.2005.03.016. [DOI] [PubMed] [Google Scholar]
- 5.Worsley KJ, Taylor JE, Tomaiuolo F, Lerch J. Unified univariate and multivariate random field theory. Neuroimage. 2004;23:189–195. doi: 10.1016/j.neuroimage.2004.07.026. [DOI] [PubMed] [Google Scholar]
- 6.Hecke WV, Sijbers J, Backer SD, Poot D, Parizel PM, Leemans A. On the construction of a ground truth framework for evaluating voxel-based diffusion tensor mri analysis methods. NeuroImage. 2009;46:692–707. doi: 10.1016/j.neuroimage.2009.02.032. [DOI] [PubMed] [Google Scholar]
- 7.Jones DK, Symms MR, Cercignani M, Howard RJ. The effect of filter size on vbm analyses of dt-mri data. NeuroImage. 2005;26:546–554. doi: 10.1016/j.neuroimage.2005.02.013. [DOI] [PubMed] [Google Scholar]
- 8.Yushkevich PA, Zhang H, Simon T, Gee JC. Structure-specific statistical mapping ofwhite matter tracts. Neuroimage. 2008;41:448–461. doi: 10.1016/j.neuroimage.2008.01.013. [DOI] [PMC free article] [PubMed] [Google Scholar]
- 9.Goodlett CB, Fletcher PT, Gilmore JH, Gerig G. Group analysis of dti fiber tract statistics with application to neurodevelopment. NeuroImage. 2009;45:S133–S142. doi: 10.1016/j.neuroimage.2008.10.060. [DOI] [PMC free article] [PubMed] [Google Scholar]
- 10.Gouttard S, Prastawa M, Bullitt E, Lin WL, Goodlett C, Gerig G. Constrained data decomposition and regression for analyzing healthy aging from fiber tract diffusion properties. In: Yang G-Z, Hawkes D, Rueckert D, Noble A, Taylor C, editors. MICCAI 2009. LNCS. Vol. 5761. Springer; Heidelberg: 2009. pp. 321–328. [DOI] [PMC free article] [PubMed] [Google Scholar]
- 11.Zhu HT, Styner M, Tang NS, Liu ZX, Lin WL, Gilmore J. Frats: Functional regression analysis of dti tract statistics. IEEE Transactions on Medical Imaging. 2010;29:1039–1049. doi: 10.1109/TMI.2010.2040625. [DOI] [PMC free article] [PubMed] [Google Scholar]
- 12.Zhu HT, Li RZ, Kong LN, Styner M, Gilmore J. Technical report. University of the North Carolina; 2010. Multivariate varying coefficient models with applications for dti tract statistics. [DOI] [PMC free article] [PubMed] [Google Scholar]
- 13.Fan J, Zhang W. Statistical methods with varying coefficient models. Statistics and Its Interface. 2008;2 doi: 10.4310/sii.2008.v1.n1.a15. [DOI] [PMC free article] [PubMed] [Google Scholar]
- 14.Fan J, Gijbels I. Local Polynomial Modelling and Its Applications. Chapman and Hall; London: 1996. [Google Scholar]
- 15.Joshi S, Davis B, Jomier M, Gerig G. Unbiased diffeomorphic atlas construction for computational anatomy. Neuroimage. 2004;23:S151–S160. doi: 10.1016/j.neuroimage.2004.07.068. [DOI] [PubMed] [Google Scholar]
- 16.Song SK, Sun SW, Ju WK, Lin SJ, Cross AH, Neufeld AH. Diffusion tensor imaging detects and differentiates axon and myelin degeneration in mouse optic nerve after retinal ischemia. Neuroimage. 2003;20:1714–1722. doi: 10.1016/j.neuroimage.2003.07.005. [DOI] [PubMed] [Google Scholar]