

Abstract
Measurement of changes in brain cortical thickness is useful for assessment of regional gray matter atrophy in neurodegenerative conditions. A new longitudinal method, called CLADA (cortical longitudinal atrophy detection algorithm), has been developed for measurement of changes in cortical thickness in magnetic resonance images (MRI) acquired over time. CLADA creates a subject-specific cortical model which is longitudinally deformed to match images from individual time points. The algorithm was designed to work reliably for lower-resolution images, such as the MRIs with 1×1×5mm3 voxels previously acquired for many clinical trials in multiple sclerosis (MS). CLADA was evaluated to determine reproducibility, accuracy, and sensitivity. Scan-rescan variability was 0.45% for images with 1mm3 isotropic voxels and 0.77% for images with 1×1×5 mm3 voxels. The mean absolute accuracy error was 0.43 mm, as determined by comparison of CLADA measurements to cortical thickness measured directly in post- mortem tissue. CLADA’s sensitivity for correctly detecting at least 0.1 mm change was 86% in a simulation study. A comparison to FreeSurfer showed good agreement (Pearson correlation = 0.73 for global mean thickness). CLADA was also applied to MRIs acquired over 18 months in secondary progressive MS patients who were imaged at two different resolutions. Cortical thinning was detected in this group in both the lower and higher resolution images. CLADA detected a higher rate of cortical thinning in MS patients compared to healthy controls over 2 years. These results show that CLADA can be used for reliable measurement of cortical atrophy in longitudinal studies, even in lower resolution images.
Keywords: MRI, cortical thickness, longitudinal algorithm, Multiple sclerosis
Introduction
High resolution, high contrast magnetic resonance images (MRI) allow visualization of the human brain cerebral cortex (Van Essen 2001). Advances in medical image analysis have led to successful segmentation of the cortex and accurate measurements of cortical thickness (CTh, (Dale 1999; Han 2004; MacDonald 2000). These measurements are important because cortical morphometry is pathologically altered by many diseases, including multiple sclerosis (MS) (Sailer 2003).
The most common method to measure CTh in vivo is the application of deformable models. The deformable model, first introduced by Kass et al. (1988) as a “snake,” is a sophisticated image processing tool which deforms a 2D contour or 3D surface to fit the image by optimizing the internal (object) and external (image) forces. Deformable models can be classified into implicit or explicit models. Examples of implicit deformable models include the level set method (Goldenberg 2002; Han 2004; Zeng 1999) and Fourier-based parametric deformable models (Staib and Duncan 1996). Explicit methods represent the surface with a collection of points (Dale 1999; Davatzikos and Prince 1995; Davatzikos 1995; MacDonald 2000; Xu 1999) and are well-suited for modeling highly convoluted surfaces such as the human brain cortex (Zeng 1999). Explicit deformable models can also take advantage of inherent topological consistency for estimation of CTh (MacDonald 2000), whereas voxel-based methods without formulation of cortical surface models (Acosta 2009; Goldenberg 2002; Hutton 2008; Jones 2000) require specialized topological preserving mechanisms (Das 2009; Han 2003).
Currently available CTh measurement programs, such as FreeSurfer, require isotropic images with approximately 1 mm3 voxels (Dale 1999). These methods were not designed for retrospective analysis of CTh in lower resolution images, such as the MRIs acquired in previous clinical trials of MS treatments, which typically have a voxel size of 1×1×5 mm3 or 1×1×3 mm3. However, longitudinal measurement of CTh change from pre-existing image data is a fast and cost-effective approach to determine the clinical importance of cortical thinning in large groups of patients. In MS, these datasets are particularly valuable since placebo-controlled trials are less commonly conducted today due to ethical considerations.
Most current cortical measurement methods are cross-sectional, that is, each serial MRI for a given subject is analyzed independently. Cross-sectional methods tend to have relatively large measurement errors when applied to longitudinal studies because the data from each time point is analyzed independently and has its own independent measurement error, effectively decreasing reproducibility. On the other hand, longitudinal or registration-based methods achieve more consistent results (Han 2006) because they take advantage of the fact that in normal aging and many pathologic conditions, morphologic changes over time are small for individual subjects. There are some existing longitudinal methods for analysis of CTh, including deformation-based surface morphometry (Chung 2003), registration based CTh measurement method (DiReCT, (Das 2009), and the longitudinal processing scheme of FreeSurfer (Han 2006). A potential bias exists in such longitudinal methods where the cortical model from the first image is used as an initialization for the subsequent image (Das 2009) as the registration, segmentation and mesh reconstruction may vary. This problematic issue can be corrected by creating an unbiased template for each subject, as described for FreeSurfer’s more recent longitudinal processing scheme (version 4.5).1
In this paper, we describe a new unbiased longitudinal method, called cortical longitudinal atrophy detection algorithm, or CLADA, for measurement of changes in CTh using explicit deformable models. Unlike existing methods, CLADA can be applied to retrospectively analyze low resolution images (3–5mm slice thickness). The method has been evaluated to assess (1) scan-rescan and intra-operator reproducibility, (2) accuracy, (3) sensitivity, (4) performance across MRIs with different resolutions, (5) comparison with FreeSurfer, and (6) potential clinical relevance, through comparison of CLADA measurements in MS patients and healthy normal controls.
Materials and Methods
CLADA Algorithm
Overview
An overview of CLADA is shown in Figure 1. The algorithm combines images from all time-points, creates a deformable model of the cerebral cortex consisting of two explicit surfaces based on the combined image, and then deforms the model for each individual time-point. Each of the four major steps of CLADA and the images used for validation are described below.
Figure 1.
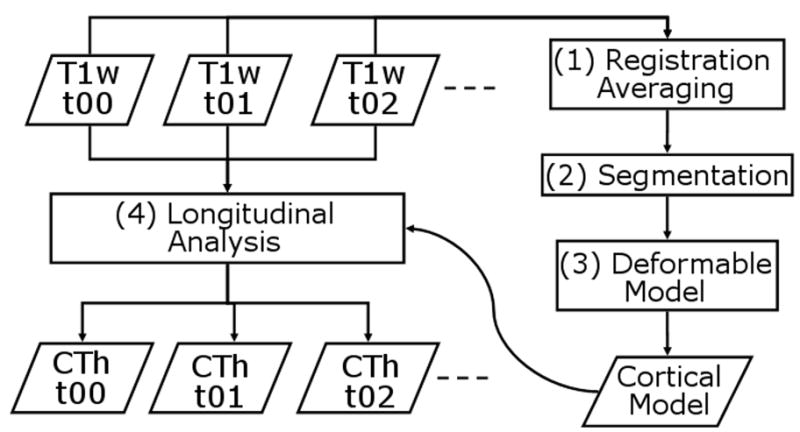
CLADA flowchart. 4 major steps include: (1) Registration and averaging of all images across time points t00, t01, t02, etc.; (2) Segmentation of brain tissues (gray matter, white matter, cerebral spinal fluid) and lateral ventricles; (3) Construction of the deformable cortical model; and (4) longitudinal deformation and cortical thickness (CTh) measurements at individual time points.
Serial image acquisition
CLADA requires longitudinally acquired T1-weighted images as input. CLADA can process both 2D low-resolution images (e.g. T1-weighted spin echo images, T1SE, with 1×1×5 mm3 voxels) and 3D higher-resolution images (e.g. magnetization prepared rapid gradient echo, MPRAGE or fast low angle shot, FLASH, with 1 mm3 isotropic voxels). Additional imaging modalities such as fluid attenuated inversion recovery (FLAIR) or T2-weighted images are helpful, but not required, for differentiating brain, non-brain and abnormal tissue, such as MS lesions. The acquisition details of the images used in our validation tests are described in the validation section.
Registration and image averaging
The objective of this first step was to obtain a subject-specific unbiased image and to improve the image quality by averaging longitudinal images for each subject. Non-brain constrained symmetric registration (NBCSR, (Chen 2008) was used to register all follow-up images to baseline. Briefly, NBCSR involved six steps: (1) whole head rigid-body registration, (2) brain-only affine registration, (3) affine registration in cropped non-brain region where the top of skull and neck are cropped to eliminate variable appearance, (4) brain-only 6-degrees-of-freedom registration with fixed scaling and skewing from previous step, (5) repeating steps 1–4 in the backward direction and (6) combination of the resulting forward and inverse transformations to achieve symmetric registration. This symmetric registration approach was used to reduce registration-related bias (Smith 2002; Yushkevich 2010). Image intensity variation was corrected by a parametric intensity non-uniformity correction algorithm (Styner 2000) and normalized using a differential bias correction (Lewis and Fox 2004). The corrected images were resampled to 0.75 mm3 isotropic resolution and transformed into the reference coordinates with spline interpolation to facilitate computation of the image gradient in a later step. The transformed images were averaged on voxel-by-voxel basis.
Segmentation
The resulting subject-specific average image was segmented using a method previously described and validated for T1SE images (Nakamura and Fisher 2009). The overall scheme was similar to FreeSurfer (Dale 1999) in that the image was segmented into gray matter (GM), white matter (WM), and cerebrospinal fluid (CSF) and a cortical GM-WM boundary was generated through a combination of segmentation and atlas-based classification (Dale 1999). For consistency and efficiency in CLADA, this segmentation step was carried out only once for each subject rather than for each of the follow-up images separately.
The segmented brain mask was further processed using morphologic operations (3mm-dilation, seed-fill, 1.5mm-opening, and 1mm-median filter) to fill in the lateral ventricles (Nakamura and Fisher 2009). Next, the “inner brain” mask, which contains the cerebral white matter, lateral ventricles, and the deep gray matter (Fig. 5-h) was created for initial surface deformation. The deep gray matter structures (caudate, putamen, and globus pallidus), cerebellum and brainstem were isolated (once) in the Harvard Brain Atlas (Kikinis 1996). ART nonlinear registration was used to register the subject image and the atlas (Ardekani 2005). Using the resulting transformation, the masks for the brainstem and cerebellum were transformed to subject space, disconnected, and eliminated from subsequent analysis steps. Similarly, the deep gray structures were added to the inner brain mask. If necessary, MS lesions were segmented on FLAIR images using iterative conditional modes (Besag 1986) and added back into the inner brain mask. Manual editing was performed to correct any remaining segmentation errors due to lesion holes (if no FLAIR image is available) and misclassification of blood vessels as white matter, which may occur in low-resolution images due to partial volume effects.
Figure 5.

An example of CLADA results from an MS patient. (a) input baseline T1-weighted MPRAGE image, (b) follow-up MPRAGE, (c) resampled average image, (d) brain segmentation, (e) MS lesion mask, (f) ventricle mask, (g) white matter mask, (h) the inner brain mask, (i) initial cortical model with outer cortical surface (red) and inner cortical surface (yellow) generated from the average image, (j) final result showing the differential cortical thickness map (blue=atrophy, red=growth), and (k) 3D rendered cortical inner surface, and (l) rendered outer surface.
Deformable Model
As in other explicit surface models (Dale 1999; MacDonald 2000), two explicit surfaces, one for the inner cortical surface (ICS, between white matter and gray matter) and one for the outer cortical surface (OCS, between CSF and gray matter) were constructed next. The OCS was difficult to detect due to small separations between opposing surfaces within tight sulci and partial volume effects (PVE), and thus the ICS was created first with the inner brain mask (Dale 1999). The approach used in CLADA combined some aspects of both FreeSurfer (Dale 1999) and anatomic segmentation using proximities (ASP, (MacDonald 2000). Instead of simultaneously deforming the two surfaces from the start, as in ASP, a single elliptic surface shrink-wrapped to the inner brain mask first, to define the ICS, then it deformed outward to define the OCS. Only after the two surfaces were generated, simultaneous deformation was applied to both surfaces. Unlike other methods, CLADA’s shrink wrap algorithm used a multiresolution remesh function, a method for fast surface intersection detection, and a method for surface relaxation on proximal surfaces to improve efficiency and accuracy.
For remeshing, the algorithm described by Botsch (2004) was implemented to manipulate the mesh configuration and distribution. This remesh algorithm iteratively (1) split edges longer than 4/3 of the target length, (2) collapsed edges shorter than 4/5 of the target, (3) flipped edges to reduce the variations in the number edges among vertices, and (4) tangentially smoothed the surfaces. For efficiency, a multiresolution approach was implemented by decreasing the target length from 5 mm to 1 mm. The algorithm was computationally efficient, maintained consistent topology, and had small geometric distortions due to its use of an iterative tangential relaxation.
The surface intersection detection used a fast triangle-triangle intersection test (Moller 1997) and prevented physically impossible overlaps. The intersection tests were performed with fast recursive bounding boxes (Zomorodian and Edelsbrunner 2000) to decrease computation time. The surface relaxation on proximal surfaces minimized the local surface area by smoothing when an object had a tunnel, a common artifact in low-resolution images with significant PVE. The algorithm detected proximal surface regions by extending the surface deformation and testing for surface intersection but not actually applying the deformation. If a potential surface intersection was detected, a local smoothing operation was performed on this surface region by averaging the neighboring vertex positions.
After ICS detection, the initial OCS was estimated by iteratively expanding ICS outward. A target OCS vertex was established for each ICS vertex using the surface model, averaged image, and Sobel-filtered gradient image according to the following rules: (1) the intensity at the OCS vertex must be above the estimated mean OCS intensity, μOCS, which is the mean intensity of GM-CSF edge voxels. The edge voxels must have high gradient, above the 75th percentile for all gradients in the brain mask, and intensity between mean GM and CSF intensities (obtained from segmentation). (2) The first derivative of the intensity profile along the OCS surface normal must be negative (i.e. decreasing intensity). (3) The OCS must not intersect another surface. (4) The OCS vertex must be contained within the brain mask, but not in the cerebellum or brainstem masks. (5) The distance between the ICS vertex and the target OCS vertex must be less than predefined distance of 3 mm. Although the cortex is thicker than 3 mm in some regions, the initial estimate was confined to 3 mm to provide a stable and realistic starting point that was close to the final surface. As in FreeSurfer and ASP (Dale 1999; MacDonald 2000), the correspondence between each inner surface vertex and outer surface vertex was maintained for calculation of CTh.
Finally, the two cortical surfaces were deformed simultaneously with an additional internal energy term to ensure CTh smoothness:
| Equation 1 |
| Equation 2 |
| Equation 3 |
| Equation 4 |
where was the iterative deformation of 3D vertex position, v, determined by the internal surface smoothness force (Fsurf), internal thickness smoothness force (Fthck), external image force (Fimag) and the weighting constants (α, β, γ). The surface smoothness term (Fsurf) pulls the vertex towards the local average point (vlocal); similarly, the thickness smoothness pulls the vertex towards the point that corresponds to the averaged local thickness (CThlocal) along the surface normal (n̂). The image force was determined by the image gradient at the vertex ( ∇I(v)), lambda(λ), which regulates the gradient, and a Heaviside function (H) of image intensity (I(v)) and estimated edge intensity (μCS). Lambda (λ) was the 95 percent value of the image gradient within the brain. The weighting constants, α, β, and γ, were set to 1.5, 0.5, 1.0, respectively, as determined through trial-and-error to produce good results. The deformation iterated until the deformation size (ΔC) was smaller than predefined threshold (ΣΔCn/dn/N < 1%) where dn is the distance between n’th vertex on ICS and OCS and N is the total number of vertices. The resulting model was the subject-specific cortical model based on the averaged image and used as initialization for longitudinal deformation in individual images.
Longitudinal Deformation and Cortical Thickness Measurements
The subject-specific cortical model was subsequently deformed to fit the images from individual time-points. The cortical model rather than the image was transformed to prevent interpolation artifacts (Han 2006). In this step, the remesh function was not applied in order to ensure that consistent ICS-OCS correspondence was maintained. The same deformation process as described above was applied iteratively for each time point until the change was below a predefined 1% threshold as before. CTh was determined for each surface vertex in the follow-up image as the distance between corresponding vertices on the ICS and OCS surfaces (Lerch and Evans 2005). The global CTh was estimated as the surface-area-weighted average: CThglobal = ΣAndn / ΣAn (where An is the triangular surface areas surrounding the n’th ICS and OCS vertices). Although the superior aspect of the brainstem as well as the diencephelon, hippocampus and amygdala were part of the ICS and OCS surfaces, these non-cortical regions were excluded from the global CTh measurement by masking with the registered Harvard Brain Atlas (Kikinis 1996) regions. For regional analysis, the atlas was transformed and filtered (in surface space. Surface-area-weighted regional CTh was measured for each anatomic region in the same manner as for global thickness. Regional labels remain constant across time points for longitudinal analysis.
Validation
Individual elements of the CLADA deformation model were tested using simulated data prior to testing on brain MRIs. These tests were done to demonstrate efficacy of the self-intersection test and surface relaxation step used for tracking the convoluted inner surface. Further tests were performed to evaluate CLADA in terms of its (1) reproducibility, (2) accuracy, (3) sensitivity to change in CTh, (4) sensitivity to input image type, (5) sensitivity to reference time point, (6) comparison with FreeSurfer, and (7) clinical relevance using longitudinal data from MS patients and healthy normal controls.
Reproducibility Test
The reproducibility of CLADA’s CTh measurements was evaluated using two scan-rescan MRI datasets: 3D MPRAGE images with high signal-to-noise ratio (SNR) and 1 mm3 isotropic voxels, as well as for lower resolution 2D T1-weighted spin echo (T1SE) images. The higher resolution dataset consisted of 10 scan-rescan image pairs from young controls obtained through the Open Access Series of Imaging Studies database (OASIS, (Marcus 2007). Subjects were scanned twice within 10 days on a 1.5T scanner with the same MPRAGE sequence [repetition time (TR)=9.7msec; echo time (TE)=4.0msec; flip angle (FA)=10°; inversion time (TI)=20msec; slice thickness (THK)=1.25mm; gap=0mm; number of slices = 128; matrix size=256x256; in-plane resolution=1mm×1mm; number of signal averages (NSA)=4]. The lower resolution 2D T1SE images were acquired from 9 MS patients on a 1.5T Siemens Magnetom Vision with the following sequence parameters: TR=800 ms, TE=20 ms, THK=5.0mm; gap=0mm; number of slices = 30; matrix size = 192×256, in-plane resolution=0.9 mm × 0.9 mm. The MS patients were scanned twice, with one week between acquisitions.
CLADA was applied to the images from both scan-rescan datasets to measure global and regional CTh. Percent error was calculated as the absolute difference in CTh measurements divided by mean CTh. For visualization of regional variability, surface error maps were generated for each subject. The intensity of each surface voxel was set to the difference in CTh from the nearest vertex and the resulting error image was smoothed (FWHM=0.9mm). To create mean surface error maps, the images were registered to the MNI152 template (Avants 2008; Klein 2009; Klein 2010). The error images were averaged across subjects in MNI space, inverse transformed back to native space of one subject, and mapped to the cortical surface.
Intra-operator variability was assessed using a subset of these cases (five OASIS MPRAGE and five MS T1SE). A single operator performed CLADA twice, approximately 4 days apart. Variability was calculated as the absolute difference in global and regional CTh and Pearson correlation coefficient (r) of CTh change. An intra-operator variability mean surface error map was generated in the same manner as for scan-rescan variability.
Accuracy Test
To evaluate the accuracy of the CTh measurements, CLADA was used to measure CTh from post-mortem MRIs acquired in situ and then compared to a “gold standard” thickness measured in 2D digital photographs of the same brain slices. The in situ MRPAGE was acquired with the following sequence parameters [TR=1900 ms, TE=1.71 ms, THK=1.2mm; number of slices = 120; matrix size = 256×256, in-plane resolution=1mm]. The MRIs were registered with the photographs using a method previously described (Fisher 2007). Briefly, in addition to the post-mortem MRI acquired in situ, an MRI of the left cerebral hemisphere post-fixation was acquired in a customized brain slicing box with MRI-visible markers that indicate positions of the slice planes. The post-fixation image was acquired with the same MPRAGE protocol as the in situ MRI, except with 1mm isotropic voxel size and four signal averages to accurately identify the marker locations. The hemisphere was sliced in the box immediately after acquisition of post-fixation MRI. The post-fixation MRI was used solely to locate the corresponding slicing plane in the post-mortem MRI, and thus no cortical thickness measurements were made from post-fixation MRI. The post-mortem MRI was registered to the post-fixation brain slices using a full affine registration with scaling and shearing to account for brain shrinkage due to fixation. We then refined the registration using visual inspection to adjust each slice, thus resulting in nonlinear registration as a whole.
To compare 3D CTh measurements obtained using CLADA to 2D thickness measurements from photographs of the brain slices, we set four constraints to identify valid regions of interest (ROI): (1) Corresponding vertices from the inner and outer cortical surfaces had to be within 0.2 mm from the co-registered image/photograph plane (2) The absolute value of the dot product of normals from the brain slice plane and the cortical surfaces had to be less than 0.3 to ensure they were approximately perpendicular; (3) Large ROIs that spanned gyri and sulci had to be subdivided to minimize spatial variability as gyrus thickness tends to be larger than sulcal thickness (2.9mm and 2.2mm respectively, (Fischl and Dale 2000); and (4) As determined by careful visual inspection, areas that appeared to have any misregistration were excluded. ROIs were manually selected from all major (frontal, temporal, parietal, and occipital) lobes throughout the hemisphere. For each valid ROI determined in the MRIs based on the criteria above, the same ROI was manually selected in the photograph based on landmarks and the mean CTh was measured within the ROI. To measure CTh from the photographs, we manually segmented the WM-GM inner edge and GM-CSF outer edge, and estimated CTh using the Laplacian method (Haidar and Soul 2006). We then calculated the Pearson correlation and absolute differences between the photograph CTh and MRI CTh measurements.
Sensitivity Test with Simulation of Atrophy or Growth
The sensitivity of CLADA for detection of small changes was tested using simulations of regional brain atrophy or growth. ROIs were manually selected from MRIs of five OASIS datasets. The ROIs on the brain surface were very slightly deformed by a known amount at sub-voxel level, either inward for atrophy or outward for growth. The direction of deformation is normal to the brain surface mask and determined by 1.6mm-FWHM Gaussian and Sobel directional filters. The magnitude of the deformation is normalized to maximum of 0.3mm at the brain edge after the 1.6mm-FWHM Gaussian filter. CLADA was applied to the original and deformed images to measure changes in CTh. The error was calculated as the mean absolute difference between the measured results and the actual applied deformations. CLADA’s sensitivity was calculated by TP / (TP+FN) where TP is the number of surface points CLADA correctly deformed more than 0.1mm and FN is the number of surface points CLADA did not deform even though the image was deformed more than 0.1mm. We also plotted the actual versus measured deformations, and calculated the slope of the best fit line.
Sequence Comparison
Next, we compared CLADA results obtained from conventional 2D T1SE images (with 3 mm slice thickness) to results obtained with higher contrast 3D MPRAGE images (with 1.2 mm slice thickness). Longitudinal data from 15 secondary progressive multiple sclerosis (SPMS) patients included axial T1SE images (TR=675msec; TE=17msec; THK=3mm; number of slices=48; matrix size=256×192; in-plane resolution=0.9mm×0.9mm; NSA=1) acquired on a 1.5T Siemens Symphony scanner and axial MPRAGE images [TR=1900msec; TE=1.71msec; FA=8°; TI=1.71msec; THK=1.2mm; number of slices=128; matrix size=256x256; in-plane resolution=1×1mm; NSA=1] acquired on the same day on a 3T Siemens Magnetom Trio scanner. Images were acquired at baseline and weeks 2, 4, 26, 52, 78. The T1SE and MPRAGE images were analyzed separately. The annualized global CTh change was calculated as the difference between CTh measurements at baseline and last follow-up divided by the time interval (78 weeks or 1.5 years). The Pearson correlation was determined between annualized global CTh change measurements obtained from T1SE and MPRAGE images.
Effect of the Choice of Reference Space
Registration-related variability was investigated by changing the reference time point from baseline to follow-up. Eight longitudinal OASIS datasets (each with 2 time points) were analyzed from subjects with or without dementia (Marcus 2007). CLADA was run twice for each set: once with the baseline image used as the reference space, and then again with the follow-up image used as the reference. The absolute difference was calculated for the global and regional CTh measurements, and a surface error map was generated to compare the annualized CTh changes measured each way.
Comparison to FreeSurfer
CLADA was compared to FreeSurfer using a subset of seven of the SPMS patient datasets described in the “Sequence Comparison” section. We ran FreeSurfer version 4.5.0 on the baseline MPRAGE images. FreeSurfer CTh was measured within the same regions as CLADA to enable direct comparison of the global and regional CTh results. Regional labels (global, frontal, temporal, parietal and occipital ROIs) created from CLADA were used in FreeSurfer as described in FreeSurfer ROI analysis workflow2. For FreeSurfer analysis, semi-automatically segmented MS lesions were filled with a mean normal appearing WM intensity estimated during segmentation. FreeSurfer was applied to the lesion-filled MRIs without manual intervention. To reduce analysis time, this step was performed in place of correcting the lesions after cortical reconstruction. The results were visually inspected for errors related to the lesions. A detailed CTh difference map was generated in MNI152 space by nonlinear registration to visualize regional differences in CTh measured by CLADA and FreeSurfer.
Clinical Relevance
Finally, to demonstrate a potential clinical application of CLADA, we compared the longitudinal change in global CTh in MS patients and normal healthy controls (NHC). Sixty clinically-definite MS patients and 15 age-matched NHC were followed for two years, with imaging performed semi-annually for MS and annually for NHC. Images were acquired 1.5T Siemens Vision, and relevant images for this study included T1SE [TR=600msec; TE=20msec; THK=5mm; contiguous 30 slices; matrix size=256×256; in-plane resolution=0.94×0.94mm; NSA=1] and FLAIR [TR=6000msec; TE=105msec; TI=2000msec; THK=3mm contiguous; matrix size=256×256; in-plane resolution=0.94×0.94mm; NSA=1]. There were no major scanner upgrades during the study. T2 hyperintense lesions were segmented on FLAIR using a modified version of the iterated conditional modes (Besag 1986). We used images acquired at baseline, year 1, and year 2 to measure the global CTh. Annualized CTh change was estimated by linear regression of CTh over time for each subject. T-tests were used to compare the baseline CTh and annualized change in global CTh between MS and NHC groups.
Bias in Estimating Atrophy
To further study the bias in estimating atrophy, we used the method described by Yushkevich et. al. (2010) and applied it to the data from the Reproducibility Test. This approach analyzes scan-rescan data as if it were data from an actual longitudinal study where for each patient, the repeated scans are randomly assigned to be either “baseline” or “follow-up”. Changes in global and regional CTh were statistically compared to truth (no change) using t-tests.
Results
Deformable Model Algorithm Feasibility Tests
Tests using simulated data and brain MRIs demonstrated the ability of CLADA to track convoluted surfaces (Figure 2). Figure 3 shows detailed longitudinal cortical surface detection for an atrophic brain from the OASIS dataset. While deformation from a sphere to a smaller sphere did not cause any problems, even without the self-intersection test, a sphere with a tunnel caused problems when the surface was deformed without testing for self-intersections because the surface continued to grow on opposite sides. Although physically impossible in actual brain white matter, such tunnels and disconnections can result from segmentation errors. This could be particularly problematic for low-resolution MRIs with significant PVE. For spheres with straight tunnels, deformations that included the self-intersection test resulted in essentially the same final surface with or without the inclusion of the relaxation step. However, if there was a narrowing in the center of the tunnel, similar to the shape of the cortex when white matter voxels are misclassified due to PVE, the result of the self-intersection method alone will depend on the position of the initial object. The relaxation step moved the self-intersection point by relaxing and minimizing the surface area, thus reducing the dependence on the initial condition.
Figure 2.

Effects of including or excluding the self-intersection test and surface relaxation steps shown as a collection of cross-sections of 3D objects (black) with the initial starting point of the deformable surface (blue) and the resulting surface after deformation (red). The images show cross-sectional views of a deformation starting from the blue object into the red object with the binary image in black. Top row: With a sphere and well-located initial object, all methods perform equally well. Second row: When there is a tunnel in the middle of the sphere, the self-intersection test is needed to stop the deformation. Otherwise, the surfaces continue to move toward the other side. Third and fourth rows: When the tunnel narrowing is located at the center, the same results are obtained with or without relaxation. However, when the center is shifted to the right, as in the fourth row, the relaxation method accurately shifts to the right with the narrowing.
Figure 3.

The results of CLADA on a longitudinal OASIS dataset from a demented subject, zoomed in on the left posterior region (lateral ventricle and nearby cortex). Despite blurring in the averaged image, the cortical surface detection is quite accurate after longitudinal deformation. The images were acquired at intervals of 0, 248, 647, 970, and 1233 days. These images were registered using nonbrain-constrained symmetric registration and transformed with spline interpolation.
The algorithms were also tested on actual low resolution MRIs (Figure 4). Axial images with 5mm thick slices were reformatted in the coronal plane and resampled to have isotropic voxels with significant partial volume averaging. The effects of including both the self-intersection and the relaxation step can be appreciated over using the self-intersection test alone.
Figure 4.

Comparison of the resulting surface detected with and without the relaxation step included in the deformation. (a) resampled low resolution MRI (b) deformed cortical surface detected with the inclusion of the self-intersection test but without surface relaxation (c) deformed cortical surface detected with the inclusion of the self-intersection test and surface relaxation step. The blue arrow indicates the error where the surfaces moved incorrectly due to a tunnel artifact.
CLADA Results
Figure 5 shows an example of CLADA processing on serial MPRAGE images acquired 12 months apart from an MS patient. Changes in CTh were overlaid in color on the original MRI so that regions of thinning and thickening could be visually verified. The per-subject computational time for all 6 time points by a single-thread application was approximately 12–15 hours without manual editing on Intel Xeon E5405 2GHz processor.
Reproducibility
Figure 6 shows boxplots of the percent differences in global and regional CTh measurements from the scan-rescan datasets. CLADA performed better on MPRAGE than T1SE images. The mean scan-rescan percent error in global CTh was 0.77% for the T1SE image pairs and 0.45% for the MPRAGE image pairs. Regional CTh measures had lower percent error for MPRAGE images in the temporal, parietal and occipital regions. Scan-rescan CTh error maps are also shown in Figure 6. Overall, MPRAGE images showed more homogeneous errors less than 0.3 mm, and lower-resolution T1SE images resulted in larger errors up to 0.7 mm. The errors tended to be in the inferior region of the brains.
Figure 6.

(a) Boxplots of percent error in global and regional cortical thickness measurements from scan-rescan tests. Reproducibility was measured from datasets consisting of T1-weighted spin echo images of 9 MS patients (blue) and MPRAGE images of 10 healthy subjects from the OASIS database (green). (b,c) The absolute cortical thickness difference was averaged in MNI space and mapped back to the cortical surface. The red surface indicates large errors and dark blue indicates no error (0 mm difference in CTh). MPRAGE images (b) showed very low variability (less than 0.3 mm) whereas spin echo images (c) had differences of up to 0.7 mm.
The mean (standard deviation) intra-operator absolute difference in global mean CTh from the MPRAGE and T1SE image sets were 0.01 (0.02) mm and 0.01 (0.01) mm, respectively. The mean (s.d.) absolute differences in CTh change were 0.0009 (0.0012) mm/yr and 0.001 (0.001) mm/yr for MPRAGE and T1SE, respectively. The repeated CTh change measurements were highly correlated in both MPRAGE (slope = 1.07, r = 0.997, p < 0.0001) and T1SE (slope = 0.999, r = 0.988, p < 0.0001). The boxplot, plot of CTh changes, and the error maps are presented in Supplementary Figure 1.
Accuracy
Twenty-seven slices from four brains imaged post-mortem were used in the accuracy test. Out of a total of 113 ROIs initially selected for analysis, ten ROIs were omitted from three slices due to misregistration. Thus, accuracy analysis was completed on the remaining 103 ROIs. CTh measurements from CLADA analysis of MRIs were linearly correlated to CTh measurements from photographs of the same tissue slices (r = 0.68, p < 0.001). The slope of the regression line (1.06) was slightly greater than unity (Figure 7). The mean (s.d.) difference between MRI and photograph CTh measurements was 0.17 (0.54) mm and the mean (s.d.) absolute difference was 0.43 (0.36) mm.
Figure 7.

An example of registration and ROI selection (arrow) for comparing the cortical thickness from (a) brain slice and (b) corresponding MRI. Cortical thickness within the yellow boundary was calculated from co-registered photograph and MRI ROIs and then compared. The plot in (c) shows the results of 103 ROIs sampled from 4 different brains. (solid black line = best fit linear regression; dashed red line = unity, where all the dots would lie if the error was zero.)
Sensitivity to Changes in Cortical Thickness
The sensitivity of CLADA for detecting small changes was measured in simulated atrophy and growth experiments using a total of 8172 surface points collected from 20 ROIs in five OASIS datasets (Figure 8). The maximum applied deformation was 0.3 mm, which is on the order of expected changes due to MS. The sensitivity or the true positive rate with a cut-off of 0.1mm detection was 86%, and the slope of the best fit line was 0.75. Measured changes were strongly correlated to applied simulated changes (r = 0.958, p<0.001, Figure 8d). The mean absolute error (s.d.) between measured and applied changes in CTh was 0.02 (0.02) mm.
Figure 8.

An example of the original (a), deformed (b), and difference (c) images, and results of the sensitivity test (d). The black solid line is the best fit line of the measured thickness change and the applied deformation (slope = 0.75, r = 0.958, p<0.001). The red dotted line is the ideal line.
Comparison between Image Sequences
CTh measurements differed for T1SE and MPRAGE input images (Figure 9). The mean global CTh at baseline was 2.71±0.21 for MPRAGE and 3.57±0.23 mm for T1SE (p<0.0001). The mean annualized changes in CTh measured from MPRAGE and T1SE images were −0.031 ± 0.02 mm and −0.024 ± 0.02 mm, respectively. The correlation was 0.569 (p=0.027). The percent change in CTh for MPRAGE and T1SE was −1.14% for MPRAGE and −0.69% for T1SE.
Figure 9.
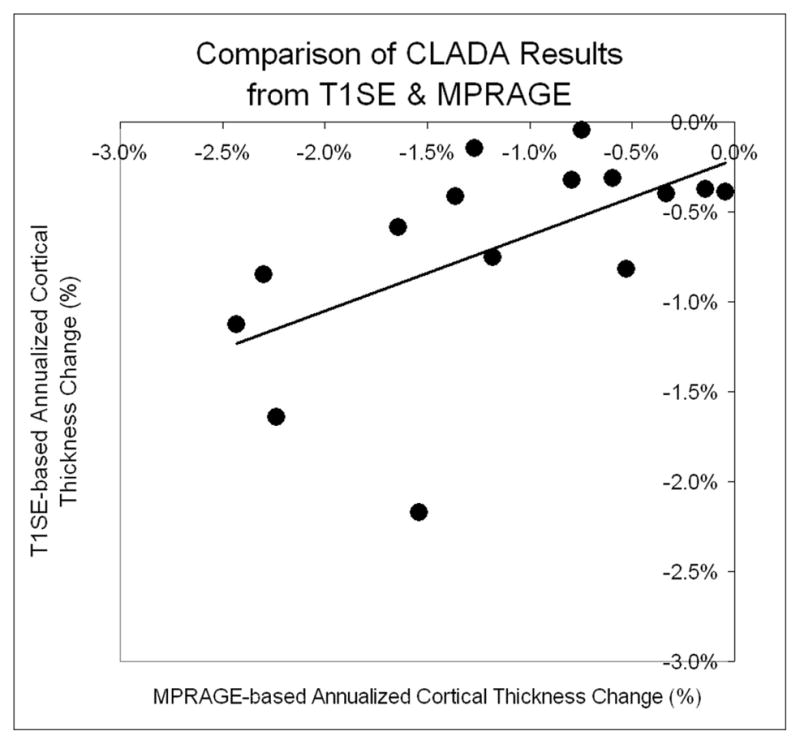
Scatter plot of annualized cortical thickness change measured from T1SE and MPRAGE images in 15 MS patients (slope = 0.423, r=0.569, p=0.027).
Effect of the Choice of Reference Space
Repeated CLADA analysis with either baseline or follow-up image as the reference space resulted in a mean absolute difference in mean global CTh of 0.013±0.005mm. The regional CTh absolute differences (s.d.) were 0.015 (0.016) in frontal, 0.023 (0.021) in temporal, 0.014 (0.013) in parietal, and 0.011 (0.012) mm in occipital lobes. The boxplot and the surface error map are shown in Supplementary Figure 2.
Comparison with FreeSurfer
CLADA CTh measurements were correlated with FreeSurfer CTh measurements, both globally (r = 0.73, p = 0.04) and regionally (Figure 10). The global mean absolute difference between CLADA and FreeSurfer CTh was 0.37 mm. Regional CTh differences were slightly higher in temporal lobes (0.42 mm) than in other lobes (frontal = 0.37 mm, parietal = 0.35 mm, and occipital = 0.31 mm). The detailed surface error map showed that differences were generally less than 0.5 mm, but the temporal and frontal lobes showed larger differences. Generally, CLADA CTh measurements were higher than FreeSurfer CTh measurements.
Figure 10.

Cortical thickness measured using CLADA and FreeSurfer in seven SPMS patients (a). CTh measurements were correlated (r = 0.70, p<0.04) and consistently higher than FreeSurfer. The surface error map shows averaged absolute CTh differences which were slightly higher in temporal lobe (b, red surface).
Clinical Relevance
The 60 MS patients were age-matched with the 15 normal healthy controls (mean (s.d.) age at baseline was 42.4 (9.4) versus 40.4 (8.8) for MS and NHC; p = 0.46). Thirty-seven of the MS patients had relapsing-remitting disease, and 23 had SPMS. At baseline, the mean global CTh of the MS patients was slightly smaller than NHC (3.51 ± 0.16 mm versus 3.57 ± 0.21 mm, p = 0.152). The annualized change in global CTh was significantly higher in the MS group (−0.025 mm/yr, or −0.71 ± 0.91 %/yr) as compared to the NHC group (−0.011 mm/yr, or −0.30 ± 0.52 %/yr; p = 0.018), indicating a higher rate of cortical thinning in the MS patients over the two years of follow-up.
Bias in Estimating Atrophy
The estimation of bias using the scan-rescan datasets was not significantly different from zero. For the high-resolution OASIS images, the p-values were 0.657, 0.673, 0.354, 0.684, and 0.672 for global, frontal, temporal, parietal, and occipital CTh, and for the low-resolution scan-rescan images the p-values were 0.383, 0.112, 0.983, 0.758, and 0.633 for global, frontal, temporal, parietal, and occipital CTh respectively.
Discussion
This work describes an efficient new method for measurement of cortical atrophy in MRIs acquired for longitudinal studies. Existing software packages for CTh measurements are intended for analysis of high contrast images with approximately 1 mm3 voxels. A unique feature of CLADA is that it has been designed specifically to measure CTh change from lower resolution 2D images with 3–5 mm slice thickness. The deformable model incorporates relaxation on self-intersection regions to account for white matter segmentation errors, which are common in lower resolution images with significant PVE. Our tests showed that the algorithm was still successful in detecting cortical surfaces and estimating CTh change in 2D images with 3–5 mm slice thickness. However, as expected, the errors from lower-resolution images were higher than those obtained with 3D MPRAGE isotropic images. These results suggest that although studies using older, lower-resolution MRIs may require larger sample sizes, CLADA is applicable for analysis of retrospective datasets, such as those typically acquired for clinical trials of MS therapeutics.
CLADA uses explicit rather than implicit surfaces for the cortical model because explicit representations seem better suited to model highly convoluted surfaces (Zeng 1999) with smoothness constraints (Acosta 2009). An important feature of our deformable cortical surface detection algorithm is the incorporation of remeshing and self-intersection tests. These components lead to an efficient multiresolution shrink-wrap algorithm that maintains surface topology. Topological inconsistency is a common problem in cortical surface detection algorithms initialized from a white matter mask (Fischl 2001; Han 2006). The multiresolution remeshing approach achieves highly complex shapes while still maintaining topology. These functions are important because deformable models require good initialization to avoid local minima. The savings in computation time are substantial. Measurement of CTh with CLADA takes approximately 15 hours for a single subject with six time points, whereas similar methods, such as FreeSurfer or ASP, require approximately 20–30 hours for a single image at a single time point (Dale 1999; MacDonald 2000).
A strength of our method is the longitudinal nature of the algorithm, as demonstrated by the high reproducibility. CLADA uses images from all time-points to create an average image with high SNR and to estimate the cortical surface by creating a subject-specific cortical surface model. This model is then deformed to fit the patient’s images from individual time points. User interaction is kept to a minimum -- only the mask for the subject’s average image is manually edited, if necessary. Thus, CLADA takes less time to analyze follow-up images once the initial model has been created.
Various validation tests were performed to quantitatively evaluate our new algorithm in terms of reproducibility, accuracy, sensitivity, performance with different types of MRIs, effect of reference space, comparison with FreeSurfer, and potential clinical relevance. Accuracy validation through comparison with post-mortem brain tissue is a very difficult task (Das 2009). The majority of earlier reports on CTh measurements from autopsied brains did not account for three dimensions (Mann 1991; Wegner 2006; Wiley 1991). Rosas et al. (2002) used autopsied brain tissue to validate the accuracy of MRI CTh measurements, but restricted measurements to the crowns of gyri where curvature is minimal. To compare 3D MRI-based CTh measurements to 2D tissue-based CTh, we used careful co-registration of image slices to tissue slices and selection of valid ROIs from MRI to ensure that the 3D thickness vectors were in the plane of the corresponding tissue slices. Otherwise the measurements would not be expected to be comparable. These steps also allowed comparison of measurements even in curved regions and deep sulci. The results demonstrated that CTh as measured by CLADA was correlated to CTh measured in fixed tissue at the same locations. The slope indicated that MRI-based measurements were slightly higher than those in the fixed tissue, likely due to fixation effects. The absolute error of 0.43 mm was fairly low, considering the voxel size of 1.2 mm3 and complex effects of fixation. Visual inspection revealed that 4 ROIs had large measurements errors due to inclusion of dura mater in CTh measured by CLADA. The dura mater is difficult to remove with a single MPRAGE image (van der Kouwe 2008), and additional imaging modalities might be helpful in future applications of CLADA.
Other complex factors may have affected the results of this validation test. First, the affine registration applied to minimize the fixation effect may have only been partially effective as the comparisons showed that CLADA-based CTh was thicker. In addition to tissue shrinkage, fixation effects are complicated by the fact that damaged tissues may be susceptible to more variable degrees of deformation than tissues that remain relatively intact. Furthermore, the cortical surface can be non-linearly distorted during the fixation process, for example, flattening along the midsagittal surface may occur when the hemisphere is placed in the container of fixative. Lastly, we compared two different types of CTh measurements: the distance between corresponding points with CLADA in MRI, and the Laplacian thickness in photographs. CLADA thickness is defined by straight lines while the Laplacian thickness may curve, which may underestimate the error in curved areas (Jones 2000). There are various ways of defining the corresponding points between the inner and outer cortical surfaces for calculation of thickness (nearest point, perpendicular distance, Laplacian, etc.). We chose the Laplacian method because it has unique surface correspondence for CTh measurements even in regions of high curvature. Another important limitation is the accuracy of the gold standard. While we carefully and accurately measured CTh using high resolution photographs (pixel size < 0.1 mm), factors like fixation and unclear tissue edges can affect the accuracy of the gold standard.
The sensitivity test showed that CLADA was able to detect sub-voxel level change. The detected change tended to be slightly less than the applied deformation partly due to the surface and CTh smoothness terms incorporated into CLADA. There was also a trend for larger errors with greater deformation. This observation may be related to an artifact of the applied deformation, which may be misaligned with the cortical surface normal, and the absolute errors increase proportionally with the deformation field. As demonstrated by the comparison of measured to applied deformations in Figure 8, CLADA appeared to have lower sensitivity for positive change (increases in CTh) than for negative change (cortical thinning), with slopes of 0.67 and 0.78, respectively. We believe this difference was primarily due to the limited range of motion for applied deformations in the positive direction in cortical regions with small sulci, which are common in these young normal controls. Measurements of positive deformations selectively applied to gyri surrounded by larger sulci confirmed this explanation. In these restricted analyses, the positive deformations had similar sensitivity as negative deformations (slope = 0.82). Finally, part of the deviation from ideal slope (1.0) may be attributed to bias introduced by interpolation. In this test, the warped image was interpolated but the original image was not, and biased interpolation has been shown to lower sensitivity (Yushkevich 2010). Our simulation method avoided deep sulci and used crowns of gyri to properly simulate atrophy or growth with simple image warping. Rather than to estimate accuracy, the main goal of these simulations was to determine if CLADA was sufficiently sensitive to detect very small changes in cortical CTh typical over one year in MS patients, and the results showed that it was. If necessary, more sophisticated methods for simulating global or regional atrophy using finite element or topology preserving models (Camara 2006; Karacali and Davatzikos 2006) could be implemented for future studies.
The reproducibility test results demonstrated a relatively low scan-rescan error (< 1%) in all regional CTh measurements. This was expected given that CLADA is a longitudinal algorithm which incorporates images over all time points. Typically, with the use of longitudinal methods, there is a trade-off of sensitivity for reproducibility (Xue 2006). However, the sensitivity of CLADA was evident in simulated deformation studies and in the application to serial MRIs acquired from a group of MS patients. Our CTh results were consistent with previous reports of accelerated GM atrophy in MS patients as compared to NHC’s (Fisher 2008).
The image sequence comparison showed that CTh was (on average) 0.8 mm larger when measured in MRIs with 1×1×3 mm3 voxels as compared to MRIs with ~1 mm3 voxels. Most likely, blurred tissue boundaries due to PVE led to apparently thicker cortex. This comparison confirmed the importance of scanning subjects with the same sequence in longitudinal studies. Intra-operator test-retest showed some variations in CTh measurements, but the variability in longitudinal change was consistent and small (up to 0.007 mm/yr in temporal lobe) compared to the expected rate of cortical thinning in MS (mean change of −0.025 mm/yr).
The application of CLADA to a clinical dataset showed a trend for smaller mean CTh in MS patients than normal controls, consistent with previous findings (Calabrese 2007; Sailer 2003), and the rate of cortical thinning (−0.025 mm/year) was significantly higher than the reported rate of −0.016 mm per decade in a cross-sectional study of normal aging (Salat 2004). We also found that the rate of cortical thinning was significantly higher in MS than controls. A higher rate of cortical thinning was not detected in MS patients in a previous longitudinal study (Chen 2004), however that study had fewer patients and shorter follow-up time.
Construction of an unbiased template remains a difficult task (Guimond 2000; Joshi 2004). Comparison of CTh measurements using either baseline or the follow-up image as the reference space resulted in small differences, which may be the source of scan-rescan error. The longitudinal change analysis was less affected by the choice of reference space. The differences in CTh change were on the order of 0.001 mm/yr, which is very low compared to mean atrophy rate of −0.025 mm/yr in MS. Thus, the choice of reference image did have a small effect on CTh measurements despite efforts to eliminate such bias. Reference space bias was minimized through the use of symmetric linear registration prior to averaging the images, construction of the cortical model from the average image rather than from the baseline image, and transformation of the cortical model to the space of each time point rather than transforming each image to a common space prior to model deformation. Bias estimated from scan-rescan datasets was not statistically different from zero, indicating that CLADA can be reliably applied to longitudinal CTh studies.
There was surprisingly good agreement between CLADA measurements from MPRAGE images and the lower resolution T1SE images acquired in the same session, with the exception of one outlier in the patient group. The outlier in Figure 9 appeared to be related to significant motion artifacts evident in the T1SE images at both time points. The difference in the scanner field strength may have affected these results to some extent. However, the objective of this test was to compare CLADA results from lower resolution MRIs to that of higher resolution, higher contrast images in a longitudinal setting. These data support the use of CLADA to analyze retrospective MRI datasets.
CLADA also showed good agreement with FreeSurfer, the most widely used software package for estimation of CTh. These comparisons showed that CLADA measurements are consistently higher than FreeSurfer by 0.36±0.14mm, on average (median=0.34mm, mode=0.3mm with bin size = 0.1mm). This test is a cross-validation analysis to demonstrate comparability with a widely used method rather than a comparison to a gold standard. One possible interpretation is that the FreeSurfer measurements are accurate and CLADA has a consistent subvoxel offset of approximately 0.3mm. However, it may also be the case that neither method is completely accurate. Correlational agreement is informative in cross-validation comparisons where the absolute truth is not known (Smith 2007).
In summary, our results show that CLADA can be used for reliable quantitative measurement of CTh change in longitudinal MRI studies. In MS, histopathological studies show that the cortex is demyelinated (Kidd 1999) without evidence of inflammation (Peterson 2001). Therefore, cortical atrophy most likely reflects severe cortical damage and neuronal loss rather than effects related to the resolution of edema or pseudoatrophy (Nakamura 2010; Zivadinov 2007). There is also increasing MRI evidence of focal cortical damage as detected by DIR, T1-weighted, susceptibility and FLAIR MRI (Geurts 2009) as well as diffuse cortical damage (Amato 2004; Calabrese 2007). Cross-sectional and short-term longitudinal studies have found that MRI-detected cortical damage is related to patient disability (Calabrese 2007; Charil 2007; Chen 2004) and cognitive impairment (Amato 2004). However, the overall clinical relevance and predictive value of CTh changes for determination of disability progression over the long-term are yet to be determined. In future studies, CLADA will be used to analyze longitudinal CTh changes in larger groups of MS patients and control subjects in order to determine the clinical significance of cortical thinning. CLADA will also be used for retrospective analysis of previous MS clinical trials to investigate treatment effects on cortical atrophy.
Supplementary Material
The intra-operator variability was measured from repeated analysis of longitudinal T1SE images from five MS patients (left column, a, c, e) and longitudinal OASIS MPRAGE images from 5 demented or non-demented subjects (right b, d, f). (a,b) Differences in absolute cortical thickness; (c,d): regional error map; (e,f) Global and regional cortical thickness changes from repeated analyses. For both lower resolution T1SE and higher resolution MPRAGE images, the repeated measurements were highly correlated near the unity line (slope = 0.999, r = 0.988, p < 0.0001 for T1SE; slope = 1.07, r = 0.997, p < 0.0001 for MPRAGE).
Effect of different reference spaces: (a) boxplot of absolute global and regional cortical thickness differences; (b) correlation between CTh change measured using baseline as the reference space and CTh change measured using the follow-up image as the reference space (slope = 1.00, r = 0.997, p < 0.0001); (c) surface error map indicating regions where the CTh differed.
Figure 11.
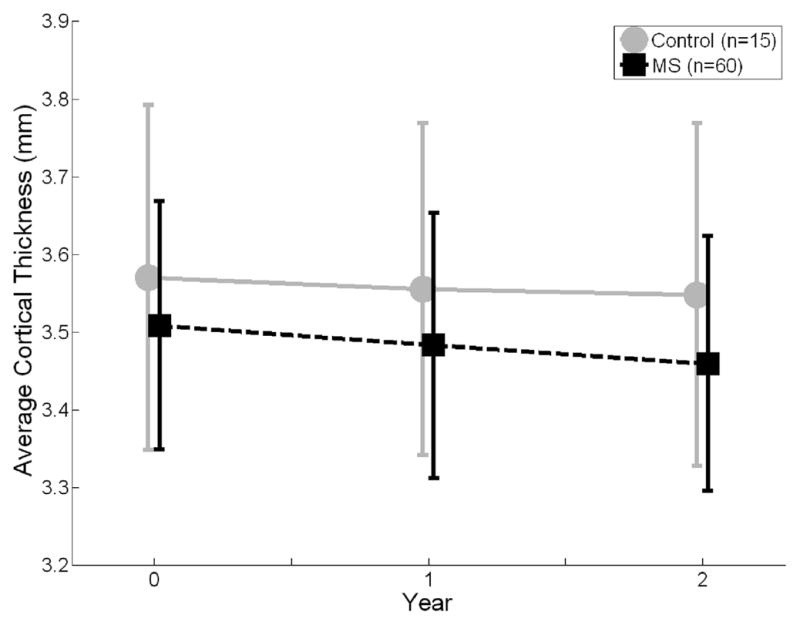
Longitudinal evolution of global cortical thickness (CTh) in multiple sclerosis patients (MS) and healthy normal controls. The annualized change in global CTh was significantly higher in the MS group (−0.025 mm/yr, or −0.71 ± 0.91 %/yr) than control group (−0.011 mm/yr, or −0.30 ± 0.52 %/yr; p = 0.018). The error bars are the standard deviations.
Acknowledgments
This study was supported by the National Institutes of Health NINDS (P01-NS38667) and National Multiple Sclerosis Society (RG 3548A2). The authors would like to thank our clinical collaborator, Dr. Richard Rudick, Ms. Patricia Jagodnik for image data management, and Dr. Jacqueline Chen for helpful discussions and suggestions.
Footnotes
Publisher's Disclaimer: This is a PDF file of an unedited manuscript that has been accepted for publication. As a service to our customers we are providing this early version of the manuscript. The manuscript will undergo copyediting, typesetting, and review of the resulting proof before it is published in its final citable form. Please note that during the production process errors may be discovered which could affect the content, and all legal disclaimers that apply to the journal pertain.
References
- Acosta O, Bourgeat P, Zuluaga MA, Fripp J, Salvado O, Ourselin S Alzheimer's Disease Neuroimaging Initiative. Automated voxel-based 3D cortical thickness measurement in a combined lagrangian-eulerian PDE approach using partial volume maps. Med Image Anal. 2009;13(5):730–743. doi: 10.1016/j.media.2009.07.003. [DOI] [PMC free article] [PubMed] [Google Scholar]
- Amato MP, Bartolozzi ML, Zipoli V, Portaccio E, Mortilla M, Guidi L, Siracusa G, Sorbi S, Federico A, De Stefano N. Neocortical volume decrease in relapsing-remitting MS patients with mild cognitive impairment. Neurology. 2004;63(1):89–93. doi: 10.1212/01.wnl.0000129544.79539.d5. [DOI] [PubMed] [Google Scholar]
- Ardekani BA, Guckemus S, Bachman A, Hoptman MJ, Wojtaszek M, Nierenberg J. Quantitative comparison of algorithms for inter-subject registration of 3D volumetric brain MRI scans. J Neurosci Methods. 2005;142(1):67–76. doi: 10.1016/j.jneumeth.2004.07.014. [DOI] [PubMed] [Google Scholar]
- Avants BB, Epstein CL, Grossman M, Gee JC. Symmetric diffeomorphic image registration with cross-correlation: Evaluating automated labeling of elderly and neurodegenerative brain. Med Image Anal. 2008;12(1):26–41. doi: 10.1016/j.media.2007.06.004. [DOI] [PMC free article] [PubMed] [Google Scholar]
- Besag J. On the statistical analysis of dirty pictures. J R Statist Soc B. 1986;48:259–302. [Google Scholar]
- Botsch M, Kobbelt L. A remeshing approach to multiresolution modeling. Proc. Eurographics/ACM SIGGRAPH Symp. Geometry Processing; 2004. pp. 185–192. [Google Scholar]
- Calabrese M, Atzori M, Bernardi V, Morra A, Romualdi C, Rinaldi L, McAuliffe MJM, Barachino L, Perini P, Fischl B, et al. Cortical atrophy is relevant in multiple sclerosis at clinical onset. J Neurol. 2007;254(9):1212–1220. doi: 10.1007/s00415-006-0503-6. [DOI] [PubMed] [Google Scholar]
- Camara O, Schweiger M, Scahill RI, Crum WR, Sneller BI, Schnabel JA, Ridgway GR, Cash DM, Hill DL, Fox NC. Phenomenological model of diffuse global and regional atrophy using finite-element methods. IEEE Trans Med Imaging. 2006;25(11):1417–1430. doi: 10.1109/TMI.2006.880588. [DOI] [PubMed] [Google Scholar]
- Charil A, Dagher A, Lerch JP, Zijdenbos AP, Worsley KJ, Evans AC. Focal cortical atrophy in multiple sclerosis: Relation to lesion load and disability. Neuroimage. 2007;34:509–517. doi: 10.1016/j.neuroimage.2006.10.006. [DOI] [PubMed] [Google Scholar]
- Chen J, Collins D, Derakhshan M, Arnold D. Quantifying MRI with increased specificity for MS pathology: A longitudinal method for obtaining whole-brain metrics of 3D maps derived from non-conventional MRI. Proc. Int. Soc. Magn. Reson. Med; 2008. p. 2136. [Google Scholar]
- Chen JT, Narayanan S, Collins DL, Smith SM, Matthews PM, Arnold DL. Relating neocortical pathology to disability progression in multiple sclerosis using MRI. Neuroimage. 2004;23(3):1168–1175. doi: 10.1016/j.neuroimage.2004.07.046. [DOI] [PubMed] [Google Scholar]
- Chung MK, Worsley KJ, Robbins S, Paus T, Taylor J, Giedd JN, Rapoport JL, Evans AC. Deformation-based surface morphometry applied to gray matter deformation. Neuroimage. 2003;18(2):198–213. doi: 10.1016/s1053-8119(02)00017-4. [DOI] [PubMed] [Google Scholar]
- Dale AM, Fischl B, Sereno MI. Cortical surface-based analysis. I. segmentation and surface reconstruction. Neuroimage. 1999;9(2):179–194. doi: 10.1006/nimg.1998.0395. [DOI] [PubMed] [Google Scholar]
- Das SR, Avants BB, Grossman M, Gee JC. Registration based cortical thickness measurement. Neuroimage. 2009;45(3):867–879. doi: 10.1016/j.neuroimage.2008.12.016. [DOI] [PMC free article] [PubMed] [Google Scholar]
- Davatzikos CA, Prince JL. An active contour model for mapping the cortex. IEEE Trans Med Imaging. 1995;14(1):65–80. doi: 10.1109/42.370403. [DOI] [PubMed] [Google Scholar]
- Davatzikos C. Using a deformable surface model to obtain a shape representation of the cortex. IEEE Trans Med Imag. 1995;15(6):785–795. doi: 10.1109/42.544496. [DOI] [PubMed] [Google Scholar]
- Fischl B, Liu A, Dale AM. Automated manifold surgery: Constructing geometrically accurate and topologically correct models of the human cerebral cortex. IEEE Trans Med Imaging. 2001;20(1):70–80. doi: 10.1109/42.906426. [DOI] [PubMed] [Google Scholar]
- Fischl B, Dale AM. Measuring the thickness of the human cerebral cortex from magnetic resonance images. Proc Natl Acad Sci. 2000;97(20):11050–11055. doi: 10.1073/pnas.200033797. [DOI] [PMC free article] [PubMed] [Google Scholar]
- Fisher E, Lee JC, Nakamura K, Rudick RA. Gray matter atrophy in multiple sclerosis: A longitudinal study. Ann Neurol. 2008;64(3):255–265. doi: 10.1002/ana.21436. [DOI] [PubMed] [Google Scholar]
- Fisher E, Chang A, Fox RJ, Tkach JA, Svarovsky T, Nakamura K, Rudick RA, Trapp BD. Imaging correlates of axonal swelling in chronic multiple sclerosis brains. Ann Neurol. 2007;62(3):219–228. doi: 10.1002/ana.21113. [DOI] [PubMed] [Google Scholar]
- Geurts JJG, Stys PK, Minagar A, Amor S, Zivadinov R. Gray matter pathology in (chronic) MS: Modern views on an early observation. J Neurol Sci. 2009;282(1–2):12–20. doi: 10.1016/j.jns.2009.01.018. [DOI] [PubMed] [Google Scholar]
- Goldenberg R, Kimmel R, Rivlin E, Rudzsky M. Cortex segmentation: A fast variational geometric approach. IEEE Trans Med Imaging. 2002;21(12):1544–1551. doi: 10.1109/TMI.2002.806594. [DOI] [PubMed] [Google Scholar]
- Guimond A, Meunier J, Thirion J. Average brain models: A convergence study. Comput Vision Image Understanding. 2000;77(2):192–210. [Google Scholar]
- Haidar H, Soul JS. Measurement of cortical thickness in 3D brain MRI data: Validation of the laplacian method. J Neuroimaging. 2006;16(2):146–153. doi: 10.1111/j.1552-6569.2006.00036.x. [DOI] [PubMed] [Google Scholar]
- Han X, Pham DL, Tosun D, Rettmann ME, Xu C, Prince JL. CRUISE: Cortical reconstruction using implicit surface evolution. Neuroimage. 2004;23(3):997–1012. doi: 10.1016/j.neuroimage.2004.06.043. [DOI] [PubMed] [Google Scholar]
- Han X, Jovicich J, Salat D, van der Kouwe A, Quinn B, Czanner S, Busa E, Pacheco J, Albert M, Killiany R, et al. Reliability of MRI-derived measurements of human cerebral cortical thickness: The effects of field strength, scanner upgrade and manufacturer. Neuroimage. 2006;32(1):180–194. doi: 10.1016/j.neuroimage.2006.02.051. [DOI] [PubMed] [Google Scholar]
- Han X, Xu C, Prince JL. A topology preserving level set method for geometric deformable models. IEEE Trans Pattern Anal Mach Intell. 2003;25(6):755–768. [Google Scholar]
- Hutton C, De Vita E, Ashburner J, Deichmann R, Turner R. Voxel-based cortical thickness measurements in MRI. Neuroimage. 2008;40(4):1701–1710. doi: 10.1016/j.neuroimage.2008.01.027. [DOI] [PMC free article] [PubMed] [Google Scholar]
- Jones SE, Buchbinder BR, Aharon I. Three-dimensional mapping of cortical thickness using laplace's equation. Hum Brain Mapp. 2000;11:12–32. doi: 10.1002/1097-0193(200009)11:1<12::AID-HBM20>3.0.CO;2-K. [DOI] [PMC free article] [PubMed] [Google Scholar]
- Joshi S, Davis B, Jomier M, Gerig G. Unbiased diffeomorphic atlas construction for computational anatomy. Neuroimage. 2004;23:S151–S160. doi: 10.1016/j.neuroimage.2004.07.068. [DOI] [PubMed] [Google Scholar]
- Karacali B, Davatzikos C. Simulation of tissue atrophy using a topology preserving transformation model. IEEE Trans Med Imaging. 2006;25(5):649–652. doi: 10.1109/TMI.2006.873221. [DOI] [PubMed] [Google Scholar]
- Kass M, Witkin A, Terzopoulos D. Snakes: Active contour models. International Journal of Computer Vision. 1988;1(4):321–331. [Google Scholar]
- Kidd D, Barkhof F, McConnell R, Algra P, Allen I, Revesz T. Cortical lesions in multiple sclerosis. Brain. 1999;122:17–26. doi: 10.1093/brain/122.1.17. [DOI] [PubMed] [Google Scholar]
- Kikinis R, Shenton ME, Iosifescu DV, McCarley RW, Saiviroonporn P, Hokama HH, Robatino A, Metcalf D, Wible CG, Portas CM, et al. A digital brain atlas for surgical planning, model-driven segmentation, and teaching. IEEE Trans Vis Comput Graph. 1996;2(3):232–241. [Google Scholar]
- Klein A, Ghosh SS, Avants B, Yeo BT, Fischl B, Ardekani B, Gee JC, Mann JJ, Parsey RV. Evaluation of volume-based and surface-based brain image registration methods. Neuroimage. 2010;51(1):214–220. doi: 10.1016/j.neuroimage.2010.01.091. [DOI] [PMC free article] [PubMed] [Google Scholar]
- Klein A, Andersson J, Ardekani BA, Ashburner J, Avants B, Chiang MC, Christensen GE, Collins DL, Gee J, Hellier P, et al. Evaluation of 14 nonlinear deformation algorithms applied to human brain MRI registration. Neuroimage. 2009;46(3):786–802. doi: 10.1016/j.neuroimage.2008.12.037. [DOI] [PMC free article] [PubMed] [Google Scholar]
- Lerch JP, Evans AC. Cortical thickness analysis examined through power analysis and a population simulation. Neuroimage. 2005;24(1):163–173. doi: 10.1016/j.neuroimage.2004.07.045. [DOI] [PubMed] [Google Scholar]
- Lewis EB, Fox NC. Correction of differential intensity inhomogeneity in longitudinal MR images. Neuroimage. 2004;23(1):75–83. doi: 10.1016/j.neuroimage.2004.04.030. [DOI] [PubMed] [Google Scholar]
- MacDonald D, Kabani N, Avis D, Evans AC. Automated 3-D extraction of inner and outer surfaces of cerebral cortex from MRI. Neuroimage. 2000;12(3):340–356. doi: 10.1006/nimg.1999.0534. [DOI] [PubMed] [Google Scholar]
- Mann DM. The topographic distribution of brain atrophy in alzheimer's disease. Acta Neuropathol. 1991;83(1):81–86. doi: 10.1007/BF00294434. [DOI] [PubMed] [Google Scholar]
- Marcus DS, Wang TH, Parker J, Csernansky JG, Morris JC, Buckner RL. Open access series of imaging studies (OASIS): Cross-sectional MRI data in young, middle aged, nondemented, and demented older adults. J Cogn Neurosci. 2007;19(9):1498–1507. doi: 10.1162/jocn.2007.19.9.1498. [DOI] [PubMed] [Google Scholar]
- Moller T. A fast triangle-triangle intersection test. J Graph Tools. 1997;2(2):25–30. [Google Scholar]
- Nakamura K, Rudick RA, Lee JC, Foulds P, Fisher E. Effect of intramuscular interferon beta-1a on gray matter atrophy in relapsing-remitting multiple sclerosis. Presented at the Annual Meeting of the American Academy of Neurology.2010. [Google Scholar]
- Nakamura K, Fisher E. Segmentation of brain magnetic resonance images for measurement of gray matter atrophy in multiple sclerosis patients. NeuroImage. 2009;44(3):769–776. doi: 10.1016/j.neuroimage.2008.09.059. [DOI] [PMC free article] [PubMed] [Google Scholar]
- Peterson JW, Bö L, Mörk S, Chang A, Trapp BD. Transected neurites, apoptotic neurons, and reduced inflammation in cortical multiple sclerosis lesions. Ann Neurol. 2001;50:389–400. doi: 10.1002/ana.1123. [DOI] [PubMed] [Google Scholar]
- Rosas HD, Liu AK, Hersch S, Glessner M, Ferrante RJ, Salat DH, van der Kouwe A, Jenkins BG, Dale AM, Fischl B. Regional and progressive thinning of the cortical ribbon in huntington's disease. Neurology. 2002;58(5):695–701. doi: 10.1212/wnl.58.5.695. [DOI] [PubMed] [Google Scholar]
- Sailer M, Fischl B, Salat D, Tempelmann C, Schonfeld MA, Busa E, Bodammer N, Heinze HJ, Dale A. Focal thinning of the cerebral cortex in multiple sclerosis. Brain. 2003;126(Pt 8):1734–1744. doi: 10.1093/brain/awg175. [DOI] [PubMed] [Google Scholar]
- Salat DH, Buckner RL, Snyder AZ, Greve DN, Desikan RSR, Busa E, Morris JC, Dale AM, Fischl B. Thinning of the cerebral cortex in aging. Cerebral Cortex. 2004;14:721–730. doi: 10.1093/cercor/bhh032. [DOI] [PubMed] [Google Scholar]
- Smith SM, Zhang Y, Jenkinson M, Chen J, Matthews PM, Federico A, De Stefano N. Accurate, robust, and automated longitudinal and cross-sectional brain change analysis. Neuroimage. 2002;17:479–489. doi: 10.1006/nimg.2002.1040. [DOI] [PubMed] [Google Scholar]
- Smith SM, Rao A, De Stefano N, Jenkinson M, Schott JM, Matthews PM, Fox NC. Longitudinal and cross-sectional analysis of atrophy in alzheimer's disease: Cross-validation of BSI, SIENA and SIENAX. Neuroimage. 2007;36(4):1200–1206. doi: 10.1016/j.neuroimage.2007.04.035. [DOI] [PubMed] [Google Scholar]
- Staib LH, Duncan JS. Model-based deformable surface finding for medical images. IEEE Trans Med Imaging. 1996;15(5):720–731. doi: 10.1109/42.538949. [DOI] [PubMed] [Google Scholar]
- Styner M, Brechbuhler C, Szekely G, Gerig G. Parametric estimate of intensity inhomogeneities applied to MRI. IEEE Trans Med Imaging. 2000;19(3):153–165. doi: 10.1109/42.845174. [DOI] [PubMed] [Google Scholar]
- van der Kouwe AJ, Benner T, Salat DH, Fischl B. Brain morphometry with multiecho MPRAGE. Neuroimage. 2008;40(2):559–569. doi: 10.1016/j.neuroimage.2007.12.025. [DOI] [PMC free article] [PubMed] [Google Scholar]
- Van Essen DC, Drury HA, Dickson J, Harwell J, Hanlon D, Anderson CH. An integrated software suite for surface-based analyses of cerebral cortex. J Am Med Inform Assoc. 2001;8(5):443–459. doi: 10.1136/jamia.2001.0080443. [DOI] [PMC free article] [PubMed] [Google Scholar]
- Wegner C, Esiri MM, Chance SA, Palace J, Matthews PM. Neocortical neuronal, synaptic, and glial loss in multiple sclerosis. Neurology. 2006;67(6):960–967. doi: 10.1212/01.wnl.0000237551.26858.39. [DOI] [PubMed] [Google Scholar]
- Wiley CA, Masliah E, Morey M, Lemere C, DeTeresa R, Grafe M, Hansen L, Terry R. Neocortical damage during HIV infection. Ann Neurol. 1991;29(6):651–657. doi: 10.1002/ana.410290613. [DOI] [PubMed] [Google Scholar]
- Xu C, Pham DL, Rettmann ME, Yu DN, Prince JL. Reconstruction of the human cerebral cortex from magnetic resonance images. IEEE Trans Med Imaging. 1999;18(6):467–480. doi: 10.1109/42.781013. [DOI] [PubMed] [Google Scholar]
- Xue Z, Shen D, Davatzikos C. CLASSIC: Consistent longitudinal alignment and segmentation for serial image computing. Neuroimage. 2006;30(2):388–399. doi: 10.1016/j.neuroimage.2005.09.054. [DOI] [PubMed] [Google Scholar]
- Yushkevich PA, Avants BB, Das SR, Pluta J, Altinay M, Craige C Alzheimer's Disease Neuroimaging Initiative. Bias in estimation of hippocampal atrophy using deformation-based morphometry arises from asymmetric global normalization: An illustration in ADNI 3 T MRI data. Neuroimage. 2010;50(2):434–445. doi: 10.1016/j.neuroimage.2009.12.007. [DOI] [PMC free article] [PubMed] [Google Scholar]
- Zeng X, Staib LH, Schultz RT, Duncan JS. Segmentation and measurement of the cortex from 3-D MR images using coupled-surfaces propagation. IEEE Trans Med Imaging. 1999;18(10):927–937. doi: 10.1109/42.811276. [DOI] [PubMed] [Google Scholar]
- Zivadinov R, Locatelli L, Cookfair D, Srinivasaraghavan B, Bertolotto A, Ukmar M, Bratina A, Maggiore C, Bosco A, Grop A, et al. I nterferon beta-1a slows progression of brain atrophy in relapsing-remitting multiple sclerosis predominantly by reducing gray matter atrophy. Multiple Sclerosis. 2007;13(4):490–501. doi: 10.1177/1352458506070446. [DOI] [PubMed] [Google Scholar]
- Zomorodian A, Edelsbrunner H. Fast software for box intersections. Proceedings of the 16th Annual Symposium on Computational Geometry; 2000. pp. 129–138. [Google Scholar]
Associated Data
This section collects any data citations, data availability statements, or supplementary materials included in this article.
Supplementary Materials
The intra-operator variability was measured from repeated analysis of longitudinal T1SE images from five MS patients (left column, a, c, e) and longitudinal OASIS MPRAGE images from 5 demented or non-demented subjects (right b, d, f). (a,b) Differences in absolute cortical thickness; (c,d): regional error map; (e,f) Global and regional cortical thickness changes from repeated analyses. For both lower resolution T1SE and higher resolution MPRAGE images, the repeated measurements were highly correlated near the unity line (slope = 0.999, r = 0.988, p < 0.0001 for T1SE; slope = 1.07, r = 0.997, p < 0.0001 for MPRAGE).
Effect of different reference spaces: (a) boxplot of absolute global and regional cortical thickness differences; (b) correlation between CTh change measured using baseline as the reference space and CTh change measured using the follow-up image as the reference space (slope = 1.00, r = 0.997, p < 0.0001); (c) surface error map indicating regions where the CTh differed.