

Abstract
Purpose
A comprehensive comparison of biomarker expression between patients' primary breast carcinoma (PBC) and their metastatic breast carcinomas (MBC) has not been done.
Experimental Design
We did rapid autopsies (postmortem intervals, 1-4 hours) on 10 consenting patients who died of MBC. We constructed single-patient tissue microarrays from the patients' archived PBC and multiple different MBCs harvested at autopsy, which were immunohistochemically labeled for multiple biomarkers. Methylation of multiple gene promoters was assessed quantitatively on dissected PBC and MBC samples.
Results
Extensive heterogeneity was observed between PBC and their paired MBC, as well as among multiple MBC from the same patient. Estrogen and progesterone receptors tended to be uniformly down-regulated in metastases. E-cadherin was down-regulated in a subset of the MBC of one case. Variable overexpression in MBC compared with the PBC was observed for cyclooxygenase-2 (five cases), epidermal growth factor receptor (EGFR; four cases), MET (four cases), and mesothelin (four cases). No case strongly overexpressed HER-2/neu by immunohistochemistry, but eight cases showed variable protein expression ranging from negative to equivocal (2+) in different MBC. In one case, variable low-level HER-2/neu gene amplification was found. EGFR and METoverexpression were restricted to the four basal-type cancers. EGFR protein overexpression did not correlate with EGFR gene amplification. Multigene promoter hypermethylation of RASSF1a, HIN1, cyclin D2, Twist, estrogen receptor α, APC1, and RARβ was overall very similar in the PBC and all MBCs in all cases.
Conclusions
Therapeutic targets identified in the PBC or even some MBC may not reflect targets present in all metastatic sites.
The relationship between primary neoplasms and their metastases has remained a great mystery. In 1889, Stephen Paget proposed the “seed and soil” theory to explain the nonrandom distribution of breast cancer metastases, such as the preference for bone metastasis (1). Paget's concept was that metastases are determined by interactions between the seed (the cancer) and the soil (the organ in which metastases may occur). However, numerous questions remain unanswered. Is the capacity to metastasis an intrinsic property of the neoplasm, or an acquired feature? Are all cells in a primary carcinoma capable of metastasis, or just a small subset (subclone)? Are different metastases in the same patient biologically different, perhaps reflecting the selection pressures of different soils?
Molecular techniques have shed light upon several of these issues. Weigelt (2) found marked similarities between the gene expression profiles of eight pairs of primary breast cancers and their distant metastases, suggesting that metastatic capacity was an intrinsic property of the neoplasm and not based upon clonal selection. The different locations (“soils”) of the metastases in the Weigelt study did not influence gene expression. The Massagué group has shown that subpopulations of cancer cells may have a tissue-specific gene expression profile which mediates metastasis to specific organs (soils),” such as bone (3) and lung (4). Several groups have theorized that a minority of cells within a primary breast cancer, so called “cancer stem cells,” have the capacity to self-renew and metastasize, whereas the majority of the tumor is composed of more differentiated cells lacking such capacity (5–7).
Because usually only one of a breast cancer patient's metastases is biopsied and such tissue samples have become smaller and smaller as technology (i.e., image-guided fine needle aspiration, etc.) has evolved, there has been little opportunity to systematically study breast cancer metastases. In this study, we report the first systematic and comprehensive analysis of breast cancer metastases using tissues derived from “rapid autopsies” done within 4 hours of the deaths of 10 patients with metastatic breast cancer. We use single-patient tissue microarrays (TMA) to compare the expression of biomarkers between primary tumors and their paired metastases and among different metastases from the same patient.
Materials and Methods
Consent
Ten patients, with terminal, widely metastatic breast carcinomas (MBC) consented to have autopsies done promptly (“rapid autopsy”), so that material of adequate quality for DNA-based and protein-based studies from multiple different metastases could be harvested for research. At the time of death, consent was obtained from the patient's designated next of kin. The protocol was reviewed and approved by the Institutional Review Board of Johns Hopkins Hospital and Department of Defense.
Autopsies
All autopsies were done within 4 h of death, an interval generally similar to that between removal of a breast specimen and sectioning in surgical pathology. At autopsy, all visceral organs were grossly examined for metastases, and different metastatic deposits were processed in three ways: harvested for cell culture, immediately frozen for tumor banking, and fixed in formalin. Formalin-fixed autopsy tissues were processed similar to surgical breast specimens at Johns Hopkins Hospital. The latter samples and grossly normal tissues were examined microscopically. All autopsies were complete, with the exception of case 9, in which the brain was not examined, and case 10, in which bone was not examined.
TMA construction
Paraffin tissue blocks from the patients' archived primary breast carcinoma (PBC; available from the Johns Hopkins Hospital Surgical Pathology Archives in 9 of 10 cases), and multiple different MBCs from the autopsy were used to construct single-patient TMAs. These arrays consisted of 99 spots, each 1.4 mm in diameter. The structure of a typical TMA is shown in Supplementary Fig. S1. For virtually all tumor samples, five spots were placed on the array to minimize sampling error. Only when the size of the metastasis was limiting were fewer spots used. Adjacent normal tissue was usually present in these same spots. Grossly, normal tissues from the autopsy were also included, as was the patient's primary carcinoma. The 10 TMA slides contained PBCs, and in total, 655 spots were derived from 120 MBC sites.
Immunohistochemistry
The TMAs were immunohistochemically labeled for the following: estrogen receptor α (ERα), progesterone receptor (PR), HER-2/neu, cytokeratin 5/6, fascin, epidermal growth factor receptor (EGFR), MET, cyclooxygenase 1 (Cox-2), and mesothelin. The rationale for analyzing each biomarker is presented below. ERα, PR, and HER-2/neu are standard clinical biomarkers used as prognostic and predictive factors for breast carcinoma. Cytokeratin 5/6 detects high molecular weight cytokeratins, which are expressed in basal-type breast carcinomas (8), a poor prognosis subgroup of ER, PR, HER-2/neu negative (“triple negative”) breast carcinoma defined by gene expression analysis (9, 10). EGFR is a receptor tyrosine kinase which is amplified and overexpressed in ∼30% of breast carcinomas, specifically in basal-type carcinomas. EGFR tyrosine kinase inhibitors are now available for clinical use. MET, the receptor for hepatocyte growth factor, is a receptor tyrosine kinase which, when activated, promotes cell proliferation, motility, and metastases. MET expression has been correlated with poor outcome in breast carcinoma (11). Small molecule MET tyrosine kinase inhibitors are being developed for clinical use. Cox-2/PTGS2, the rate-limiting step in prostaglandin synthesis, is undetectable in most normal tissues but has been implicated in growth, angiogenesis, and metastasis in breast cancer (12, 13). More specifically, bone-derived transforming growth factor β has been postulated to stimulate COX-2 in breast cancer cells to mediate osteolytic bone metastases (14). COX-2 inhibitors are in routine clinical use. Fascin is a 55-kDa protein which organizes filamentous actin into bundles, promoting cell motility. Fascin is widely expressed in mesenchymal tissues and low or absent in normal epithelium, but is up-regulated in many human carcinomas (15). Fascin is a member of the recently published lung metastasis gene expression signature of breast cancer (4). Mesothelin is a glycosylphosphatidyl inositol-linked membrane glycoprotein, which is normally present in mesothelium but has been shown to be overexpressed in pancreaticobiliary and ovarian carcinomas (16). Mesothelin is a promising target for immunotherapy in those cancers in which it is overexpressed (17).
Immunohistochemical labeling was done using standard methods. In general, unstained 5-μm sections were cut from paraffin TMA blocks; slides were deparaffinized by routine techniques, steamed for 30 min at 90 °C in 1× sodium citrate buffer (diluted from 10× heat-induced epitope retrieval buffer, Ventana-Bio Tek Solutions), cooled for 5 min, then incubated with the respective primary antibodies. Staining for CK5/6, ER, PR, and fascin were done on the Benchmark XT autostainer (Ventana Medical Systems, Inc.) using I-View detection kit (Ventana Medical Systems). The antibodies, dilutions, and sources were as follows: cytokeratin 5/6, monoclonal antibody, prediluted, DAKO; ERα, monoclonal antibody, 1:1 dilution, Ventana; PR, monoclonal antibody, 1:60 dilution, DAKO; fascin, monoclonal antibody, 1:200 dilution, DAKO. Mesothelin and EGFR staining were done using Capillary Action HRP/DAB detection system (Signet Laboratories, Inc.). The antibodies, dilutions, and sources for these are: mesothelin, monoclonal antibody, 1:20 dilution, Novacastra; EGFR, monoclonal antibody, 1:50 dilution, ZYMED, catalog #280005. Cox-2 and MET immunohistochemistry was done manually. Cox-2 polyclonal antibody was obtained from Oxford Biomedical Resarch, and used at 1:500 dilution at 4°C overnight after 20 min of steaming in citrate buffer. For MET, we used the C-28 polyclonal antibody from Santa Cruz Biotechnology at 1:3,000 dilution.
HER-2/neu immunohistochemistry was done using the DAKO Herceptest kit according to the manufacturer's standardized protocol. Each spot was scored according to the established system:
Score 0 (negative): No staining.
Score 1 (negative): Weak, incomplete membrane staining in any proportion of tumor cells or weak, complete membrane staining in <10% of tumor cells.
Score 2+ (equivocal): Complete membrane staining that is nonuniform or weak but with obvious circumferential distribution in at least 10% of tumor cells or intense complete membrane staining in 30% or less tumor cells.
Score 3+ (positive): Uniform intense membrane staining of >30% of tumor cells.
EGFR immunohistochemistry was scored on a scale of 0 to 3+ using previously published criteria (18). MET, mesothelin, and Cox-2 immunohistochemistry were scored on a 0-to-3+ scale on the basis of percentage of tumor cell labeling: 0, no labeling; 1+, <10% labeling; 2+, 10% to 50% labeling; 3+, >50% labeling.
HER-2/neu fluorescence in situ hybridization method
Fluorescence in situ hybridization (FISH) analysis was done on all TMAs for HER-2/neu amplification using the Path Vysion kit. The DNA probe for HER-2/neu was labeled with spectrum orange, and centromere probe (CEP 17) was labeled with spectrum green. One hundred nuclei were counted per metastatic site (typically five spots), and the ratio of orange-to-green signals (HER-2/neu gene to chromosome 17) was calculated. Using published criteria, a ratio of >2.2 was considered positive for amplification; a ratio of 1.8 to 2.2 was considered equivocal, whereas a ratio of <1.8 was considered negative.
EGFR chromogenic in situ hybridization method
Chromogenic in situ hybridization for EGFR amplification was done on the four TMAs that expressed EGFR protein by immunohistochemistry using previously published methods (18). Thirty-five to forty nuclei were counted per TMA spot. Using previously published criteria, cells with five or more signals per nucleus were considered positive for EGFR gene amplification. Tumors with an average of five or more signals per cell throughout were considered amplified, whereas tumors having clusters of neoplastic cells with five or more signals per cell were considered focally amplified.
Quantitative promoter methylation analysis
A single H&E section and five serial 5-μm unstained slides were cut from blocks of primary tumor and five to six metastatic sites for each case. Areas of ∼70% tumor cellularity were circled on the H&E slide, which was used as a guide to macroscopically dissect tumor off of the serial unstained slides. The macrodissected tumor (70% cellularity) was used for quantitative multiplex methylation-specific PCR analysis as described by Fackler et al. (19, 20). In brief, quantitative multiplex methylation-specific PCR analysis is a two-PCR step assay. In the first reaction, a cocktail of gene-specific primer pairs is used to coamplify DNA for multiple genes independent of their DNA methylation status. In the second reaction, quantitative real-time PCR is done with gene-specific primers, using the DNA template derived from the end product of reaction 1. DNA was analyzed in a single well, using methylation status–specific (U, unmethylated; M, methylated) primers [forward, reverse, and probe, conjugated with the 6-carboxyfluorescein (FAM) or VIC labels and 6-carboxytetramethylrhodamine (TAMRA) quencher]. The oligonucleotide probes are progressively degraded with each cycle of PCR; therefore, the fluorescence signal generated is directly proportional to the extent of DNA amplification. % M = 100 × [no. of copies of M/no. of copies of (unmethylated + methylated)], as determined by the absolute quantification method computed against a standard curve.
Results
Clinicopathologic data
The clinicopathologic features of the 10 cases (MBC1-MBC10) are summarized in Supplementary Table S1. The average age at diagnosis was 49.4 years, and average age at death was 55.7 years. The clinical course was variable with survival ranging from 2 years for a high-grade invasive duct carcinoma (IDC; MBC7) to 11 years for an intermediate-grade invasive lobular carcinoma (MBC1), with an average survival interval of 6.3 years. Five of the cases were node negative at diagnosis, four were node positive, and one did not have axillary node sampling.
Sites of metastasis
The sites of metastases identified in each case are summarized in Supplementary Table S2. Because grossly normal tissues from many of these cases frequently harbored microscopic metastases (often predominantly intra-vascular tumor emboli, as one would expect from patients with terminal cancer), we distinguished bulky, grossly evident metastases from less extensive microscopic involvement. Several trends were evident. First, the most common sites of bulky metastases were bone (8 of 10 cases) and liver (7 of 10 cases). Adrenal involvement was frequent (seven cases) and often bulky (four cases). Brain lesions were found in five of nine evaluated cases and were always small (maximum diameter, <1 cm. Whereas microscopic tumor emboli were found in the lung in all cases, only one case (MBC2) showed bulky lung metastases. In addition, the two carcinomas with predominantly lobular morphology (MBC1 and MBC5) were the two that showed bulky gastrointestinal metastases.
Tumor histology
Eight cases of IDC and one case of infiltrating lobular carcinoma showed conserved histologies in metastases. In one remarkable case (MBC5), the primary lesion was an IDC whereas the metastases had both ductal and lobular morphology. E-cadherin imunohistochemistry revealed intact labeling in the invasive ductal PBC and ductal metastases but loss of labeling in the metastases with lobular morphology (Fig. 1). Interestingly, a subset of cells in the ductal metastases grew in cord-like patterns resembling lobular carcinoma, and these cells had diminished E-cadherin expression. Importantly, no case showed sarcomatoid morphology in metastases.
Fig. 1.
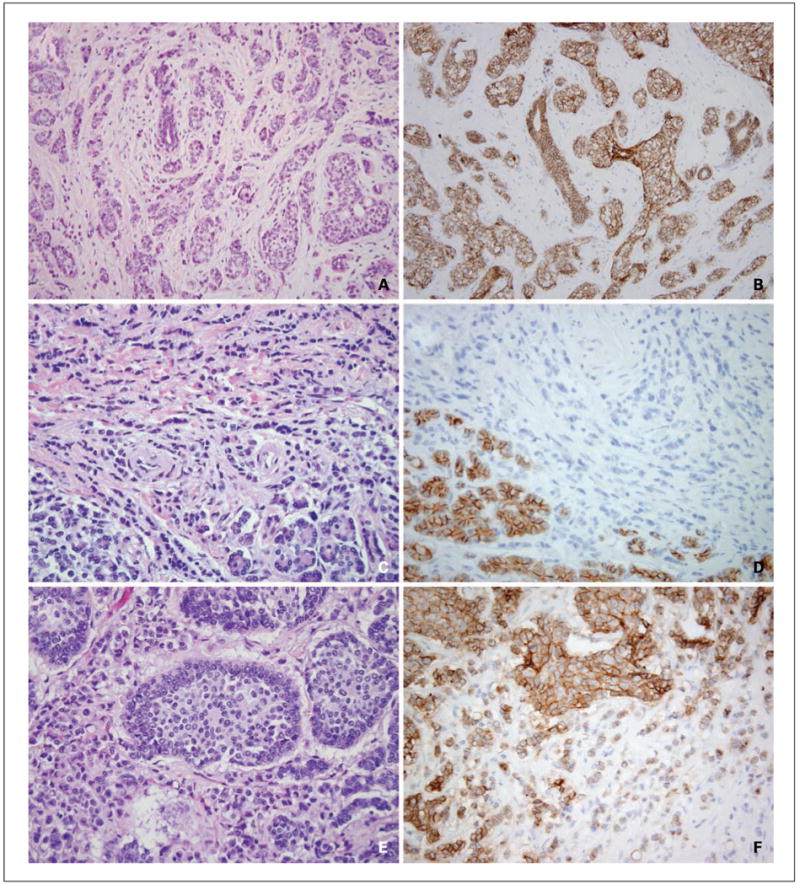
Variable morphology and E-cadherin immunohistochemistry of MBC5 metastases. The primary tumor (A) showed ductal morphology in that it grew as cords and solid nests and accordingly showed intact E-cadherin protein expression by immunohistochemistry (B). The majority of metastases, including pancreatic metastases (C), showed lobular morphology and accordingly showed loss of E-cadherin protein expression (D). Note that the native pancreatic epithelium (bottom left) labels for E-cadherin, providing an internal control. A pericardial metastasis (E) showed predominant nested morphology consistent with ductal differentiation, and E-cadherin was largely intact in this metastasis (F). Note the additional cord-like area of signet ring cells (E, bottom left) which showed diminished E-cadherin expression (F, bottom right).
Basic immunohistochemical tumor characterization
These results are summarized in Table 1. Three cases (MBC5, MBC8, and MBC9) were positive for ER and PR in the primary and essentially all metastases, although the intensity and percentage of ER labeling was consistently diminished in the metastasis of MBC5 and MBC8. Another exception was the bone metastases of MBC9; these were harvested the next day (27 hours postmortem interval) and were ER negative, although they maintained PR positivity. We attribute this discrepant result to delayed fixation yielding false-negative staining for ER. Three other cases (MBC1, MBC3, and MBC5) showed loss of one or more hormone receptor in all metastases. Therefore, overall, there was little variation in hormone receptor expression among different metastases of these cases; the hormone receptor status of one metastasis (positive or negative) generally reflected that of all of the others.
Table 1.
Basic immunohistochemical characterization of primary tumors and metastases
| Case | Primary | Metastases | HER-2/neu (FISH) | CK5/CK6 | EGFR |
|---|---|---|---|---|---|
| MBC1 | ER+ (30%, moderate) | ER-PR-ILC | Negative | - | - |
| PR-ILC | |||||
| MBC2 | ER-PR-IDC | ER-PR-IDC | Negative | + | + |
| MBC3 | ER+ (90%, strong) | ER+ (90%, strong) | Borderline | - | - |
| PR+ (20%, weak) | PR-*IDC | Amplified | |||
| IDC | |||||
| MBC4 | ER-PR-IDC | ER-PR-IDC | Negative | + | + |
| MBC5 | ER+ (100%, strong) | ILC: ER+ (50-70%, weak) | Negative | - | - |
| PR+ (20%, weak) IDC | PR+ (5%, moderate) | ||||
| IDC: ER+ (50-70%, weak) | |||||
| PR+ (80%, strong) | |||||
| MBC6 | ER+ (80%, strong) | ER-PR-IDC | Negative | - | - |
| PR+ (30%, strong) | |||||
| IDC | |||||
| MBC7 | ER-PR-IDC | ER-PR-IDC | Negative | + | + |
| MBC8 | ER+ (95%, strong) | ER+ (5-10%, weak) | |||
| PR+ (70%, moderate) | PR+ (5-10%, moderate) | Negative | - | - | |
| IDC | IDC | ||||
| MBC9 | ER+ (90%, strong) | ER+ (90%, strong) | Negative | - | - |
| PR+ (20%, strong) | PR+ (5-10%, moderate) | ||||
| IDC | IDC | ||||
| MBC10 | ER-PR-IDC | ER-PR-IDC | Negative | + | + |
NOTE: ER and PR stains are reported as percentage tumor cells labeling, followed by intensity.
Abbreviations: ILC, invasive lobular carcinoma; IDC, invasive ductal carcinoma.
Rare tumor cells in one of four liver metastases labeled weakly for PR.
In all cases but one (MBC6), the ER/PR status of the primary tumor, as assessed on whole sections at the time of clinical diagnosis, matched that of the primary tumor spots on the TMA. The exception was MBC6, where the primary tumor was reported to be PR negative at the time of diagnosis, whereas on the TMA it was focally positive (30% labeling, strong intensity).
Four cases (MBC2, MBC4, MBC7, and MBC10) were ER and PR negative in the primary and all metastases. These tumors were HER-2/neu negative (see below), but all expressed cytokeratin 5/cytokeratin 6. Hence, these four cases qualify as “basal-type” breast carcinomas (9, 10).
HER-2/neu
To summarize these results, one case (MBC3) showed variable low-level HER-2/neu gene amplification, whereas the other nine cases were nonamplified. More detailed analysis of these cases is presented below and in Fig. 2.
Fig. 2.
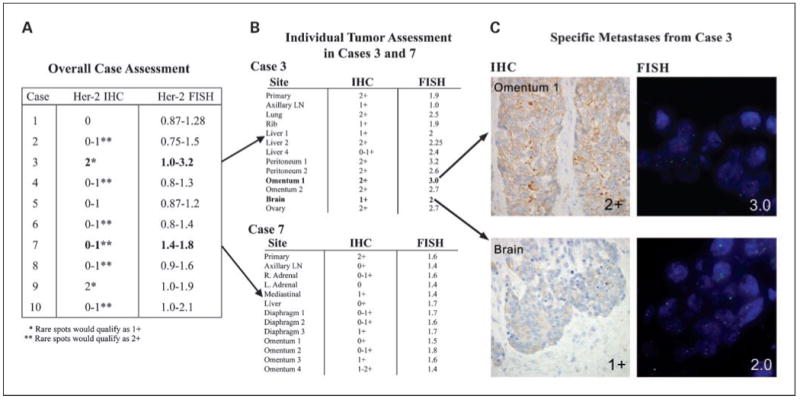
HER-2/neu analysis of primaries and metastases. A, range of HER-2/neu immunohistochemistry labeling scores for each case, along with range of HER-2/neu gene amplification ratios. B, range of HER-2/neu immunohistochemistry labeling scores for each metastases of cases 3 and 7 compared with the primary, along with corresponding HER-2/neu gene amplification ratios. Note the variable low-level amplification in MBC3, whereas the focal 2+ labeling by immunohistochemistry in MBC7 does not correlate with amplification. C, HER-2/neu assessment of selected individual tumor spots from MBC3 omental metastases 1 shows 2+ staining by immunohistochemistry and is amplified (ratio, 3). Brain metastases shows 1+ labeling by immunohistochemistry but is borderline amplified (ratio, 2).
Two cases (MBC1 and MBC5, both of which had predominant lobular morphology) were negative throughout all primary and metastatic samples for HER-2/neu protein overexpression (0-1+ labeling by immunohistochemistry). FISH analysis similarly showed no evidence of HER-2/neu gene amplification in any primary or metastatic sample from these cases.
Six cases (MBC2, MBC4, MBC6, MBC7, MBC8, and MBC10) were negative for HER-2/neu protein overexpression in most spots (0-1+ staining). Occasional metastatic spots from these cases showed equivocal (2+) staining. In five of these six cases, no spots, including those showing 2+ protein labeling, showed HER-2/neu gene amplification. Rare spots from the other case (MBC10) showed borderline gene amplification, with the remaining spots from this case being nonamplified. Nonetheless, the spots that were 2+ by immunohistochemistry were not the spots showing borderline gene amplification. Of note, rare cells in the MBC10 primary tumor showed marked HER-2/neu gene amplification (ratio of HER-2 neu gene/chromosome 17, 10). However, no such HER-2/neu gene–amplified cells were seen in the metastases.
Two cases (MBC3 and MBC9) showed equivocal (2+) HER-2/neu protein overexpression in most primary and metastatic foci, with rare spots being 1+ (negative). One of these cases (MBC9) showed no evidence of HER-2/neu gene amplification by FISH throughout. The other case, MBC3, showed variable low-level HER-2/neu gene amplification in different spots, with ratios ranging from 1.0 (negative) to 3.2 (positive; Fig. 2).
Fascin
All cases were completely negative in both PBC and MBC with the exception of MBC2, which was strongly positive for fascin in both PBC and all MBC. Interestingly, this was the one case with bulky lung metastasis. Eight of the nine negative cases had nonbulky lung metastases, which were fascin-negative. Peritumoral fibroblasts surrounding primary tumors and metastases labeled serving as an internal control for the negative cases.
EGFR
EGFR protein expression was absent in the primary and all metastases of six cases. The four cases that were EGFR positive (MBC2, MBC4, MBC7, and MBC10) qualified as basal-type carcinomas (ER-PR-Her2/neu-CK5/6+), as defined above. In all four cases, both the primary and all metastases labeled at least focally for EGFR; however, there was marked variation in EGFR protein expression between the primary and metastases and among different metastases in MBC2, MBC4, and MBC7. These results are summarized in Table 2. In MBC10, the primary was focally positive, whereas all metastases showed strikingly strong labeling (lung, hilar lymph nodes, liver, pericardium, adrenal, omentum; Fig. 3).
Table 2.
EGFR and MET immunohistochemistry and EGFR chromogenic in situ hybridization on basal-like breast carcinomas (MBC2, MBC4, MBC7, MBC10)
| Case | Site | EGFR IHC | EGFR CISH | MET IHC |
|---|---|---|---|---|
| MBC2 | Primary | 1+ | Focally amplified | 1+ |
| Axillary LN | 1+ | Not amplified | 1+ | |
| Bone | 1+ | Not amplified | 1+ | |
| Liver | 1+ | Not amplified | 1+ | |
| Adrenal | 1+ | Not amplified | 1+ | |
| Ovary | 1+ | Not amplified | 1+ | |
| Lung | 2+ | Not amplified | 1+ | |
| Diaphragm | 1+ | Not amplified | 1+ | |
| Abdominal LN | 2+ | Not amplified | 1+ | |
| MBC4 | Liver | 1+ | Focally amplified | 0 |
| Pericardium | 1+ | Not amplified | 2+ | |
| Lung | 2+ | Focally amplified | 1+ | |
| Adrenal | 2+ | Not amplified | 0 | |
| Bone | 2+ | Not amplified | 0 | |
| Small Bowel | 3+ | Amplified | 0 | |
| MBC7 | Primary | 1+ | Not amplified | 1+ |
| Axillary LN | 1+ | Not amplified | 2+ | |
| Mediastinal LN | 1+ | Not amplified | 1+ | |
| Diaphragm | 1+ | Not amplified | 2+ | |
| Bone | 1+ | Not amplified | 1+ | |
| Omentum | 1+ | Not amplified | 2+ | |
| Liver | 1+ | Not amplified | 1+ | |
| Right Adrenal | 1+ | Not amplified | 1+ | |
| Left Adrenal | 2+ | Not amplified | 1+ | |
| MBC10 | Primary | 1+ | Focally amplified | 1+ |
| Lung | 3+ | Focally amplified | 1+ | |
| Hilar LN | 3+ | Not amplified | 1+ | |
| Liver | 3+ | Not amplified | 1+ | |
| Pericardium | 3+ | Not amplified | 1+ | |
| Adrenal | 3+ | Not amplified | 1+ | |
| Omentum | 3+ | Not amplified | 1+ |
Abbreviations: IHC, immunohistochemistry; CISH, chromogenic in situ hybridization.
Fig. 3.
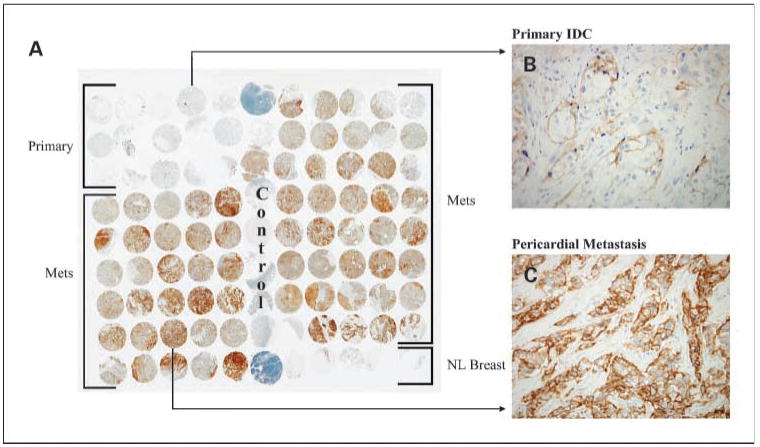
Striking EGFR protein up-regulation in metastases of MBC10. A, low power view of TMA labeled for EGFR protein by immunohistochemistry. Note the strong labeling of all metastases (rows 4-9, spots 1-5 and rows 1-8, spots 7-11) compared with normal breast (row 9, spots 7-11) and the primary infiltrating ductal carcinoma (rows 1-3, spots 1-5). B, individual spot of primary tumor, showing focal labeling for EGFR. C, individual spot of pericardial metastasis, showing diffuse labeling for EGFR.
By chromogenic in situ hybridization analysis, only focal subpopulations of carcinoma cells showed EGFR amplification with only partial concordance with EGFR immunoreactivity (Table 2). The exception was the small bowel metastasis of MBC4 that showed strong EGFR protein expression and EGFR amplification in the majority of the metastatic cells (Supplementary Fig. S2). Other tumor samples (i.e., the liver metastasis of MBC4, the primaries of MBC2 and MBC10) showed only focal subpopulations of tumor cells with EGFR amplification and only focal EGFR immunoreactivity. None of the metastases of MBC10, which showed strong immunoreactivity throughout, showed EGFR amplification, with the exception of foci of cells in the lung metastases.
Mesothelin
Mesothelin was focally expressed in 4 of 10 cases, including three of four basal-type cases (MBC2, MBC4, and MBC7) and one of six other cases (MBC6). All other cases were completely negative. No organ-specific pattern of expression was identified, as outlined in Supplementary Table S3.
Cox-2
Cox-2 was variably expressed in 8 of 10 cases. In five of these cases, expression in a subset of metastases was stronger than that of the primary tumor; however; labeling was focal and restricted only to this subset of metastases. In two cases (MBC9 and MBC10), labeling was strong in the primary tumor but diminished in metastases (Supplementary Table S4). Again, no evidence of an organ-specific pattern of expression was discerned.
MET
MET protein expression was also limited to the basal-type carcinomas; of the 10 cases tested, MBC2, MBC4, MBC7, and MBC10 were positive, whereas MBC1, MBC3, MBC5, MBC6, MBC8, and MBC9 were negative. Variable expression among metastases was noted, similar to the pattern noted with EGFR (Table 2).
Gene promoter methylation
Using a seven-gene panel, the cumulative methylation profiles of the dissected primaries and their metastases are illustrated in Fig. 4 and Supplementary Table S5. Several trends were evident. First, the methylation profile of the primary closely paralleled that of its metastases. Cases showing high levels of methylation in the primary (MBC1, MBC3, MBC5, MBC8, MBC9, and MBC10) generally featured high levels in metastases, and the gene methylation pattern among the seven genes was consistent between primary and metastases. However, between cases, there were notable differences in the extent of gene methylation. For example MBC2 showed increased methylation of only a single gene (Twist), in contrast to the multigene methylation of MBC1, MBC3, MBC5, MBC6, MBC7, MBC8, MBC9, and MBC10. Likewise, MBC4 was mainly hypermethylated for APC1. A progressive increase in methylation from primary to metastasis was not discerned. Second, methylation status did not always correlate with protein expression. For example, in this assay, methylation of ERα was minimal in all cases, regardless of ER protein expression by immunohistochemistry. Moreover, E-cadherin (CDH1) methylation, as detected by this assay, was minimal in the primary and all metastases of case 5, which showed variable E-cadherin protein expression correlating with metastases of ductal or lobular morphology (data not shown). Third, there seemed to be an association of low-level methylation and basal-type cancers. Three of the four carcinomas with low levels of methylation in the gene panel were basal-type cancers (MBC2, MBC4, and MBC7).
Fig. 4.
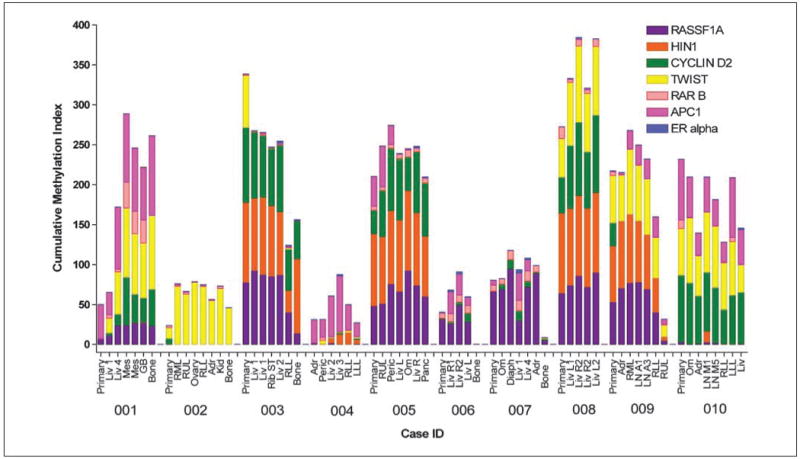
Cumulative promoter hypermethylation of RASSF1A, HIN1, CYCLIN D2, TWIST, RARβ, APC1, and ERα in lesions of primary and metastatic breast cancer. Scores for cumulative methylation were obtained by quantitative multiplex methylation-specific PCR assay in liver (Liv), mesentery (Mes), gall bladder (GB), bone, lung (RUL, lobes of right upper; RML, right middle; RLL, right lower; LLL, left lower), ovary, adrenal (Adr), kidney (Kid), rib soft tissue (ST), pericardium (Peric), omentum (Om), diaphragm (Diaph), and lymph node [LN; abdominal (A) and mediastinal (M)]. Quantitive multiplex methylation-specific PCR analysis of both unmethylated and methylated gene promoters was done. The percentage of methylation of each gene was calculated as 100 × [no. of copies methylated DNA/(no. of copies unmethylated + methylated DNA)]. The cumulative methylation index score was obtained as the sum of the percentage of methylation for each of the seven genes. Results are plotted as stacked bar graphs where the column height reflects the total cumulative methylation; for a maximum possible of 700 cumulative units (100% × 7 genes), the colored segment corresponding to the percentage of methylation of each gene color-coded in the top right legend. Ten patients (MBC1-MBC10) were evaluated. Data is also shown in Supplementary Table S5.
Discussion
We report a comprehensive analysis of breast cancer metastases by analyzing the full spectrum of metastatic lesions derived from 10 patients who died of metastatic breast cancer and underwent rapid autopsy. By comparing the primary neoplasms from these patients with their metastases and by comparing metastases from one site to another, we identified marked heterogeneity among breast cancer metastases, as well as markers which remained consistent among these lesions. Our results expand the existing body of knowledge regarding breast cancer metastases and have both biological and therapeutic implications.
With regard to distribution of metastases, we confirm the liver, bone, and lung as the most frequent sites of hematogenous dissemination. We also confirm the striking tendency of lobular carcinoma to metastasize to the gastrointestinal tract, as illustrated by cases MBC1 and MBC5. Case MBC5 is particularly instructive, as the invasive ductal carcinoma primary lost E-cadherin expression in most of its metastases, which showed lobular morphology and extensively involved the pancreas and stomach. We found the frequency of extensive adrenal involvement in our series to be surprising, because most oncologists associate adrenal metastases with pulmonary carcinoma and not breast carcinoma primaries (21). However, our study highlights the fertility of this soil for breast cancer. Whereas the lung was involved by microscopic disease in all but one case, it was the dominant site of disease in only one case (MBC2). Interestingly, this was the only case which expressed fascin, which has been implicated as a member of the lung metastases gene expression signature profile of breast carcinoma (4). These results generally support the work of Massagué et al. (3, 4, 22) and suggest that, whereas some genes may determine a breast cancer's overall classification and prognostic signature (i.e., basal-type, luminal type, HER-2/neu positive), still others (superimposed tissue-specific metastasis gene expression profile in a subset of tumor cells) may affect the cancer's metastatic distribution (i.e., lung metastatic virulence). Along these lines, MBC2 was one of four basal-type breast cancers in this study, yet none of the other three basal-type cancers expressed fascin and showed bulky lung metastases. However, the diffuse expression of fascin in the primary and all metastases of this case is difficult to reconcile with the concept that only a subset of tumor cells have this tissue-specific metastasis expression profile. Finally, the absence of sarcomatoid change in any of the metastases in these cases argues against the role of “epithelial-mesenchymal transition” in metastasis.
With regard to ERα and PR status, our study confirms the observation that one or more of these receptors may be lost when a PBC metastasizes, therefore resulting in resistance to endocrine therapy. Three of our carcinomas (MBC1, MBC3, and MBC6) lost one or both hormone receptors in their metastases. Importantly, however, in these three cases and in the three cases in which estrogen and PRs were retained in metastases, there was relative uniformity of expression of the hormone receptors between different metastases. We did not identify a case where hormone receptors were strongly expressed in one metastatic site, but not in another. These results have clinical and biological implications. First, in clinical practice, the hormone receptor status of a biopsy of one metastatic lesion should be an accurate reflection of the receptor status of all of that patient's metastatic lesions. Therefore, one should expect a relatively uniform response to endocrine therapy if a response is obtained. Second, our results suggest that the hormone receptor status of a breast cancer is a fundamental feature of the neoplasm, which is either retained throughout metastases or lost early in the course of neoplastic progression at the primary site, such that all metastases lack hormone receptor expression.
With regards to HER-2/neu status, the majority of our cases did not show evidence of HER-2/neu gene amplification or protein overexpression by FISH or immunohistochemistry, respectively. We encountered six cases which were largely negative by immunohistochemistry, but from which some metastases showed equivocal immunoreactivity for HER-2/neu (2+ labeling). Importantly, these focal areas of labeling did not correlate with HER-2/neu gene amplification, suggesting that they likely represent artifactual variations in immunohistochemical labeling based upon factors such as tissue preservation, and likely do not reflect tumor biology. These results emphasize the importance of FISH analysis of breast cancers showing only focal or weak immunoreactivity for HER-2/neu and that the majority of these neoplasms do not show HER-2/neu gene amplification (23). The significance of the scattered cells in the primary of MBC10 showing high-level (10-fold) HER-2/neu gene amplification is unclear. These cells were not seen in metastases and may represent a subclone with such unstable genetic composition that it was incapable of metastases.
Importantly, we documented that HER-2/neu amplification does not routinely occur in metastases of HER-2/neu negative cases. This result might have been expected, because MBCs generally show similar gene expression profiles to their primaries (i.e., luminal A neoplasms do not become basal-like neoplasms in their metastases, etc.; refs. 2, 24). However, we learned from MBC3 that carcinomas with low (borderline) amplification of HER-2/neu may show some variation in metastases, such that amplification ratios may span the existing published cutoffs for negative and positive. Whether these tumors respond to therapy (i.e., trastuzumab) like highly amplified tumors is not clear, although it seems unlikely. Further clinical experience is required to determine the significance of such low-level amplification; however, our results show that some metastases from a primary carcinoma showing borderline amplification may show slightly higher levels of amplification, such that a trial of trastuzumab therapy may be worthwhile. It is of interest that this carcinoma (MBC3) lost PR in its metastases. A large body of work suggests that up-regulation of intracellular signaling pathways mediated by tyrosine kinases, such as EGFR and HER-2/neu, may affect loss of PR expression in breast cancer and cause resistance to selective estrogen receptor modulators, such as tamoxifen (25–27). Perhaps the variable up-regulation of the tyrosine kinase activity of HER-2/neu in the metastases of MBC3 played some role in the loss of PR.
In our series, overexpression of EGFR and MET receptor tyrosine kinases was restricted to basal-like–type breast cancers, and variable overexpression in metastases was noted. The variable up-regulation of EGFR and MET expression that we identified has therapeutic implications, in that it suggests that metastases may be more sensitive to therapies directed against these tyrosine kinases than a primary tumor may be. Also, it suggests that different metastases may respond differently to therapies directed against these targets. It should be noted that, thus far, EGFR targeted therapies have not been useful in basal-like carcinomas. However, the possibility of synergistically combining targeted anti-EGFR therapy with other therapies directed against molecularly defined targets remains attractive. The mechanism of up-regulation and variable expression of EGFR and MET in metastases is not clear. EGFR amplification does not account for all of the up-regulation of EGFR expression seen in these cases because it was infrequent and heterogeneous in the different tumors. Other possible mechanisms include increased EGFR mRNA transcription or stabilization of transcripts and diminished protein turnover.
Similar to the results with EGFR and MET, the variable expression of Cox-2 and mesothelin in our cases raises the possibility of variable response toward treatments directed against these targets. Importantly, both proteins were only focally and often weakly expressed in the primaries and metastases that were at all positive for these markers, suggesting that they are not attractive therapeutic targets. In fact, we documented down-regulation of Cox-2 expression in the metastases in two of our cases (MBC9 and MBC10). Unlike EGFR and MET, expression of these markers was not restricted to a type of cancer, although we do note that Cox-2 was expressed in all basal-type cancers in this study, in addition to other cases. In addition, we did not see expression restricted to a specific metastatic site with these markers. This is particularly significant because Cox-2 expression has been implicated in the pathogenesis of bone metastases of breast cancer (14). Importantly, we did not see up-regulation of Cox-2 expression specific to bone metastases, and the bone metastases of several cases (MBC3, MBC4, MBC5, and MBC7) did not show Cox-2 expression.
Little is known about the methylation profile of metastases compared with the matched primary tissue, whereas multigene methylation in breast primary tumors has been well-documented (28, 29). Performing quantitative multiplex methylation-specific PCR analysis, a quantitative analysis, allowed us to determine frequency and extent (intensity) of methylation in each sample, as well as to determine the cumulative amount of methylation of genes within our panel. We were initially surprised at the similarity of the methylation profiles of our primary tumors with their paired metastases because we expected to see greater numbers of genes methylated in metastases than in the matched primary lesion. In fact, we found dissected primary and secondary lesions were methylated at the same frequency, although the intensity of methylation was often higher in metastatic lesions compared with the matched primary. Other published data (30, 31) had suggested that methylation incidence increases progressively when one compares carcinoma in situ to invasive carcinoma to metastatic lesions. Indeed, these prior studies, using a binary determination from a nonquantitative methylation-specific PCR, have for the most part shown a higher frequency of methylation in metastases versus unmatched primaries, which may be due in part to a higher level of methylation within metastatic lesions. However, our finding that the methylation profiles between primary and metastatic lesions were similar should not be surprising given that the gene expression profiles of metastases have been shown to be generally similar to that of PBCs (2, 24). Because promoter methylation contributes to the expression profile of a cancer, it is therefore not surprising that the methylation profile of the cancer would not change during metastases. These results also support the concept that a cancer's genetic makeup and therefore its clinical behavior are likely determined at its primary site, before metastases has evolved (32). We also noted certain exceptions to the findings of multigene methylation. Single-gene methylation was evident in one case, MBC2, that was highly methylated only for Twist. We are uncertain of the meaning of this observation.
In summary, we report analysis of a series of 10 rapid autopsies of patients who succumbed to MBC. Analysis of the markers reported shows variation that has clinical, biological, and therapeutic implications. Further studies of this unique resource should provide further insights as to metastatic progression of breast carcinoma.
Acknowledgments
We thank Marina Asher (Memorial Sloan-Kettering Cancer Center) for technical assistance and thank the 10 patients and their families who participated in the study. We and they hope to turn their tragedy into hope for others who suffer.
Grant support: Department of Defense Center of Excellence W81XWH-04-1-0595, NIH P50 CA88843, Belfer Foundation, and Avon Foundation.
Footnotes
Note: Supplementary data for this article are available at Clinical Cancer Research Online (http://clincancerres.aacrjournals.org/).
References
- 1.Paget S. The distribution of secondary growths in cancer of the breast. Cancer Metastasis Rev. 1989;8:98–101. [PubMed] [Google Scholar]
- 2.Weigelt B, Glas AM, Wessels LF, Witteveen AT, Peterse JL, van't Veer LJ. Gene expression profiles of primary breast tumors maintained in distant metastases. Proc Natl Acad Sci U S A. 2003;100:15901–5. doi: 10.1073/pnas.2634067100. [DOI] [PMC free article] [PubMed] [Google Scholar]
- 3.Kang Y, Siegel PM, Shu W, et al. A multigenic program mediating breast cancer metastasis to bone. Cancer Cell. 2003;3:537–49. doi: 10.1016/s1535-6108(03)00132-6. [DOI] [PubMed] [Google Scholar]
- 4.Minn AJ, Gupta GP, Siegel PM, et al. Genes that mediate breast cancer metastasis to lung. Nature. 2005;436:518–24. doi: 10.1038/nature03799. [DOI] [PMC free article] [PubMed] [Google Scholar]
- 5.Al-Hajj M, Wicha MS, Benito-Hernandez A, Morrison SJ, Clarke MF. Prospective identification of tumorigenic breast cancer cells. Proc Natl Acad Sci U S A. 2003;100:3983–8. doi: 10.1073/pnas.0530291100. [DOI] [PMC free article] [PubMed] [Google Scholar]
- 6.Liu S, Dontu G, Wicha MS. Mammary stem cells, self-renewal pathways, and carcinogenesis. Breast Cancer Res. 2005;7:86–95. doi: 10.1186/bcr1021. [DOI] [PMC free article] [PubMed] [Google Scholar]
- 7.Clarke MF, Fuller M. Stem cells and cancer: two faces of eve. Cell. 2006;124:1111–5. doi: 10.1016/j.cell.2006.03.011. [DOI] [PubMed] [Google Scholar]
- 8.Nielsen TO, Hsu FD, Jensen K, et al. Immunohistochemical and clinical characterization of the basal-like subtype of invasive breast carcinoma. Clin Cancer Res. 2004;10:5367–74. doi: 10.1158/1078-0432.CCR-04-0220. [DOI] [PubMed] [Google Scholar]
- 9.Perou CM, Sorlie T, Eisen MB, et al. Molecular portraits of human breast tumours. Nature. 2000;406:747–52. doi: 10.1038/35021093. [DOI] [PubMed] [Google Scholar]
- 10.Sorlie T, Perou CM, Tibshirani R, et al. Gene expression patterns of breast carcinomas distinguish tumor subclasses with clinical implications. Proc Natl Acad Sci U S A. 2001;98:10869–74. doi: 10.1073/pnas.191367098. [DOI] [PMC free article] [PubMed] [Google Scholar]
- 11.Camp RL, Rimm EB, Rimm DL. Met expression is associated with poor outcome in patients with axillary lymph node negative breast carcinoma. Cancer. 1999;86:2259–65. doi: 10.1002/(sici)1097-0142(19991201)86:11<2259::aid-cncr13>3.0.co;2-2. [DOI] [PubMed] [Google Scholar]
- 12.Davies G, Salter J, Hills M, Martin LA, Sacks N, Dowsett M. Correlation between cyclooxygenase-2 expression and angiogenesis in human breast cancer. Clin Cancer Res. 2003;9:2651–6. [PubMed] [Google Scholar]
- 13.Costa C, Soares R, Reis-Filho JS, Leitao D, Amendoeira I, Schmitt FC. Cyclo-oxygenase 2 expression is associated with angiogenesis and lymph node metastasis in human breast cancer. J Clin Pathol. 2002;55:429–34. doi: 10.1136/jcp.55.6.429. [DOI] [PMC free article] [PubMed] [Google Scholar]
- 14.Hiraga T, Myoui A, Choi ME, Yoshikawa H, Yoneda T. Stimulation of cyclooxygenase-2 expression by bone-derived transforming growth factor-β enhances bone metastases in breast cancer. Cancer Res. 2006;66:2067–73. doi: 10.1158/0008-5472.CAN-05-2012. [DOI] [PubMed] [Google Scholar]
- 15.Hashimoto Y, Skacel M, Adams JC. Roles of fascin in human carcinoma motility and signaling: prospects for a novel biomarker? Int J Biochem Cell Biol. 2005;37:1787–804. doi: 10.1016/j.biocel.2005.05.004. [DOI] [PubMed] [Google Scholar]
- 16.Argani P, Iacobuzio-Donahue C, Ryu B, et al. Mesothelin is overexpressed in the vast majority of ductal adenocarcinomas of the pancreas: identification of a new pancreatic cancer marker by serial analysis of gene expression (SAGE) Clin Cancer Res. 2001;7:3862–8. [PubMed] [Google Scholar]
- 17.Hassan R, Bera T, Pastan I. Mesothelin: a new target for immunotherapy. Clin Cancer Res. 2004;10:3937–42. doi: 10.1158/1078-0432.CCR-03-0801. [DOI] [PubMed] [Google Scholar]
- 18.Bhargava R, Gerald WL, Li AR, et al. EGFR gene amplification in breast cancer: correlation with epidermal growth factor receptor mRNA and protein expression and HER-2 status and absence of EGFR-activating mutations. Mod Pathol. 2005;18:1027–33. doi: 10.1038/modpathol.3800438. [DOI] [PubMed] [Google Scholar]
- 19.Fackler MJ, McVeigh M, Mehrotra J, et al. Quantitative multiplex methylation-specific PCR assay for the detection of promoter hypermethylation in multiple genes in breast cancer. Cancer Res. 2004;64:4442–52. doi: 10.1158/0008-5472.CAN-03-3341. [DOI] [PubMed] [Google Scholar]
- 20.Fackler MJ, Malone K, Zhang Z, et al. Quantitative multiplex methylation-specific PCR analysis doubles detection of tumor cells in breast ductal fluid. Clin Cancer Res. 2006;12:3306–10. doi: 10.1158/1078-0432.CCR-05-2733. [DOI] [PubMed] [Google Scholar]
- 21.Horak CE, Steeg PS. Metastasis gets site specific. Cancer Cell. 2005;8:93–5. doi: 10.1016/j.ccr.2005.07.013. [DOI] [PubMed] [Google Scholar]
- 22.Minn AJ, Kang Y, Serganova I, et al. Distinct organ-specific metastatic potential of individual breast cancer cells and primary tumors. J Clin Invest. 2005;115:44–55. doi: 10.1172/JCI22320. [DOI] [PMC free article] [PubMed] [Google Scholar]
- 23.Wolff AC, Hammond ME, Schwartz JN, et al. American Society of Clinical Oncology/College of American Pathologists guideline recommendations for human epidermal growth factor receptor 2 testing in breast cancer. Arch Pathol Lab Med. 2007;131:18. doi: 10.5858/2007-131-18-ASOCCO. [DOI] [PubMed] [Google Scholar]
- 24.van't Veer LJ, Dai H, van de Vijver MJ, et al. Gene expression profiling predicts clinical outcome of breast cancer. Nature. 2002;415:530–6. doi: 10.1038/415530a. [DOI] [PubMed] [Google Scholar]
- 25.Fuqua SA, Cui Y, Lee AV, Osborne CK, Horwitz KB. Insights into the role of progesterone receptors in breast cancer. J Clin Oncol. 2005;23:931–2. doi: 10.1200/JCO.2005.05.152. author reply 2–3. [DOI] [PubMed] [Google Scholar]
- 26.Schiff R, Massarweh SA, Shou J, et al. Advanced concepts in estrogen receptor biology and breast cancer endocrine resistance: implicated role of growth factor signaling and estrogen receptor coregulators. Cancer Chemother Pharmacol. 2005;56 1:10–20. doi: 10.1007/s00280-005-0108-2. [DOI] [PubMed] [Google Scholar]
- 27.Arpino G, Weiss H, Lee AV, et al. Estrogen receptor-positive, progesterone receptor-negative breast cancer: association with growth factor receptor expression and tamoxifen resistance. J Natl Cancer Inst. 2005;97:1254–61. doi: 10.1093/jnci/dji249. [DOI] [PubMed] [Google Scholar]
- 28.Fackler MJ, McVeigh M, Evron E, et al. DNA methylation of RASSF1A, HIN-1, RAR-β, cyclin D2 and Twist in in situ and invasive lobular carcinoma. Int J Cancer. 2003;107:970–5. doi: 10.1002/ijc.11508. [DOI] [PubMed] [Google Scholar]
- 29.Widschwendter M, Jones PA. DNA methylation and breast carcinogenesis. Oncogene. 2002;21:5462–82. doi: 10.1038/sj.onc.1205606. [DOI] [PubMed] [Google Scholar]
- 30.Nass SJ, Herman JG, Gabrielson E, et al. Aberrant methylation of the estrogen receptor and E-cadherin 5′ CpG islands increases with malignant progression in human breast cancer. Cancer Res. 2000;60:4346–8. [PubMed] [Google Scholar]
- 31.Mehrotra J, Vali M, McVeigh M, et al. Very high frequency of hypermethylated genes in breast cancer metastasis to the bone, brain, and lung. Clin Cancer Res. 2004;10:3104–9. doi: 10.1158/1078-0432.ccr-03-0118. [DOI] [PubMed] [Google Scholar]
- 32.Ramaswamy S, Ross KN, Lander ES, Golub TR. A molecular signature of metastasis in primary solid tumors. Nat Genet. 2003;33:49–54. doi: 10.1038/ng1060. [DOI] [PubMed] [Google Scholar]