


Abstract
YOYO-1 is a fluorescent dye widely used for probing the statistical–mechanical properties of DNA. However, currently contradicting data exist how YOYO-1 binding alters the DNA structure and rigidity. Here, we systematically address this problem using magnetic tweezers. Remarkably, we find that the persistence length of DNA remains constant independent of the amount of bound YOYO-1, which contrasts previous assumptions. While the ionic conditions can considerably alter the stability of YOYO-1 binding, the DNA bending rigidity seems not to be affected. We furthermore determine important structural parameters such as the binding site size, the elongation, as well as the untwisting angle per bound YOYO-1 molecule. We expect that our assay, in which all the parameters are determined within a single experiment, will be beneficial for a large range of other DNA binding drugs.
INTRODUCTION
Single-molecule fluorescence microscopy has become an extremely versatile tool to explore the statistical–mechanical properties of DNA duplexes and their influence on transport (1), stretching in liquid flow (2) and in confined geometries (3), entropic recoiling (4), self-diffusion in 2D (5) and electrophoresis of DNA (6).
One of the most commonly used dyes to fluorescently stain the DNA in such experiments is the bis-intercalator YOYO-1. It exhibits a high association constant and a strong fluorescence enhancement upon binding to double-stranded DNA (dsDNA), thus providing high signal-to-noise ratios (7). Intercalating dyes, however, are known to heavily affect both the mechanical and structural properties of DNA (8). Surprisingly, despite being crucial for the interpretation of the above-mentioned experiments, there exists only little systematic data but rather some controversy about the influence of YOYO-1 intercalation on the DNA properties.
For the persistence length (lP), which is a crucial mechanical parameter characterizing the molecule's bending rigidity, widespread values can be found in case of YOYO-1-stained DNA. Many authors refer to results reported for the related dye TOTO-1 (3), and assume a linear increase of the persistence length from ∼50 nm up to ∼65 nm with increasing staining ratio (Rs, defined as the number of added YOYO-1 molecules per DNA base pairs). However, recently values ranging from 12 nm to 30 nm have been reported from single-molecule force-extension measurements (9,10).
Beyond affecting the DNA bending rigidity, YOYO-1 intercalation causes DNA elongation and untwisting. Generally, it is assumed that the contour length (L) of dsDNA complexed with YOYO-1 (further on denoted as YOYO–DNA) increases linearly with increasing staining ratio by up to 35% compared to native DNA (9,11). In recent force-extension measurements (10), however, large amounts of free YOYO-1 in solution were required to achieve a significant DNA elongation, and the affinity of YOYO-1 was found to be highly force dependent. For YOYO-1-induced DNA untwisting, an angle of 106° per bis-intercalated YOYO-1 has been revealed in NMR measurements (12). Although the atomic structure of the YOYO–DNA complex is not known yet, the NMR-derived value for the untwisting angle seems to be rather high since it would correspond to an almost complete untwisting for a YOYO-1-saturated DNA molecule.
Therefore, despite numerous previous studies (3,9–11), a consistent picture of how YOYO-1 binding changes the mechanical and structural properties of DNA has not been established yet. This is mainly due to the application of different solution conditions and experimental techniques. Given the importance of YOYO-1 for studying the statistical–mechanical properties of DNA, here we aim to obtain a clear-cut characterization of YOYO-1-stained DNA under well-defined conditions and, thus, to provide a reference guide for future experiments. In particular, we systematically investigate the influence of YOYO-1 on the persistence and contour length, as well as on the untwisting of dsDNA over a large range of staining ratios. Our investigations are carried out in solutions with moderate ionic strength, which support stable and stoichiometric YOYO-1 binding. We use magnetic tweezers (Figure 1a, Inset) (13,14) to stretch and twist single DNA molecules in a controlled manner and measure the force-dependent molecule extension. This allows us to obtain all the above-mentioned properties simultaneously in a single experiment, which ensures the acquisition of highly consistent data sets. Previous force-extension measurements have been carried out on forces being >10 pN, which stimulates additional YOYO-1 intercalation and DNA elongation (9,10). In our magnetic tweezers setup much smaller forces (0.1–10 pN) can be applied, at which, for appropriately chosen ionic strength, exclusively the entropic forces from bending fluctuations are probed. This allows us to characterize YOYO–DNA without affecting the binding equilibrium.
Figure 1.

Force-extension measurements. (a) Force-extension curves of native DNA (filled black circles) and YOYO–DNA (filled green circles) at 1.4 dye / bp with fits to the WLC model (solid lines) providing persistence lengths of 54±3 nm and 56±3 nm, and contour lengths of 3.82±0.01 μm and 5.56±0.02 μm, respectively. (Inset) Sketch of the experimental setup. (b) Force-extension behavior of YOYO–DNA (0.1 dye / bp), measured in 10 mM (line connecting filled blue circles), 100 mM (line connecting filled red circles) and 500 mM phosphate buffer (line connecting filled gray circles). (Inset) Time traces recorded after rapidly changing the force from 0.06 to 5.9 pN. The time axis represents the period after the abrupt force change has occurred. Colors are as in the main image.
MATERIALS AND METHODS
DNA preparation
For the force-extension measurements, we prepared torsionally unconstrained DNA molecules which carried a single biotin at one end and a single digoxigenin at the other end to allow the attachment to streptavidin-coated magnetic beads and the antidigoxigenin-coated flow cell, respectively. A 11.3-kb long plasmid DNA was linearized by digesting it at the unique PpuMI site. A single biotin and digoxigenin was then introduced at either end by filling in the 5′-overhangs using Klenow polymerase with a mixture of Biotin-14-dATP, Dig-11-dUTP, dCTP and dGTP. Since the PpuMI site is asymmetric, Biotin-14-dATP is exclusively incorporated at one end, whereas Dig-11-dUTP is exclusively incorporated at the other end of the DNA fragment.
For the twisting experiments, a different functionalization procedure was applied to inhibit free rotation of the bound DNA ends. The same plasmid DNA was digested at the unique SacI and PciI sites producing a 10.9-kb long DNA fragment. This fragment was ligated at the corresponding ends to an approximately 600-bp long PCR fragment containing either approximately 20 biotin-modified bases and a single PciI overhang, or approximately 20 digoxigenin-modified bases and a single SacI overhang. For the two differently functionalized constructs, force-extension measurements revealed no difference in the contour length of rotationally relaxed molecules within an error of 3% (data not shown). Unmodified DNA, used to obtain a constant DNA background concentration, was prepared from the same plasmid by linearizing it at a unique XbaI site.
DNA staining and destaining
DNA was stained with YOYO-1 as described elsewhere (6). A 1 mM YOYO-1 stock solution (Invitrogen Y3601) was diluted 400- to 6700-fold in 10 mM phosphate buffer (sodium phosphate buffer: 1.88 mM NaH2PO4·H2O, 8.13 mM Na2HPO4·2H2O, resulting in a pH of 7.5) depending on the desired final staining ratio. An ∼10-fold smaller volume of DNA was added to provide a final DNA concentration of 0.56 ng μl−1 corresponding to a base pair concentration of 860 nM. The DNA was either a mixture of unmodified and a small amount of modified molecules (used later on for tethering the DNA to magnetic beads and the flow cell) or unmodified DNA only (used later on for flushing). The mixture of YOYO-1 and DNA was incubated for 2 h at 50°C to achieve homogeneous staining of all molecules (6).
During the DNA twisting experiments, YOYO–DNA was destained within the magnetic tweezers setup by flushing the flow cell with a 1 M sodium chloride solution and, subsequently, with 10 mM phosphate buffer. We note that, during destaining we did not aim to remove all bound dye at once, but rather intended a partial, stepwise removal. This allowed us to obtain the correlation between DNA untwisting and molecule shortening in repetitive cycles of destaining.
Force-extension measurements using magnetic tweezers
The basic magnetic tweezers protocol has been described elsewhere (14,15). A flow cell, whose bottom coverslip was coated with anti-digoxigenin, was first flushed with a solution of unmodified background YOYO–DNA. Subsequently, modified YOYO–DNA was bound to 1 μm streptavidin-coated superparamagnetic microspheres (MyOne, Invitrogen) and flushed into the flow cell. Unbound magnetic beads were removed by flushing the flow cell again with a solution of unmodified YOYO–DNA. We recorded force-extension curves for forces <10 pN (14). Fitting of the curves with the worm-like chain (WLC) model provided the persistence and contour length of YOYO–DNA (see Figure 1a) (16). DNA length and force measurements were calibrated as described (13,14). Throughout these experiments, the amount of unmodified background YOYO–DNA was preserved to ensure a constant staining ratio during the whole experiment.
Analysis of the elongation data
The dependence of the fractional elongation on the staining ratio Rs was analyzed using either a simple two-line fit (see ‘Results’ section and Figure 2a) or the model developed by McGhee and von Hippel (see Results and Figure 2b). The model of McGhee and von Hippel (17) includes the binding equilibrium and describes binding isotherms of DNA ligands that obey the neighbor exclusion principle. In the absence of cooperative ligand binding, the following equation is obtained:
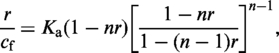 |
(1) |
where n is the binding site size in base pairs, r the ratio between the concentrations of bound dye, cb, and DNA base pairs, cDNA, and cf the concentration of free, i.e. not bound dye.
Figure 2.

Dependence of the DNA elongation on the staining ratio Rs. (a) Fractional elongation γ, defined as the increase in contour length due to labeling normalized by the length of the unlabeled molecule, plotted over Rs (open circles). Data were fit with a simple two-line model assuming an initial linear increase below the critical staining ratio  followed by a saturation at γsat (orange solid line). This provided
  = 0.31±0.06 dye/bp and γsat = 0.47±0.02. (b) Experimental data from (a) with fits (lines) to the model of McGhee and von Hippel [Equation (2)] for different association constants Ka. Fitting results are summarized in Table 1. The data were best fit (orange dashed line) for Ka = 1.4 × 10⁹ M−1,
  = 0.31 dye/bp and γsat = 0.50.
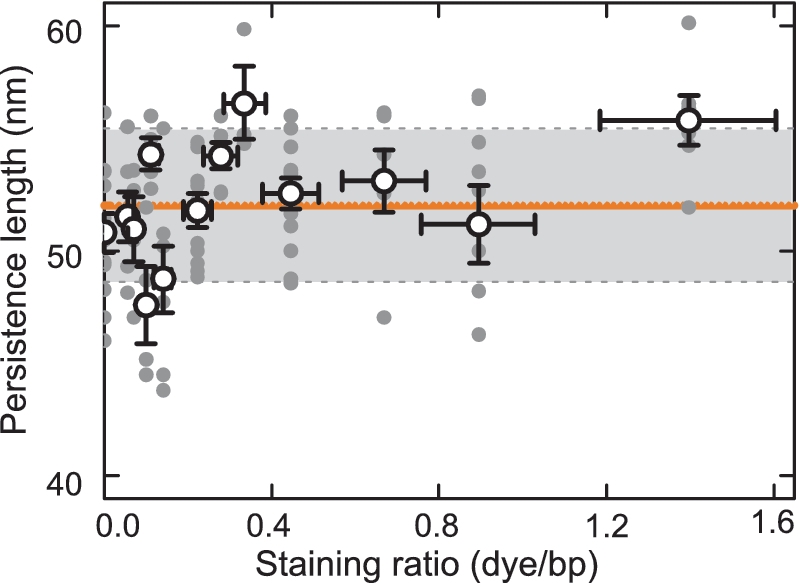
We convert Equation (1) to obtain a relation between the fractional elongation, γ = (L − L0)/L0, and the staining ratio, Rs = cT/cDNA, with cT being the total dye concentration and L and L0 denoting the contour length of the dye labeled and unlabeled molecule, respectively. We replace cf by cf = cT − cb = cT − r · cDNA. Furthermore, we substitute r by r = γ Δ, with Δ = δbp/δYOYO and δbp being the rise parameter per DNA base pair of 0.34 nm and δYOYO the DNA elongation per bound YOYO-1 molecule. Subsequently, we solve the substituted equation for cT from which we obtain an expression for Rs after division with cDNA (18):
 |
(2) |
Since Equation (2) cannot be inverted analytically, we programmed a fitting routine using LabVIEW (National Instruments Inc.) where Equation (2) is numerically inverted (19). The direct fitting of the elongation data as function of Rs provides higher confidence for the maximum fractional elongation as well as a direct assessment of the fit errors (19).
RESULTS
In order to probe the bending rigidity and the YOYO-1-induced DNA elongation, we applied magnetic tweezers to record force-extension curves where the DNA end-to-end distance is measured as a function of the applied stretching force (see Figure 1a and ‘Materials and Methods’ section). The persistence length and the contour length of the DNA can then be determined by fitting the curves recorded with the WLC model (Figure 1a) (16). We used 11.3-kb long DNA probe molecules with modified ends, which were incubated with YOYO-1 (6) in the presence of unmodified background DNA of the same length adjusting the DNA base pair concentration to 860 nM. Throughout these experiments, the amount of labeled background YOYO–DNA was kept constant to ensure the same staining ratio during the whole experiment.
Stability of the YOYO–DNA complex
We first investigated whether the stability of the YOYO–DNA complex depends on the ionic strength of the solution. We carried out force-extension measurements at a staining ratio of 0.1 dye/bp in 10, 100 and 500 mM solutions of phosphate buffer, which at pH 7.5 contain 18, 180 and 900 mM sodium ions, respectively. These experiments revealed that the association of YOYO-1 is highly salt dependent (see Figure 1b).
With increasing ionic strength, the YOYO–DNA appeared shorter indicating reduced YOYO-1 binding. Also the YOYO-1 binding kinetics seemed to be affected. While binding was stable at 10 mM phosphate buffer, the force-extension curves exhibited a hysteresis at 100 mM phosphate buffer, depending on the direction in which the force curves were recorded (Figure 1b). Also upon abrupt force changes, slowly developing length changes were seen (Figure 1b, Inset) at this ionic strength, indicating a force-dependent intercalation (9). At 500 mM phosphate buffer, the strongly reduced dye binding was accompanied by length fluctuations, likely arising from fast dye dissociation–association. These results suggest that YOYO-1 binding to DNA becomes stronger and more durable with decreasing ionic strength. In 10 mM phosphate buffer, it was found to be so strong that the DNA extension did not significantly vary upon complete removal of the background DNA over a duration of several hours.
Force-induced dye intercalation can have a severe impact on the force-extension behavior (9,10,18,20) since the DNA contour length changes with applied force. In this case, the persistence length and the contour length at zero force can only be obtained after additional corrections, which require a detailed knowledge about the force-dependent binding equilibrium. For simplicity however, this was typically neglected in literature, which can lead to erroneous values (see ‘Discussion’ section). In order to avoid such complications, we studied the force-extension behavior of YOYO–DNA in 10 mM phosphate buffer (unless indicated) and forces <10 pN, where the YOYO–DNA complex is stable and force-dependent intercalation is negligible.
Fractional elongation
We recorded force-extension data of YOYO–DNA for staining ratios between 0 dye/bp and 1.4 dye/bp and obtained persistence and contour length (Figure 2a). From the latter, we calculated the fractional DNA elongation, γ, defined as the increase in contour length due to labeling normalized by the length of the unlabeled molecule. Below the critical staining ratio  , the fractional elongation increased linearly with the staining ratio while it became saturated above it. A simple two-line fit provides
  = 0.31±0.06 dye/bp and for the fractional elongation at saturation γsat = 0.47±0.02. The appearance of an abrupt saturation at
  indicates that for staining ratios below
  practically all YOYO-1 from the solution is bound to the DNA. In this case, 1/
 is the minimum binding-site size of YOYO-1 of n = 3.2±0.6 bp/dye and γsat/
 provides the DNA elongation per intercalated YOYO-1 molecule of δYOYO = 1.5±0.4 bp/dye corresponding to 0.51±0.14 nm/dye. The simple two-line fit is only applicable if the concentrations of both YOYO-1 and DNA base pairs are much higher than the reciprocal value of the association constant Ka of the YOYO–DNA complex. Given published values for Ka of 1010–1012 M−1 in ‘low salt buffers’, (7) and the abrupt saturation of the DNA elongation, the latter condition should be satisfied.
However, in order to directly verify that the simple approach is applicable, we fitted our data with the model of McGhee and von Hippel (17), which includes the binding equilibrium as well as binding site exclusion (see, ‘Materials and Methods’ section). We obtained n = 3.2 bp for the binding site size and δYOYO = 1.6 bp (0.54 nm) for the elongation per bound YOYO molecule (Figure 2b). Both values are in good agreement with the values obtained from the two-line fit. Also, we obtain the association constant Ka = 1.4 × 10⁹ M−1, which is within an order of magnitude in agreement with previously published values (7). The difference between the derived and the reported values might be caused by the observed dependence of YOYO-1 association on the ionic strength. In addition, at the concentrations of DNA and YOYO-1 used in our experiments, which are much higher than 1/Ka, the confidence for Ka is rather low. In order to illustrate this, we fitted the data for fixed values of Ka between 107 and 1010 M−1 (Figure 2b). Table 1 summarizes the obtained parameters as well as the residues. For values of Ka of 108 M−1 and higher, the data is well fitted. Only at Ka = 107 M−1 significant deviations occur, which can be also seen in a markedly increased residue. Therefore, our data are in agreement with Ka ≥ 108 M−1.
Table 1.
Parameters obtained from fitting the elongation data with the model of McGhee and von Hippel
| Ka | n | δYOYO | δYOYO | Residue |
|---|---|---|---|---|
| (M−1) | (bp) | (bp) | (nm) | |
| 107 | 3.57 | 2.27 | 0.77 | 0.0021374 |
| 108 | 3.21 | 1.73 | 0.59 | 0.0013988 |
| 109 | 3.21 | 1.60 | 0.55 | 0.0012777 |
| 1.4 × 10⁹ | 3.22 | 1.60 | 0.54 | 0.0012768 |
| 1010 | 3.24 | 1.57 | 0.53 | 0.0012925 |
Ka denotes the association constant of YOYO-1 to DNA, n the binding sites size and δYOYO the elongation per bound YOYO-1 molecule.
Persistence length
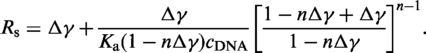
While the DNA elongation showed a strong dependence on the amount of YOYO-1 bound, the persistence length did—within an error of ±3 nm—not reveal any systematic change over the whole range of applied staining ratios of up to 1.4 dye/bp (Figure 3). This is in stark contrast to previous reports (3,9,10).
Figure 3.
Dependence of the persistence length on the staining ratio. Filled gray circles represent values from individual molecules, open circles the average value of the persistence length at the particular staining ratio and the solid orange line the average value over all molecules. The gray box displays the standard deviation of the global average. A total of 85 molecules was characterized with 3–12 molecules considered at each staining ratio.
We obtained a mean value over all measured staining ratios of 52±1 nm, which is in excellent agreement with the value for native dsDNA in 10 mM phosphate buffer of 51±2 nm (16).
In previous studies, where much lower values for the persistence length of YOYO–DNA have been reported, solution conditions with higher ionic strength have been applied (9,10). We therefore carried out force-extension measurements in 100 mM phosphate buffer in order to evaluate whether our results are specific only to moderate ion concentrations. In the presence of elevated amounts of monovalent ions, the force-extension behavior is affected by force-dependent elongation of the DNA due to additional intercalation (Figure 1b). In 100 mM phosphate buffer at pH 7.5 (corresponding to 180 mM sodium ions), it takes around 50 s for the YOYO–DNA length to equilibrate upon sudden force changes (Inset in Figure 1b). Significant length changes are detected for forces ranging between 0.7 pN and 6 pN.
In order to obtain meaningful force-extension data at elevated ionic strength, we applied a modified procedure that corrects for force-induced intercalation: for each force point, we let the DNA equilibrate at low force (∼0.06 pN). Then, while continuously recording the DNA length, the force was rapidly changed to its nominal value. In order to extract the DNA length at the nominal force without additional force-induced intercalation, we linearly extrapolated the measured DNA lengths for forces >0.7 pN within a ∼5 s window to the time directly after the force jump has occurred (Figure 4a). Figure 4b depicts force-extension curves that were plotted for the equilibrium and the corrected DNA length. Only for the latter, the data can be fit by the WLC model and we obtain for Rs = 0.2 dye/bp a persistence length of 48±2 nm and a contour length of 4.14±0.01 μm for a total of four molecules. Therefore, the persistence length appears within error to be conserved also at elevated ionic strength, where YOYO-1 binding is less stable. However, if possible, conditions that support stable ligand association and do not require additional error-prone corrections should be preferred since they allow a direct and more precise acquisition of force-extension data.
Figure 4.

Force-extension behavior of YOYO–DNA in 100 mM phosphate buffer at Rs = 0.2 dye/bp. (a) Time traces monitoring the change in DNA extension upon a sudden force increase from 0.06 pN to the nominal force (see legend). At elevated forces, the DNA extension continuously increases over the duration of many seconds due to force-induced intercalation. Linear fits to obtain the DNA extension prior additional intercalation occurs (see text) are shown as orange lines. (b) Force-extension curve for the equilibrated (open circles) and the for additional intercalation corrected (filled circles) DNA extension. The orange solid line represents a fit with the WLC model to the corrected data, providing lP = 50±1 nm and L = 4.15±0.01 μm.
YOYO-1-induced untwisting
We also investigated the YOYO-1-induced untwisting of dsDNA (Figure 5). Magnetic tweezers allow to supercoil DNA molecules, seen as an extension decrease for negative and positive supercoils at forces <0.5 pN (13). The center of the characteristic supercoiling curve (Figure 5b) defines the torsionally relaxed position. Like for other aromatic intercalators, YOYO-1 insertion locally unwinds the DNA. If the dye is removed by flushing the flow cell at high salt concentrations (1 M NaCl), the DNA is locally rewound and becomes negatively supercoiled along its length. This can be seen as an extension decrease (Figure 5a and b). Upon relaxing the molecule by applying positive supercoils, the amount of untwisting upon YOYO-1 removal can be determined from the shift of the supercoiling curves (Figure 5b). Determining for each destained molecule its corresponding decrease in contour length, we find a linear relation between the two quantities with 0.13±0.01 turns/nm (Figure 5c). Multiplying this value by the above-determined length change per intercalated dye, we obtain an untwisting of 0.067±0.02 turns per dye molecule corresponding to 24°±8° per dye.
Figure 5.

YOYO-1-induced untwisting. (a) Measurement scheme. Torsionally constraint but relaxed DNA is destained by adding 1 M NaCl, which causes negative supercoiling of the destained DNA. Subsequently, positive turns are added until the DNA is becoming relaxed again. (b) Supercoiling curves measured at a force of 0.25±0.03 pN in 10 mM phosphate buffer for YOYO–DNA (filled green circles), YOYO–DNA after partial stepwise (filled gray circles) and complete destaining (filled black circles). The shift of the supercoiling curves is accompanied by a linear decrease of the DNA length (orange dashed line). (c) Shift of the torsionally relaxed position plotted over the resulting contour length decrease (filled black circles). A linear fit (solid orange line) to the data provides a slope of 0.13±0.01 turns nm−1.
DISCUSSION
In this study, we determined the persistence as well as the contour length and the untwisting of YOYO-1 complexed DNA within a single experiment. Previous attempts for other DNA intercalators only allowed to obtain a subset of these parameters (19,20). Thus, we present a generic approach for a comprehensive characterization of a broad range of DNA binding molecules. Single-molecule force-extension experiments are advantageous for such measurements since they can distinguish dye intercalation from other types of binding (20). Therefore, the values for the structural parameters represent pure intercalation. Beyond that, our data indicate that alternative YOYO-1 binding occurring only at Rs >  (21) seems to have a negligible effect on the measured properties.
Most strikingly, we found—in contrast to previous reports (3,9,10) and other investigated intercalators (18,20)—the persistence length not being affected by YOYO-1 binding. For YOYO-1, we attribute this to the different conditions under which the experiments have been carried out. Here, we used moderate ionic strength (18 mM sodium ions) and forces not exceeding 10 pN. For these conditions we ensured that YOYO-1 binding is stable and not affected by the stretching force on the timescale of the experiment. Our association constant Ka ≥ 10−8 M−1 is in agreement with a strong association of YOYO-1 to DNA under these solution conditions. Therefore, the measured force-extension relations are governed by the entropic elasticity of the polymer and allow a faithful quantification of the persistence length within the WLC model. Previous force-extension measurements on YOYO-1-stained DNA were carried out at elevated ionic strength of ∼150 mM monovalent ions and considerably higher forces of up to 60 pN (9,10).
Cyanine dyes are known to bind less strongly to DNA at elevated ionic strength. Bulk solution measurements on DNA complexed with the monomeric cyanine dye YO-PRO-1 in buffer containing 20 and 200 mM NaCl, revealed Ka values of 1.6 × 10⁷ M−1 and 3 × 10⁵ M−1, respectively (22). For DNA stained with YOYO-1 at 150 mM NaCl, a Ka value of 3.9 × 10⁶ M−1 has been reported (10). Consequently, at YOYO-1 concentrations in the nM range, only a rather small fraction of the added YOYO-1 binds at elevated ionic strength. This allows additional YOYO-1 binding at higher stretching forces, at which the binding equilibrium changes and, thus, leads to a force dependence of the contour length (10,20). Due to the slow kinetics of YOYO-1 binding at these conditions, this is most easily seen as a pronounced hysteresis in force-extension experiments [Figure 1b (9,10)]. Extracting the persistence length from such data would require a detailed characterization of the force-dependent reaction equilibrium and a subsequent correction of the measured DNA length. Typically, this is however neglected and the persistence length is obtained from conventional WLC fits even under non-saturating dye concentrations where massive force-induced binding can occur (9,10). This in turn provides reduced values for the persistence length which are, due to the slow binding kinetics of YOYO-1, even dependent on the pulling speed (10). In order to overcome this problem and to reliably quantify the persistence length at elevated ionic strength, we corrected the DNA length for force-induced intercalation (Figure 4) and confirmed within error an unchanged bending rigidity also for these conditions.
Though one might still argue that the persistence length might to some extend depend on the peculiarities of the particular monovalent ions used (e.g. when comparing data from solutions containing phosphate versus Tris–HCl buffers), we note that in all the available force-extension data sodium ions were the dominant species (9,10,18,20). Measurements on DNA complexed with monomeric cyanine dyes did not reveal any difference for the equilibrium constant using either Tris- or phosphate buffered solutions (22). Therefore, our conditions should be well comparable to experiments based on other than phosphate buffered solutions.
The reasons why YOYO-1 binding does not affect the persistence length still remain unclear. Since YOYO-1 binding compensates part of the DNA charge, one would expect a lower persistence length due to reduced electrostatic inter-segment repulsion. However, the bis-intercalation might provide additional stiffening acting compensatory. Alternatively, the actual charge of the YOYO–DNA complex might have only little influence on the persistence length at the applied ionic conditions, since the persistence length of bare DNA is found to remain relatively invariant at ionic strength >10 mM (23). Further experiments, also including other intercalators, are required to elucidate this observation.
Beyond the persistence length, we also characterized other parameters important for YOYO-1 intercalation. We found a maximum elongation of 47±2% which is more than reported (9), a binding site size of 3.2±0.6 bp/dye which is in agreement with the expected value of about 4 bp/dye (6) and a DNA elongation per intercalated YOYO-1 molecule of 1.6±0.4 bp/dye in agreement with bis-intercalation. Upon binding of one YOYO-1 molecule, the DNA untwisting per bound YOYO-1 molecule is found to be 24°±8°. This is considerably lower than previously suggested (12) but more in line with values for other intercalators such as ethidium bromide, for which a value of 26° has been reported (19).
Our study provides an important basis for the interpretation of single-molecule experiments involving YOYO-1 complexed DNA by providing the rigidity as well as the contour length of YOYO–DNA. We note that only low ionic strength (<100 mM) supports stable and quantitative YOYO-1 binding, which should accordingly be considered in future experiments.
FUNDING
German Research Foundation (DFG) through the Emmy–Noether programme (to R.S.); grants (ME 1256/7-2, 10-1 and 12-1 (FOR877) (to M.M.). Funding for open access charge: DFG (FOR877).
Conflict of interest statement. None declared.
ACKNOWLEDGEMENTS
Experimental support by D. Klaue and H. Brutzer is gratefully acknowledged.
REFERENCES
- 1.Wirtz D. Direct measurement of the transport properties of a single DNA molecule. Phys. Rev. Lett. 1995;75:2436–2439. doi: 10.1103/PhysRevLett.75.2436. [DOI] [PubMed] [Google Scholar]
- 2.Perkins TT, Smith DE, Chu S. Single polymer dynamics in an elongational flow. Science. 1997;276:2016–2021. doi: 10.1126/science.276.5321.2016. [DOI] [PubMed] [Google Scholar]
- 3.Bakajin OB, Duke TAJ, Chou CF, Chan SS, Austin RH, Cox EC. Electrohydrodynamic stretching of DNA in confined environments. Phys. Rev. Lett. 1998;80:2737–2740. [Google Scholar]
- 4.Turner SWP, Cabodi M, Craighead HG. Confinement-induced entropic recoil of single DNA molecules in a nanofluidic structure. Phys. Rev. Lett. 2002;88:128103. doi: 10.1103/PhysRevLett.88.128103. [DOI] [PubMed] [Google Scholar]
- 5.Maier B, Rädler JO. Conformation and self-diffusion of single DNA molecules confined to two dimensions. Phys. Rev. Lett. 1999;82:1911–1914. [Google Scholar]
- 6.Carlsson C, Johnson M, Akerman B. Double bands in DNA gel electrophoresis caused by bis-intercalating dyes. Nucleic Acids Res. 1995;23:2413–2420. doi: 10.1093/nar/23.13.2413. [DOI] [PMC free article] [PubMed] [Google Scholar]
- 7.Glazer A, Rye H. Stable dye-DNA intercalation complexes as reagents for high-sensitivity fluorescence detection. Nature. 1992;359:859–861. doi: 10.1038/359859a0. [DOI] [PubMed] [Google Scholar]
- 8.Lerman LS. Structural considerations in the interaction of DNA and acridines. J. Mol. Biol. 1961;3:18–30. doi: 10.1016/s0022-2836(61)80004-1. [DOI] [PubMed] [Google Scholar]
- 9.Sischka A, Toensing K, Eckel R, Wilking SD, Sewald N, Ros R, Anselmetti D. Molecular mechanisms and kinetics between DNA and DNA binding ligands. Biophys. J. 2005;88:404–411. doi: 10.1529/biophysj.103.036293. [DOI] [PMC free article] [PubMed] [Google Scholar]
- 10.Murade C, Subramaniam V, Otto C, Bennink ML. Interaction of oxazole yellow dyes with DNA studied with hybrid optical tweezers and fluorescence microscopy. Biophys. J. 2009;97:835–843. doi: 10.1016/j.bpj.2009.05.024. [DOI] [PMC free article] [PubMed] [Google Scholar]
- 11.Doyle PS, Ladoux B, Viovy JL. Dynamics of a tethered polymer in shear flow. Phys. Rev. Lett. 2000;84:4769–4772. doi: 10.1103/PhysRevLett.84.4769. [DOI] [PubMed] [Google Scholar]
- 12.Johansen F, Jacobsen JP. 1H NMR studies of the bis-intercalation of a homodimeric oxazole yellow dye in DNA oligonucleotides. J. Biomol. Struct. Dyn. 1998;16:205–222. doi: 10.1080/07391102.1998.10508240. [DOI] [PubMed] [Google Scholar]
- 13.Strick TR, Allemand JF, Bensimon D, Croquette V. Behavior of supercoiled DNA. Biophys. J. 1998;74:2016–2028. doi: 10.1016/S0006-3495(98)77908-1. [DOI] [PMC free article] [PubMed] [Google Scholar]
- 14.Klaue D, Seidel R. Torsional stiffness of single superparamagnetic microspheres in an external magnetic field. Phys. Rev. Lett. 2009;102:028302. doi: 10.1103/PhysRevLett.102.028302. [DOI] [PubMed] [Google Scholar]
- 15.Revyakin A, Ebright RH, Strick TR. Single-molecule DNA nanomanipulation: improved resolution through use of shorter DNA fragments. Nat. Methods. 2005;2:127–138. doi: 10.1038/nmeth0205-127. [DOI] [PubMed] [Google Scholar]
- 16.Bouchiat C, Wang M, Allemand JF, Strick T, Block S, Croquette V. Estimating the persistence length of a worm-like chain molecule from force-extension measurements. Biophys. J. 1999;76:409–413. doi: 10.1016/s0006-3495(99)77207-3. [DOI] [PMC free article] [PubMed] [Google Scholar]
- 17.McGhee JD, von Hippel PH. Theoretical aspects of DNA-protein interactions: co-operative and non-co-operative binding of large ligands to a one-dimensional homogeneous lattice. J. Mol. Biol. 1974;86:469–489. doi: 10.1016/0022-2836(74)90031-x. [DOI] [PubMed] [Google Scholar]
- 18.Rocha MS, Ferreira MC, Mesquita ON. Transition on the entropic elasticity of DNA induced by intercalating molecules. J. Chem. Phys. 2007;127:105108. doi: 10.1063/1.2768945. [DOI] [PubMed] [Google Scholar]
- 19.Hayashi M, Harada Y. Direct observation of the reversible unwinding of a single DNA molecule caused by the intercalation of ethidium bromide. Nucleic Acids Res. 2007;35:e125. doi: 10.1093/nar/gkm529. [DOI] [PMC free article] [PubMed] [Google Scholar]
- 20.Vladescu ID, McCauley MJ, Nuñez ME, Rouzina I, Williams MC. Quantifying force-dependent and zero-force DNA intercalation by single-molecule stretching. Nat. Methods. 2007;4:517–522. doi: 10.1038/nmeth1044. [DOI] [PubMed] [Google Scholar]
- 21.Larsson A, Carlsson C, Jonsson M, Albinsson B. Characterization of the binding of the fluorescent dyes YO and YOYO to DNA by polarized light spectroscopy. J. Am. Chem. Soc. 1994;116:8459–8465. [Google Scholar]
- 22.Petty JT, Bordelon JA, Robertson ME. Thermodynamic characterization of the association of cyanine dyes with DNA. J. Phys. Chem. B. 2000;104:7221–7227. [Google Scholar]
- 23.Baumann CG, Smith SB, Bloomfield VA, Bustamante C. Ionic effects on the elasticity of single DNA molecules. Proc. Natl Acad. Sci. USA. 1997;94:6185–6190. doi: 10.1073/pnas.94.12.6185. [DOI] [PMC free article] [PubMed] [Google Scholar]