

Abstract
Identification and characterization of the genetic variants underlying type 2 diabetes susceptibility can provide important understanding of the etiology and pathogenesis of type 2 diabetes. We previously identified strong evidence of linkage for type 2 diabetes on chromosome 22 among 3,383 Hypertension Genetic Epidemiology Network (HyperGEN) participants from 1,124 families. The checkpoint 2 (CHEK2) gene, an important mediator of cellular responses to DNA damage, is located 0.22 Mb from this linkage peak. In this study, we tested the hypothesis that the CHEK2 gene contains one or more polymorphic variants that are associated with type 2 diabetes in HyperGEN individuals. In addition, we replicated our findings in two other Family Blood Pressure Program (FBPP) populations and in the population-based Atherosclerosis Risk in Communities (ARIC) study. We genotyped 1,584 African-American and 1,531 white HyperGEN participants, 1,843 African-American and 1,569 white GENOA participants, 871 African-American and 1,009 white GenNet participants, and 4,266 African-American and 11,478 white ARIC participants for four single nucleotide polymorphisms (SNPs) in CHEK2. Using additive models, we evaluated the association of CHEK2 SNPs with type 2 diabetes in participants within each study population stratified by race, and in a meta-analysis, adjusting for age, age2, sex, sex-by-age interaction, study center, and relatedness. One CHEK2 variant, rs4035540, was associated with an increased risk of type 2 diabetes in HyperGEN participants, two replication samples, and in the meta-analysis. These results may suggest a new pathway in the pathogenesis of type 2 diabetes that involves pancreatic beta-cell damage and apoptosis.
Keywords: CHEK2 gene, CHEK2 SNPs, Type 2 diabetes, Family Blood Pressure Program, Atherosclerosis Risk in Communities Study
Introduction
Type 2 diabetes is a major public health problem. Complications from diabetes are currently the sixth leading cause of death in the United States [1] and account for a large proportion of health care costs [2]. Approximately, 90–95% of individuals with diabetes have type 2 diabetes [3–5], resulting from combined insulin resistance and pancreatic β-cell dysfunction [6, 7].
Recent findings from genome-wide association (GWA) studies have implicated genes which affect pancreatic β-cell development and function in the pathogenesis of type 2 diabetes [8]. For example, the hematopoietically expressed homoebox gene (HHEX) encodes a transcription factor involved in pancreatic development. In addition, polymorphisms in the transcription factor 7-like 2 (TCF7L2) and potassium inwardly rectifying channel (KCNJ11) genes may alter insulin secretion in the general population.
Apoptosis and pancreatic β-cell mass loss are recognized mechanisms of β-cell dysfunction in type 2 diabetes [9, 10]. Endoplasmic reticulum (ER) stress, due to increased demand for insulin secretion, has been proposed as the mechanism linking insulin resistance to pancreatic β-cell apoptosis [11–13]. ER stress and the generation of reactive oxygen species (ROS) can lead to DNA damage and apoptosis [14]. Therefore, proteins involved in DNA damage and repair may be causally linked to pancreatic β-cells dysfunction, β-cell apoptosis, and the development of diabetes.
Our prior analysis of 3,153 Hypertension Genetic Epidemiology study (HyperGEN) participants from 437 families identified evidence for linkage of type 2 diabetes to chromosome 22 (LOD = 3.4) [15]. This signal was localized in both white (LOD = 2.0) and African-American (LOD = 1.4) participants [15]. While several candidate genes underlie the 1 LOD unit drop support interval, we decided to first prioritize the checkpoint 2 (CHEK2) gene that is located at 0.22 Mb from the peak of the linkage signal. CHEK2 spans 50 kb and contains 14 exons [16]. The gene product, checkpoint kinase 2, is an important mediator of diverse cellular responses to DNA damage, including signaling pathways of cell-cycle control, DNA repair, and apoptosis [17, 18]. To test the hypothesis that the CHEK2 gene contains one or more polymorphic variants that are associated with type 2 diabetes, we genotyped four single nucleotide polymorphisms (SNPs) in 1,531 white and 1,584 African-American HyperGEN individuals (N = 38 unrelated individuals from the original linkage study [17] were excluded from this association study). In addition, we attempted to replicate our findings in two other Family Blood Pressure Program (FBPP) populations and in the population-based Atherosclerosis Risk in Communities (ARIC) study.
Materials and methods
Family blood pressure program
The FBPP was established in 1995 to investigate the genetic determinants of high blood pressure in multiple ethnic groups [19]. Study design and population samples have been previously described [19]. Briefly, four networks ascertained families based on higher than normal blood pressure levels or diagnosed hypertension. The networks used standardized protocols and measured a standard set of 95 core phenotypes including clinical and lifestyle information obtained by an interview [19]. A single genotyping lab typed 391 microsatellite markers (Marshfield Genotyping Service) [19].
In this study, the HyperGEN participants constituted our primary sample. The participants from the Genetic Epidemiology Network of Atherosclerosis (GENOA) and Gen-Net participants were used as a replication sample. The HyperGEN study recruited African-American and non-Hispanic white sibships with at least two members with hypertension (blood pressure ≥ 140/90 mmHg and/or self-reported use of anti-hypertensive medications), their offspring, and a random sample of age-and-field center matched persons from five field centers [20]. For replication, we used the GENOA and GenNet African-American and non-Hispanic white subjects. GENOA recruited sibships containing a minimum of two individuals diagnosed with hypertension and first degree relatives from three field centers [19], whereas GenNet recruited individuals with blood pressures in the upper 20–25% of the age–gender-specific blood pressure distribution and all available first degree relatives [19].
Atherosclerosis risk in communities study
We also studied the CHEK2 polymorphisms in the population-based ARIC study. ARIC is a prospective study of the etiology and natural history of subclinical and clinically manifest atherosclerosis [21]. ARIC recruited 15,792 middle-aged men and women, selected as a probability sample from four US communities [21]. Individuals were examined at recruitment (1987–1989) and at every 3 years through January 1999. A home interview established baseline sociodemographic and cardiovascular disease profiles. ARIC study personnel also contact cohort members annually by telephone to establish vital status and assess indices of cardiovascular disease, including hospitalizations. This study primarily enrolled African-American and non-hispanic white individuals. African-Americans were over-sampled in Forsyth County, NC and were exclusively sampled in Jackson, MS and comprised 27% of the baseline cohort.
Diabetes and pre-diabetes outcomes
For the FBPP, serum glucose concentrations were measured using Elan Glucose reagent, and fasting serum insulin concentrations were measured on an automated immunoassay instrument with ultra-sensitive insulin kit from Beckman Coulter (Fullerton, CA). For ARIC, fasting plasma glucose was determined by a hexokinase method, and fasting serum insulin was measured using a radioimmunoassay (125Insulin Kit, Cambridge Medical Diagnostics, Billerica, MA). In ARIC, we also used measures of fasting glucose and insulin at Visit 1 in non-diabetic subjects for analysis of pre-diabetes states. HOMA-IR (insulin resistance) and HOMA-beta (beta-cell function) were calculated as follows:
[Fasting insulin (mU/L) and fasting glucose (mmol/L)] [22].
In the FBPP, individuals were classified as having prevalent type 2 diabetes if fasting plasma glucose was at least 7.0 mmol/L (126 mg/dL) or there was current use of medications prescribed to treat diabetes (e.g., insulin or sulfonylureas) [19]. In ARIC, as an oral glucose tolerance test was not performed at baseline, we defined both prevalent and incident diabetes on the basis of the following: a reported physician diagnosis, use of glucose-lowering medications, a fasting (≥8 h) glucose of ≥7.0 mmol/l, or a non-fasting glucose of ≥11.1 mmol/l. The date of diabetes incidence was estimated by linear interpolation using glucose values at the ascertaining visit and the previous one, as previously described [23].
Genotyping and SNP selection strategy
DNA extraction and storage procedures in the FBPP and ARIC studies are described elsewhere [20]. Four tag-SNPs in the CHEK2 gene and a nearby intergenic SNP on chromosome 22 were genotyped in HyperGEN participants. Briefly, tag-SNPs were chosen using a pair-wise correlation (r2) of 0.65 and the HapMap Phase I CEPH sample (CEU) to capture the majority of the then-known common variations in the gene (linkage disequilibrium, LD, for CEPH in HapMap Phase II are shown in Supplement Fig. 1). Genotyping for the FBPP samples was performed by the central laboratory of HyperGEN, Salt Lake City, UT, using Taqman® SNP Genotyping Assays (Applied Biosystems, Foster City, CA). Depending on the particular genotyping budget for each replication population, three to four of the SNPs with the strongest effects were genotyped. The assay call rates were 0.99 for HyperGEN and GenNet SNPs and over 0.95 for GENOA samples. In ARIC, SNPs were genotyped at the ARIC central laboratory, Houston, TX using Taqman® genotyping assays and the same protocol used in HyperGEN. The assay call rates for ARIC's SNPs were over 0.95. All SNPs were tested for significant deviation from Hardy–Weinberg equilibrium (HWE) in race-stratified samples by study population, using an alpha = 0.01. In the family studies, HWE was tested in founders.
Statistical analysis
Assessing association in family-based studies
We used mixed models to estimate the effect of each SNP on type 2 diabetes, while accounting for correlation within the data due to the family design and allowing for covariate adjustment [24]. Mixed models were estimated using SAS 9.1 (PROC GLIMMIX, SAS Institute, Cary, NC). We estimated odds ratios (ORs) and 95% confidence intervals (CI) for type 2 diabetes. We used linear mixed models to estimate the association of SNPs and log-transformed HOMA-IR and HOMA-beta after exclusion of individuals with diabetes.
Assessing association among unrelated individuals
Analysis of the association of SNPs with prevalent type 2 diabetes in the ARIC study was performed using data from the baseline clinical visit. Race-stratified prevalence odds ratios (OR) of type 2 diabetes were calculated from logistic models, while adjusting for the effects of age, age2, sex, age-by-sex interaction, and study center.
We also estimated the 9-year hazard ratio of type 2 diabetes associated with variants in the CHEK2 gene using proportional hazards models. Individuals with diabetes at baseline were excluded from the time-to-event analyses. For incident type 2 diabetes individuals, time-to-event was measured in years from the entry date into the ARIC cohort to the date of diagnosis. Plots of the log (−log) survival curves and the Cox test were used to assess violations of proportional hazard assumptions.
For analysis of HOMA-IR and HOMA-beta, we used linear regression models with additive genetic effects adjusting for age, sex, and center after excluding individuals with diabetes. HOMA-IR and HOMA-beta were log-transformed for analyses.
Application to FBPP and ARIC data
We tested for the independent association of each SNP with type 2 diabetes in race-stratified samples using a general model (no mode of inheritance assumption) and an F-test (2 degrees of freedom). Because of the cross-sectional nature of the majority of these data, a more fully saturated adjustment strategy including factors such as body mass index, etc., was not pursued as diabetes status may directly influence these factors.
Meta-analysis
We performed fixed effects meta-analysis of effect estimates by combining estimated regression coefficients and standard errors across samples (STATA 10), weighting by the inverse variance of each study [25]. We tested for the presence of between-study heterogeneity [26].
Results
A comparison of population-specific genotype frequencies to HapMap genotype frequencies is displayed in supplement Table 1. All allele frequencies were in HWE.
FBPP hyperGEN
The prevalence of type 2 diabetes was 14% among white and 20% among African-American HyperGEN individuals (Table 1). We tested for the association of each SNP with type 2 diabetes in race-stratified samples adjusting for age, age2, sex, age-by-sex interaction, and study center, while accounting for the genetic correlation among family members. Three SNPs, rs2346397 (P = 0.005), rs4035540 (P = 0.04), and rs2078555 (P = 0.03) were independently associated with type 2 diabetes in white HyperGEN participants. Individuals with two copies of the risk allele for rs2346397 or rs4035540 had a twofold increased risk of developing diabetes during the observation period in comparison with those participants with no copies of the risk allele (Table 2). The variant rs2078555 increased the risk of diabetes by approximately 40% for each copy of the risk allele (Table 2), whereas the presence of two risk alleles for rs5762764 reduced the risk of diabetes by approximately 41%. None of the variants were associated with diabetes risk among African-American HyperGEN participants (Table 2).
Table 1.
Population characteristics for the Family Blood Pressure Program Project (FBPP) and Atherosclerosis Risk in Communities (ARIC) samples
| Study population |
Study design/ ascertainment |
Number of subjects |
Female/ male |
Mean age (SD), range |
Mean BMI (SD) |
Type 2 diabetes N (%) | Among non-diabetic individuals | ||
|---|---|---|---|---|---|---|---|---|---|
| Prevalent | Incident events (%, person--years)a |
HOMA-Beta Mean (SD) |
HOMA-IR Mean (SD) |
||||||
| HyperGEN | |||||||||
| White | Family-based/hypertension | 1,531 | 806/725 | 57 (13), 18–87 | 29.6 (6.0) | 220 (14%) | / | 86.89 (34.97) | 1.08 (0.69) |
| African-American | Family-based/hypertension | 1,584 | 1,048/536 | 48 (13), 18–85 | 32.2 (7.7) | 309 (20%) | / | 103.08 (40.30) | 0.83 (1.33) |
| GENOA | |||||||||
| White | Family-based/hypertension | 1,578 | 875/703 | 55 (11), 24–100 | 30.4 (6.3) | 204 (14%) | / | 106.34 (71.46) | 1.96 (1.51) |
| African-American | Family-based/hypertension | 1,853 | 1,280/573 | 58 (10), 20–91 | 31.0(6.6) | 457 (25%) | / | 115.40(95.03) | 2.25 (2.01) |
| GenNet | |||||||||
| White | Family-based/pre-hypertension | 1,009 | 553/456 | 45 (15), 13–85 | 29.2 (6.4) | 126 (12%) | / | 59.37 (52.56) | 1.70 (1.35) |
| African-American | Family-based/pre-hypertension | 871 | 519/352 | 41 (12), 13–81 | 30.4 (8.3) | 83 (10%) | / | 95.08 (103.22) | 1.92 (2.73) |
| ARIC | |||||||||
| White | Population-based cohort | 11,451 | 6,040/5,411 | 54 (6), 44–66 | 27.0 (4.9) | 1046 (9%) | 1,008 (10%, 77,021) | 113.25 (60.53) | 2.68 (1.57) |
| African-American | Population-based cohort | 4,091 | 2,528/1,563 | 54 (6), 44–66 | 29.6 (6.1) | 817 (20%) | 508 (18%, 19,802) | 140.24 (71.21) | 3.25 (1.77) |
HOMA-IR = (insulin × glucose)/22.5; HOMA-Beta = (20 × insulin)/(glucose−3.5) [insulin (mU/L) and glucose (mmol/L)]
For ARIC incident cases: N = 1,046 prevalent cases and N = 502 individuals without follow-up were excluded for whites; N = 817 prevalent diabetes cases and N = 377 individuals without follow-up were excluded for African-Americans. BMI body mass index, SD standard deviation, /not available
Table 2.
Prevalent type 2 diabetes odds ratio and 95% confidence intervals for CHEK2 SNPs by race among HyperGEN participants
| SNPs | White | African-American | ||
|---|---|---|---|---|
| OX versus OO | XX versus OO | OX versus OO | XX versus OO | |
| rs2346397 | 1.19 (0.84, 1.68) | 2.29 (1.39, 3.77)* | 0.90 (0.67, 1.22) | 1.01 (0.65, 1.52) |
| rs4035540 | 1.12 (0.80, 1.56) | 2.18 (1.20, 3.98)** | 1.09 (0.82, 1.46) | 0.97 (0.50, 1.89) |
| rs2078555 | 1.42 (1.01, 1.99)** | 1.97 (1.13, 3.43)** | 0.91 (0.68, 1.22) | 1.00 (0.62, 1.61) |
| rs5762764 | 1.03 (0.74, 1.45) | 0.59 (0.34, 0.997)** | 1.06 (0.77, 1.47) | 1.25 (0.54, 2.86) |
Mixed models, adjusted for the family random effects and fixed effects of age, age2, sex, age-by-sex interaction, and center. X is the risk allele. Referent is 00 copies. In bold, significant effects for general (2 d.f.) models at α = 0.05:
P = 0.005;
P = 0.04
FBPP, GENOA and GenNet
Given the evidence of association of multiple CHEK2 SNPs with type 2 diabetes in white HyperGEN participants, we sought to replicate our findings in two additional family-based studies of the FBPP network, the GENOA and GenNet studies. The population characteristics by race and the prevalence of type 2 diabetes are displayed in Table 1.
For African-American GENOA participants, we found significant associations between rs4035540 and type 2 diabetes (P = 0.03). Two copies of the risk allele for rs4035540 increased the risk of diabetes by 84% in a model adjusted for age and sex (Table 3). In GenNet, only three SNPs were genotyped. None of them were independently associated with diabetes in white or African-American subjects (data not shown).
Table 3.
Prevalent type 2 diabetes odds ratio and 95% confidence intervals for CHEK2 SNPs by race among GENOA participants
| SNPs | White | African-American | ||
|---|---|---|---|---|
| OX versus OO | XX versus OO | OX versus OO | XX versus OO | |
| rs2346397 | 1.27 (0.89, 1.82) | 1.20 (0.65, 2.22) | 0.82 (0.63, 1.08) | 1.24 (0.87, 1.79) |
| rs4035540 | 0.91 (0.64, 1.28) | 1.35 (0.68, 2.67) | 0.89 (0.69, 1.16) | 1.84 (1.10, 3.06)* |
| rs2078555 | 1.28 (0.91, 1.80) | 1.30 (0.74, 2.29) | 1.09 (0.85, 1.41) | 1.29 (0.86, 1.93) |
| rs5762764 | 0.88 (0.62,1.25) | 1.18 (0.72, 1.94) | 0.83 (0.62,1.12) | 0.66 (0.27, 1.62) |
Mixed models, adjusted for the family random effects and fixed effects of age, age2, sex, age-by-sex interaction, and center. X is the risk allele. Referent is 00 copies. In bold, significant effects for general (2 d.f.) models at α = 0.05:
P = 0.03
ARIC study
Because of the ascertainment of the FBPP population for high blood pressure, we sought to replicate our findings in the population-based ARIC study. Among 11,451 white and 4,091 African-American genotyped individuals, the prevalence of type 2 diabetes was 9 and 20%, respectively (Table 1). Using logistic regression, adjusting for the effects of age, age2, sex, age-by-sex interaction, and center, two copies of the risk allele for rs4035540 were associated with a 66% increase in risk of diabetes among African-American individuals (P = 0.01)(Table 4 for general models). The variant rs2078555 was associated with a 25% increase in risk of diabetes in African-Americans, however, only when comparing those with 0 copies of the risk allele to those with 1 copy (OR 1.27, 95% CI, 1.07, 1.50, P = 0.02). No significant associations were observed in ARIC white participants. Among 9,903 white and 2,897 African-American ARIC participants without diabetes at baseline, 1,008 and 508 developed type 2 diabetes at 9 years of follow-up. Individual CHEK2 SNPs were not significantly associated with incident type 2 diabetes (Table 5).
Table 4.
Prevalent type 2 diabetes odds ratio and 95% confidence intervals for CHEK2 SNPs by race among ARIC participants
| SNPs | White (N = 10,598) | African-American (N = 3,436) | ||
|---|---|---|---|---|
| OX versus OO | XX versus OO | OX versus OO | XX versus OO | |
| rs2346397 | 0.93 (0.81, 1.07) | 0.81 (0.64, 1.04) | 1.13 (0.95, 1.35) | 1.05 (0.82, 1.34) |
| rs4035540 | 0.94 (0.81, 1.08) | 0.96 (0.72, 1.29) | 1.02 (0.85, 1.21) | 1.66 (1.18, 2.32)** |
| rs2078555 | 0.91 (0.79, 1.04) | 0.83 (0.65, 1.07) | 1.27 (1.07, 1.50)* | 1.18 (0.88, 1.57) |
| rs5762764 | 1.09 (0.95, 1.26) | 1.11 (0.91, 1.36) | 1.07 (0.88, 1.30) | 0.65 (0.32, 1.34) |
Adjusted for the fixed effects of age, age2, sex, age-by-sex interaction, and center. X is the risk allele. Referent is 00 copies. In bold, significant effects for general (2 d.f.) models at α = 0.05:
P = 0.02;
P = 0.01
Table 5.
Incidence odds ratios and 95% confidence interval of incident type 2 diabetes by CHEK2 SNPs by race among ARIC participants
| SNPs | White (N = 9,903) | African-American (N = 2,897) | ||
|---|---|---|---|---|
| XO versus OO | XX versus OO | XO versus OO | XX versus OO | |
| rs2346397 | 1.05 (0.92,1.20) | 1.17 (0.94,1.45) | 1.03 (0.85,1.24) | 1.18 (0.92,1.53) |
| rs4035540 | 1.05 (0.92,1.19) | 1.13 (0.86,1.48) | 1.10 (0.92,1.33) | 1.24 (0.83,1.87) |
| rs2078555 | 0.99 (0.87,1.13) | 1.11 (0.89,1.38) | 0.92 (0.77,1.11) | 0.99 (0.72, 1.36) |
| rs5762764 | 1.06 (0.93,1.22) | 1.07 (0.88,1.29) | 0.94 (0.76,1.18) | 1.54 (0.84,2.80) |
Odds ratios: Race-stratified logistic regression adjusting for the fixed effects of age, age2, sex, age-by-sex interaction, and center. X is the risk allele. Referent is 00 copies
Results from the meta-analysis (Table 6) indicate that those individuals with two copies of the risk variant for rs4035540 had a 33% increase (P = 0.02) in the risk for diabetes in all participants, after adjusting for race, sex, age, age2, age-by-sex interaction, and center. When stratified by race, African-Americans with two copies of the variants rs4035540 had a 57% increase (P = 0.01) in the risk for prevalent type 2 diabetes. A summary illustration of the results from each cohort and the meta-analysis for SNP rs4035540 is provided in Fig. 1.
Table 6.
Meta-analysis estimating odds ratios and 95% confidence interval of prevalent type 2 diabetes by CHEK2 SNPs by race among all participants
| SNPs | Both races combined | White | African-American | |||
|---|---|---|---|---|---|---|
| OX versus OO | XX versus OO | OX versus OO | XX versus OO | OX versus OO | XX versus OO | |
| rs2346397 | 1.00 (0.91, 1.09) | 1.05 (0.92, 1.21) | 0.99 (0.88, 1.12) | 1.01 (0.82, 1.24) | 1.00 (0.88, 1.14) | 1.09 (0.91, 1.31) |
| rs4035540 | 0.98 (0.89, 1.07) | 1.33 (1.11, 1.59)* | 0.96 (0.85, 1.09) | 1.15 (0.90, 1.47) | 1.00 (0.88, 1.14) | 1.57 (1.21, 2.04)** |
| rs2078555 | 1.07 (0.98, 1.17) | 1.08 (0.93, 1.26) | 1.00 (0.89, 1.13) | 1.00 (0.81, 1.24) | 1.15 (1.01, 1.30) | 1.17 (0.95, 1.45) |
| rs5762764 | 1.03 (0.94, 1.14) | 1.01 (0.86, 1.19) | 1.05 (0.93, 1.19) | 1.05 (0.88, 1.25) | 1.00 (0.87, 1.16) | 0.80 (0.50, 1.27) |
General model adjusted for age, age2, sex, age-by-sex interaction, and center. X is the risk allele. Referent is 00 copies. In bold, significant effects for general (2 d.f.) models at α = 0.05: * P = 0.02 for an adjusted general model;
P = 0.02;
P = 0.01
Fig. 1.
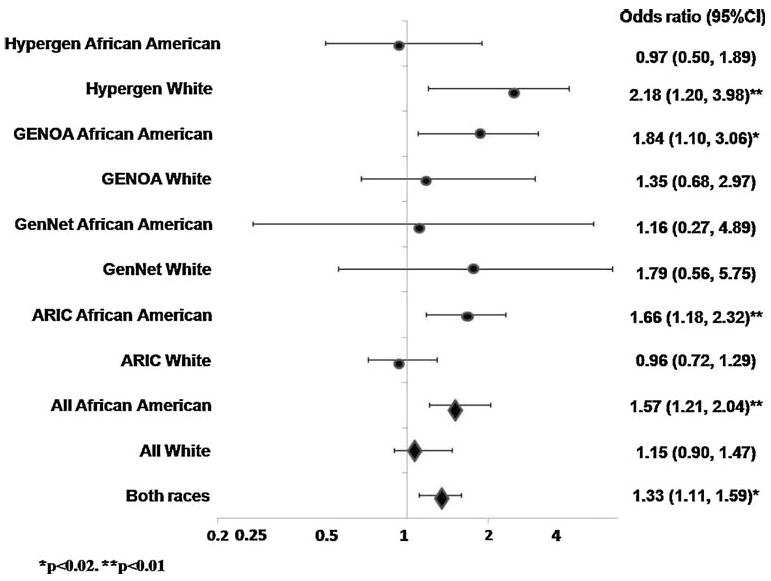
Forest plot of the odds ratios for prevalent diabetes among White and African-American participants of the Atherosclerosis in Communities (ARIC) and Family Blood Pressure Program (FBPP) cohorts who are homozygote for SNP rs4035540 variant; illustrated by cohort (circles) and in the meta-analysis (diamonds)
In analysis of pre-diabetes traits of HOMA-IR and HOMA-beta, we found significant associations of rs4035540 genotypes with these traits among ARIC whites only (P = 0.02 and 0.01, respectively, Supplement Table 2).
Discussion
Recent gene discoveries in type 2 diabetes have highlighted the important role of pancreatic dysfunction in the development of the disease. Although over 14 genes have recently been implicated in the pathogenesis of type 2 diabetes, these genetic variants explain only a small proportion of the excess familial risk of disease in the population [8, 27].
In this study, we found a significant association between several variants in the CHEK2 gene and prevalent type 2 diabetes among white and African-American individuals. One variant, rs4035540, was associated with increased risk for type 2 diabetes among white HyperGEN participants, and GENOA and ARIC African-American participants. The increased risk varied from 66 to 200%. Another variant, rs2078555, was associated with increased risk of type 2 diabetes among white HyperGEN and African-American ARIC individuals. Two variants, rs2346397 and rs5762764, were associated with type 2 diabetes in white HyperGEN participants only.
Although numerous genetic tests were performed, we did not account for multiple comparisons. However, we limited the number of statistical tests performed a priori by only examining five CHEK2 SNPs. Given the correlation and non-independence of the SNPs and phenotypes evaluated, a systematic correction would be extremely difficult.
While some inconsistency in replication was noted, we were limited in the coverage of the gene by the choice of the then-available tag-SNPs. In addition, because the tag-SNPs were selected to maximize the coverage of the gene in the CEPH HapMap population, the coverage of the gene and pattern of LD in the participants of African descent may have been limited. As with other identified genes for common diseases, the effect size, while probably important, is small, and subtle variations in populations may obscure detecting a consistent association. Other reasons for the inconsistency in replication may include genetic heterogeneity, gene–environment interactions, and type 1 error [8]. Nonetheless, it is important to recognize that the association between rs4035540 was significant in the discovery sample, in the replication populations, and in the meta-analysis, and it is unlikely that these results could be due to chance alone. Indeed, since we did not identify a candidate functional SNP to be typed, different SNPs, both with some LD to the causal SNP, displayed positive association with type 2 diabetes across different populations. It is imperative that future studies attempt to identify a causal variant for typing in future replication efforts.
We did not find significant associations of variants in CHEK2 and incident diabetes in the ARIC cohort study. However, incident cases in the ARIC cohort were individuals who developed diabetes between ages 45 and 70 years [28], whereas all our prevalent cases (ARIC and FBPP) of diabetes were individuals who developed the disease between 30 and 45 years. Therefore, we may expect stronger genetic effects for early onset disease. To further examine this possibility, we derived measures of insulin resistance (HOMA-IR) and insulin sensitivity (HOMA-beta) in non-diabetic whites and African-Americans of the FBPP and ARIC samples. We hypothesized that since we did not detect significant associations between white ARIC participants and type 2 diabetes, we might detect significant associations between these persons for impaired insulin sensitivity and/or resistance and CHEK2 variants. Interestingly, significant associations were detected in the white ARIC samples only (Supplement Table 2), supporting our hypothesis.
We also addressed the contribution of the identified SNP to the original linkage signal using a maximum likelihood linkage approach that modeled affection status by a liability threshold model as implemented in SOLAR. Adjusting for CHEK2 rs4035540 as an additional covariate in the linkage analysis, the resulting LOD score was unchanged. While inclusion of the SNPs in the polygenic model did not account for the previously identified linkage peak, we were unable to genotype 38 participants from the linkage paper sample. Thus, our inability to account for the linkage signal may reflect a reduced power due to the exclusion of the aforementioned 38 individuals.
To further confirm our results, we evaluated the P-values from the association between SNP genotypes and type 2 diabetes for SNPs in LD with CHEK2 rs4035540 among approximately 2,600 participants of the Diabetes Genetic Initiative (DGI) study (formerly available at http://www.broad.mit.edu/diabetes/). Evidence for association was observed for CHEK2 SNP rs695388 (P = 0.014), rs9613617 (P = 0.037), rs5752764 (P = 0.023), and rs5762763 (P = 0.035) (Supplement Table 3). These results provide confirmatory evidence of our findings of association between CHEK2 variants and type 2 diabetes susceptibility.
Our findings suggest a role for the CHEK2 gene in susceptibility to type 2 diabetes. Our choice of the gene was driven by its location under the 1 LOD unit drop support interval of the linkage signal for type 2 diabetes and by the strong biological plausibility of a role of pancreatic β-cell apoptosis in type 2 diabetes in humans [9]. Apoptosis leads to decreased β-cell mass and therefore may contribute to exocrine pancreas dysfunction and the decreased insulin secretion observed in individuals with type 2 diabetes [9]. ER stress can lead to DNA damage, activating regulatory pathways that cause cell-cycle arrest and providing time for DNA repair. CHEK2 protein is a tumor suppressor, and the link between ataxia telangiectasia mutated (ATM) and ataxia telangiectasia RAD3-related (ATR) kinases and checkpoint effectors in DNA repair pathway [16]. The protein structure has several evolutionary conserved elements, with high homology among eukaryotes [16]. Mutations in CHEK2 have been associated with sporadic and hereditary human cancers [29]. In preliminary studies, Chung et al. showed that the CHEK2 gene null mice were transitorily glucose intolerant, due to an inability to produce and secrete adequate amounts of insulin to maintain normal glucose homeostasis (personal report). The effect of CHEK2 variants in the pathogenesis of type 2 diabetes has not been previously investigated.
In summary, we may have identified a promising type 2 diabetes candidate gene, CHEK2, an important mediator of diverse cellular responses to DNA damage. Variants in CHEK2 may be causally linked to pancreatic β-cells apoptosis and the development of type 2 diabetes. One CHEK2 variant in particular, rs4035540, was associated with increased risk of type 2 diabetes in HyperGEN participants and in two replication samples. Results from the meta-analysis affirm the results for rs4035540, particularly for African-American participants. Lastly, results from DGI provide confirmatory evidence of our findings of association between CHEK2 variants and type 2 diabetes susceptibility. Further studies should replicate our findings and extend these findings to closely related traits such as pre-diabetes phenotypes, for example fasting glucose and insulin resistance so that the underlying mechanisms of this association may be further explored.
Supplementary Material
Acknowledgments
The following investigators are associated with the Family Blood Pressure Program: GenNet Network: Alan B. Weder (Network Director), Lillian Gleiberman (Network Coordinator), Anne E. Kwitek, Aravinda Chakravarti, Richard S. Cooper, Carolina Delgado, Howard J. Jacob, and Nicholas J. Schork. GENOA Network: Eric Boerwinkle (Network Director), Tom Mosley, Alanna Morrison, Kathy Klos, Craig Hanis, Sharon Kardia, and Stephen Turner. HyperGEN Network: Steven C. Hunt (Network Director), Janet Hood, Donna Arnett, John H. Eckfeldt, R. Curtis Ellison, Chi Gu, Gerardo Heiss, Paul Hopkins, Aldi T. Kraja, Jean-Marc Lalouel, Mark Leppert, Albert Oberman, Michael A. Province, D.C. Rao, Treva Rice, and Robert Weiss. SAPPHIRe Network: David Curb (Network Director), David Cox, Timothy Donlon, Victor Dzau, John Grove, Kamal Masaki, Richard Myers, Richard Olshen, Richard Pratt, Tom Quertermous, Neil Risch and Beatriz Rodriguez. National Heart, Lung, and Blood Institute: Dina Paltoo and Cashell E. Jaquish. Web Site: http://www.biostat.wustl.edu/fbpp/FBPP.shtml. The Family Blood Pressure Program Project is supported by cooperative agreement grants HL54471, HL54472, HL54473, HL54495, HL54496, HL54509, HL54515 from the National Heart, Lung and Blood Institute (NHLBI), Bethesda, MD. The Atherosclerosis Risk in Communities Study is carried out as a collaborative study supported by NHLBI contracts N01-HC-55015, N01-HC-55016, N01-HC-55018, N01-HC-55019, N01-HC-55020, N01-HC-55021, and N01-HC-55022. The authors thank the staff and participants of the FBPP and ARIC study for their important contributions.
Footnotes
Electronic supplementary material The online version of this article (doi:10.1007/s00592-009-0162-z) contains supplementary material, which is available to authorized users.
Contributor Information
Kari E. North, Email: kari_north@unc.edu, mgraff@unc.edu, Department of Epidemiology, University of North Carolina, Chapel Hill, NC, USA, Carolina Center for Genome Sciences, University of North, Carolina, 137 E. Franklin St., Suite 306, Chapel Hill, NC 27516, USA
Nora Franceschini, Department of Epidemiology, University of North Carolina, Chapel Hill, NC, USA.
Christy L. Avery, Department of Epidemiology, University of North Carolina, Chapel Hill, NC, USA
Lisa Baird, Department of Human Genetics, University of Utah, Salt Lake City, UT, USA.
Mariaelisa Graff, Department of Nutrition, University of North Carolina, Chapel Hill, NC, USA, Carolina Population Center, University of North Carolina, Chapel Hill, NC, USA.
Mark Leppert, Department of Human Genetics, University of Utah, Salt Lake City, UT, USA.
Jay H. Chung, Laboratory of Biochemical Genetics, National Heart Lung and Blood Institute, Bethesda, MD, USA
Jinghui Zhang, Center for Biomedical Informatics and Information Technology, Rockville, MD, USA.
Craig Hanis, Human Genetics Center, University of Texas Health Sciences Center, Houston, TX, USA.
Eric Boerwinkle, Human Genetics Center, University of Texas Health Sciences Center, Houston, TX, USA.
Kelly A. Volcik, Human Genetics Center, University of Texas Health Sciences Center, Houston, TX, USA
Megan L. Grove, Human Genetics Center, University of Texas Health Sciences Center, Houston, TX, USA
Thomas H. Mosley, Department of Medicine (Geriatrics), University of Mississippi Medical Center, Jackson, MS, USA
Charles Gu, Division of Biostatistics and Department of Genetics, Washington University School of Medicine, St. Louis, MO, USA.
Gerardo Heiss, Department of Epidemiology, University of North Carolina, Chapel Hill, NC, USA.
James S. Pankow, Division of Epidemiology & Community Health, University of Minnesota, Minneapolis, MN, USA
David J. Couper, Department of Biostatistics, University of North Carolina, Chapel Hill, NC, USA
Christie M. Ballantyne, Section of Atherosclerosis and Vascular Medicine, Department of Medicine, Baylor College of Medicine, Houston, TX, USA
W. H. Linda Kao, Department of Epidemiology, Johns Hopkins University, Baltimore, MD, USA
Alan B. Weder, Division of Hypertension, University of Michigan School of Medicine, Ann Arbor, MI, USA
Richard S. Cooper, Department of Preventive Medicine and Epidemiology, Loyola University School of Medicine, Maywood, IL, USA
Georg B. Ehret, McKusick-Nathans Institute of Genetic Medicine, Johns Hopkins University School of Medicine, Baltimore, MD, USA
Ashley A. O'Connor, McKusick-Nathans Institute of Genetic Medicine, Johns Hopkins University School of Medicine, Baltimore, MD, USA
Aravinda Chakravarti, McKusick-Nathans Institute of Genetic Medicine, Johns Hopkins University School of Medicine, Baltimore, MD, USA.
Steven C. Hunt, Division of Cardiovascular Genetics, University of Utah School of Medicine, Salt Lake City, UT, USA
References
- 1.Anderson R, Smith B. Deaths: leading causes for 2002. National Vital Statistical Report. 2005:1–89. [PubMed] [Google Scholar]
- 2.Hogan P, Dall T, Nikolov P, American Diabetes A Economic costs of diabetes in the US in 2002. Diabetes Care. 2003;26:917–932. doi: 10.2337/diacare.26.3.917. [DOI] [PubMed] [Google Scholar]
- 3.US Department of Health and Human Services CfDCaP, editor. CDC CfDCaP. National diabetes fact sheet: general information and national estimates on diabetes in the United States, 2003. Atlanta, GA: 2003. [Google Scholar]
- 4.Kenny S, Aubert R, Geiss L. Prevalence and incidence of non-insulin-dependent diabetes. In: E NDDG, editor. Diabetes in America. US Department of Health and Human Service, Public Health Service, National Institute of Health; Bethesda, MD: 1995. pp. 47–68. [Google Scholar]
- 5.Winer N, Sowers JR. Epidemiology of diabetes. J Clin Pharmacol. 2004;44:397–405. doi: 10.1177/0091270004263017. [DOI] [PubMed] [Google Scholar]
- 6.American Diabetes A. Diagnosis and classification of diabetes mellitus. Diabetes Care. 2006;29(Suppl 1):S43–S48. [PubMed] [Google Scholar]
- 7.Buchanan TA. Pancreatic beta-cell loss and preservation in type 2 diabetes. Clin Ther. 2003;25(Suppl B):B32–B46. doi: 10.1016/s0149-2918(03)80241-2. [DOI] [PubMed] [Google Scholar]
- 8.Frayling TM. Genome-wide association studies provide new insights into type 2 diabetes aetiology. Nat Rev Genet. 2007;8:657–662. doi: 10.1038/nrg2178. [DOI] [PubMed] [Google Scholar]
- 9.Butler AE, Janson J, Bonner-Weir S, Ritzel R, Rizza RA, Butler PC. Beta-cell deficit and increased beta-cell apoptosis in humans with type 2 diabetes. Diabetes. 2003;52:102–110. doi: 10.2337/diabetes.52.1.102. [DOI] [PubMed] [Google Scholar]
- 10.Kahn SE. The relative contributions of insulin resistance and beta-cell dysfunction to the pathophysiology of type 2 diabetes. Diabetologia. 2003;46:3–19. doi: 10.1007/s00125-002-1009-0. [DOI] [PubMed] [Google Scholar]
- 11.Nakatani Y, Kaneto H, Kawamori D, et al. Involvement of endoplasmic reticulum stress in insulin resistance and diabetes. J Biol Chem. 2005;280:847–851. doi: 10.1074/jbc.M411860200. [DOI] [PubMed] [Google Scholar]
- 12.Oyadomari S, Takeda K, Takiguchi M, et al. Nitric oxide-induced apoptosis in pancreatic beta cells is mediated by the endoplasmic reticulum stress pathway. Proc Natl Acad Sci USA. 2001;98:10845–10850. doi: 10.1073/pnas.191207498. [DOI] [PMC free article] [PubMed] [Google Scholar]
- 13.Ozcan U, Cao Q, Yilmaz E, et al. Endoplasmic reticulum stress links obesity, insulin action, and type 2 diabetes. Science. 2004;306:457–461. doi: 10.1126/science.1103160. [DOI] [PubMed] [Google Scholar]
- 14.O'Driscoll M, Jeggo PA. The role of double-strand break repair-insights from human genetics. Nat Rev Genet. 2006;7:45–54. doi: 10.1038/nrg1746. [DOI] [PubMed] [Google Scholar]
- 15.Avery CL, Freedman BI, Heiss G, et al. Linkage analysis of diabetes status among hypertensive families: the hypertension genetic epidemiology network study. Diabetes. 2004;53:3307–3312. doi: 10.2337/diabetes.53.12.3307. [DOI] [PubMed] [Google Scholar]
- 16.Bartek J, Falck J, Lukas J. CHK2 kinase–a busy messenger. Nat Rev Mol Cell Biol. 2001;2:877–886. doi: 10.1038/35103059. [DOI] [PubMed] [Google Scholar]
- 17.Bartek J, Lukas J. DNA damage checkpoints: from initiation to recovery or adaptation. Curr Opin Cell Biol. 2007;19:238–245. doi: 10.1016/j.ceb.2007.02.009. [DOI] [PubMed] [Google Scholar]
- 18.Niida H, Nakanishi M. DNA damage checkpoints in mammals. Mutagenesis. 2006;21:3–9. doi: 10.1093/mutage/gei063. [DOI] [PubMed] [Google Scholar]
- 19.PP FB. Multi-center genetic study of hypertension: the family blood pressure program (FBPP) Hypertension. 2002;39:3–9. doi: 10.1161/hy1201.100415. [DOI] [PubMed] [Google Scholar]
- 20.Williams RR, Rao DC, Ellison RC, et al. NHLBI family blood pressure program: methodology and recruitment in the HyperGEN network. Hypertension genetic epidemiology network. Ann Epidemiol. 2000;10:389–400. doi: 10.1016/s1047-2797(00)00063-6. [DOI] [PubMed] [Google Scholar]
- 21.The ARIC investigators. The Atherosclerosis Risk in Communities (ARIC) study: design and objectives. Am J Epidemiol. 1989;129:687–702. [PubMed] [Google Scholar]
- 22.Matthews D, Hosker J, Rudenski A, Naylor B, Treacher D, Turner R. Homeostasis model assessment: insulin resistance and B-cell function from fasting plasma glucose and insulin concentrations in man. Diabetologia. 1985;28:412–419. doi: 10.1007/BF00280883. [DOI] [PubMed] [Google Scholar]
- 23.Duncan BB, Schmidt MI, Pankow JS, et al. Low-grade systemic inflammation and the development of type 2 diabetes: the atherosclerosis risk in communities study. Diabetes. 2003;52:1799–1805. doi: 10.2337/diabetes.52.7.1799. [DOI] [PubMed] [Google Scholar]
- 24.Herbert A, Liu C, Karamohamed S, et al. The -174 IL-6 GG genotype is associated with a reduced risk of type 2 diabetes mellitus in a family sample from the National Heart, Lung and Blood Institute's Framingham Heart Study. Diabetologia. 2005;48:1492–1495. doi: 10.1007/s00125-005-1830-3. [DOI] [PubMed] [Google Scholar]
- 25.Deeks C, Altman D, Bradburn M. Statistical methods for examining heterogeneity and combining results from several studies in meta-analysis. In: Egger M, Smith G, Altman D, editors. Systematic Reviews in Health Care: Meta-analysis in Context. London: 2001. [Google Scholar]
- 26.Higgins JP, Thompson SG, Deeks JJ, Altman DG. Measuring inconsistency in meta-analyses. BMJ. 2003;327:557–560. doi: 10.1136/bmj.327.7414.557. [DOI] [PMC free article] [PubMed] [Google Scholar]
- 27.Wolfs MGM, Hofker MH, Wijmenga C, van Haeften TW. Type 2 Diabetes Mellitus: new genetic insights will lead to new therapeutics. Current Genomics. 2009;10:110–118. doi: 10.2174/138920209787847023. [DOI] [PMC free article] [PubMed] [Google Scholar]
- 28.Paynter NP, Yeh HC, Voutilainen S, et al. Coffee and sweetened beverage consumption and the risk of type 2 diabetes mellitus: the atherosclerosis risk in communities study. Am J Epidemiol. 2006;164:1075–1084. doi: 10.1093/aje/kwj323. [DOI] [PubMed] [Google Scholar]
- 29.Bell DW, Varley JM, Szydlo TE, et al. Heterozygous germ line hCHK2 mutations in Li-Fraumeni syndrome. Science. 1999;286:2528–2531. doi: 10.1126/science.286.5449.2528. [DOI] [PubMed] [Google Scholar]
Associated Data
This section collects any data citations, data availability statements, or supplementary materials included in this article.