

Summary
Background
Financing for malaria control has increased as part of international commitments to achieve the Millennium Development Goals (MDGs). We aimed to identify the unmet financial needs that would be biologically and economically equitable and would increase the chances of reaching worldwide malaria-control ambitions.
Methods
Populations at risk of stable Plasmodium falciparum or Plasmodium vivax transmission were calculated for 2007 and 2009 for 93 malaria-endemic countries to measure biological need. National per-person gross domestic product (GDP) was used to define economic need. An analysis of external donor assistance for malaria control was done for the period 2002–09 to compute overall and annualised per-person at-risk-funding commitments. Annualised malaria donor assistance was compared with independent predictions of funding needed to reach international targets of 80% coverage of best practices in case-management and effective disease prevention. Countries were ranked in relation to biological, economic, and unmet needs to examine equity and adequacy of support by 2010.
Findings
International financing for malaria control has increased by 166% (from $0·73 billion to $1·94 billion) since 2007 and is broadly consistent with biological needs. African countries have become major recipients of external assistance; however, countries where P vivax continues to pose threats to control ambitions are not as well funded. 21 countries have reached adequate assistance to provide a comprehensive suite of interventions by 2009, including 12 countries in Africa. However, this assistance was inadequate for 50 countries representing 61% of the worldwide population at risk of malaria—including ten countries in Africa and five in Asia that coincidentally are some of the poorest countries. Approval of donor funding for malaria control does not correlate with GDP.
Interpretation
Funding for malaria control worldwide is 60% lower than the US$4·9 billion needed for comprehensive control in 2010; this includes funding shortfalls for a wide range of countries with different numbers of people at risk and different levels of domestic income. More efficient targeting of financial resources against biological need and national income should create a more equitable investment portfolio that with increased commitments will guarantee sustained financing of control in countries most at risk and least able to support themselves.
Funding
Wellcome Trust.
Introduction
Despite ambitious plans proposed by the Roll Back Malaria (RBM) Partnership in its Global Malaria Action Plan,1 the relation between malaria and poverty means that most malaria-endemic countries will be unable to finance national, regional, or worldwide control ambitions un-assisted. Achievement of effective levels of malaria control within the next 10–20 years will depend on sustained international funding to meet the needs of resource-poor endemic countries. Since 2002, the Global Fund to Fight AIDS, Tuberculosis and Malaria (Global Fund);2 the World Bank Booster Program;3 the President's Malaria Initiative;4 and other bilateral and multilateral agency support to countries has increased investment in malaria control to meet targets outlined as part of Millennium Development Goal (MDG)5 (to reduce infant and child mortality by two-thirds) and MDG 6c (to increase coverage of effective interventions against malaria by 2015).4
At face value, financing by the international donor community has exceeded the expectations set when RBM was launched more than 10 years ago. However, increasing funding that remains below that needed in high-risk high-population poor countries will not achieve worldwide target reductions in disease incidence. To define whether countries will reach their MDG targets it is important to understand, not just aggregate funding, but the equity and adequacy of this funding so that investments to reach the MDGs are targeted appropriately.
During previous analyses of funding commitments to malaria control we assembled data on populations at risk of stable Plasmodium falciparum transmission only;6 it was not possible at that time to construct an informed basis of the worldwide extent of stable Plasmodium vivax transmission. The substantial worldwide public-health consequences of P vivax are often ignored,7 thus diminishing the worldwide definitions of funding needs and limiting the value of between-country comparisons of appropriate funding levels for malaria control. Most countries outside sub-Saharan Africa develop strategies and needs based on the prevention of both P falciparum and P vivax with screening, diagnosis, and treatment strategies that are parasite specific. The geographical distribution of the two parasites overlaps widely, although there are notable exceptions including 12 malaria-endemic countries where transmission is exclusively limited to P vivax, and others in which P falciparum exists only in constrained foci. We use the recently published mapped worldwide distribution of P vivax8 in combination with the distribution of P falciparum transmission9 and combine these data with the most recent financing information to improve, update, and review the international funding commitments by the end of 2009. We use this framework to identify the unmet financial needs that would be biologically and economically equitable and would increase the chances of achieving worldwide malaria-control ambitions.1,5
Methods
Assessment of biological equity
We included all malaria-endemic countries for which there was sufficient evidence of contemporary transmission of either P falciparum or P vivax. Eight countries that had small residual foci of possible transmission or were close to elimination were excluded (Mayotte, Jamaica, Mauritius, Algeria, Egypt, Reunion, Oman, and Uzbekistan). We did not include a further four countries (Cape Verde, El Salvador, Iraq, and Kyrgyzstan) because these were subsequently identified as having no populations at risk of either P vivax or P falciparum stable transmission. The geographical extent of P vivax transmission in Africa and its relation with the Duffy-negative phenotype (Fya–b–) on the surface of red blood cells remain uncertain. We regard P vivax risk countries in Africa as Sudan, Somalia, Djibouti, Ethiopia, Eritrea, Comoros, and Madagascar.
We defined populations within each of the remaining 93 countries as either malaria free, at risk of unstable transmission, or at risk of stable transmission of P falciparum9,10 or P vivax.8 Within each country the absence of transmission was defined after a comprehensive review of international travel advisories, subnational case-reporting averaged over several years, and biological masks developed on the basis of temperature-limiting effects of parasite development within the dominant country-specific mosquito-vector populations combined with vector longevity specific to P falciparum9 and P vivax.8 Unstable transmission refers to areas where national reports of incident cases total less than one P vivax or P falciparum case per 10 000 population in an average recent year or where the effects of extreme aridity would not support vector survival but where there might be risks around man-made breeding sites. Areas able to support stable transmission represent health-reporting districts within a national border that have a documented case incidence of at least 1 case per 10 000 population per year and are biologically suited to transmission by local vector populations.8,9 These medical intelligence, routine reporting, and biological threshold data were incorporated as 1×1 km resolution spatial-grid surfaces and combined by use of ArcGIS 9.3 to generate separate maps for P falciparum and P vivax, to identify areas of risk-free, unstable, and stable transmission for each parasite. These maps were then combined to produce a single joint-risk map that delineated those areas at stable risk of either parasite.
The Global Rural Urban Mapping Project beta version provides gridded population counts and population density estimates for the years 1990, 1995, and 2000, both adjusted and unadjusted to the UN's national population estimates.11 Adjusted population counts for the year 2000 were projected to 2007 and 2009 by applying national, medium-variant, urban, and rural-specific growth rates by country,12 resulting in population-count surfaces for 2007 and 2009 at about 1 × 1 km spatial resolution. These surfaces were overlaid with the joint-risk map to define the combined population at risk in each country of either stable P vivax or stable P falciparum transmission (PfPv PAR). We did not use PfPv PAR of unstable transmission where the highly focal epidemiology of malaria presents challenges for accurate distinction of small from true zero risk of disease.9 Moreover, where risk is exceptionally low, decisions on the appropriate targets and sets of evidence-based interventions remain uncertain. However, our definition of stable transmission encompasses a large range of transmission intensities between and within countries9,10 and populations exposed to parasites in this endemicity range are most likely to benefit from tailored combinations of widely promoted treatment and prevention strategies.
Definition of international funding commitments
We have assembled details on malaria-specific external donor assistance to the 93 endemic countries since 2002 (webappendix pp 1–3). Data included the dates, amounts, and sources of funding obtained from online sources,2–4 previous reviews,6 the Creditor Reporting System (CRS) of official development assistance maintained by the Organisation for Economic Co-operation and Development,13 and country-level assessments by RBM.14 Committed funding was indentified up to the end of 2009, including the ninth round of funding by the Global Fund and the President's Malaria Initiative commitments for the financial year 2010. The CRS database did not include funding awards for 2009 and showed incomplete data for periods before 2007. Information between sources was reconciled to remove reporting duplications. Awards covered periods from 2002 to 2015; if they were sequential or renewable the first award date was used to define the entire donor-commitment period. The duration of assistance was computed in months and annualised to an average yearly commitment across the period of data assembly. The annualised funding commitment therefore represents a cumulative average year, allowing analysis of average yearly funding available to deliver commodities, services, training, and monitoring of each country's national malaria-control plan since 2002. Similar data sources and methods were used in previous analyses of funding commitments,6 and these data have been reassembled for comparison purposes to cover all P vivax and P falciparum endemic countries representing funding commitments up to the end of 2007, corresponding to the Global Fund awards including the seventh round and before the expanded President's Malaria Initiative programme in Africa. Summed commitments across all donors for the period up to 2007 and 2009 were used to compute the average yearly per-person external funding for these two periods (webappendix pp 1–3). The assemblies do not assess disbursed funding, arguably a more precise measure of financing available to deliver interventions, because this was incomplete for the periods under consideration or unobtainable for many bilateral sources.
Assessment of funding adequacy
Kiszewski and colleagues15 developed a model framework to estimate the commodity requirements (pharmaceuticals, diagnostics, insecticides, and treated nets) and supporting infrastructure needed to meet effective malaria control for 81 countries yearly between 2006 and 2015. This framework represents the most comprehensive review of component costs to reach 80% coverage of best practices in case-management and effective disease prevention. The investigators included different sets of interventions and structured their analysis to show differences between sub-Saharan Africa and Asia, Oceania, and the Americas. Optimistic targeted disease-reduction scenarios incorporated changing demands on case management as disease prevention reached appropriate levels of coverage. The effect of single-intervention approaches was reviewed to provide an optimistic scenario that achieved substantive reductions in morbidity and mortality by 2015 and coincidentally included a reduced cost of case management as disease prevention reached high coverage levels. These anticipated optimistic health effects have been used here as in subsequent reviews16,17 because they have been empirically confirmed at selected sites where projected coverage levels have already,18 or almost,19,20 been reached. The predicted annualised per-person “needs” values were extracted under the optimistic projection scenario for the year 2010 and used to compare unmet needs for our definitions of populations at risk of stable P vivax or P falciparum transmission in 2009. For the 15 countries where no projected needs were available we have taken the median yearly per-person estimate of need from countries within the region and applied to those without information (webappendix pp 1–3).
Assessment of funding equity
The examination of financial needs for expanded malaria control must include actual and potential national support from domestic sources. We did not include funding commitments derived from national public expenditure14 because these are incomplete (no records for more than 35 countries) or, where data are available, difficult to interpret. For example, in 2008, the Burundian Government was reported to have committed US$46 million to malaria control activities and the Malawian Government $24 million, compared with $35 500 by the Kenyan Government in the same year. These disparities probably show how broad health-sector bilateral assistance is accounted for rather than showing real differences in government expenditure on malaria.
Eligibility for development assistance is often based on gross domestic product (GDP) or gross national income (GNI).21,22 To examine priorities for future financing of malaria control we ranked countries according to the per-person GDP defined by the World Bank to represent a country's overall economic wealth (webappendix pp 1–3).23 Additionally, we have recalculated needs and examined priority funding accounting for some approximation to eligibility provided by the Development Assistance Committee of the OECD of upper-middle-income countries21 and countries facing unsustainable debt classified by the International Monetary Fund as heavily indebted poor countries.24
Results
In 2007, 16 malaria-endemic countries had not received any international assistance for malaria control (figure 1). By 2009, Azerbaijan, Botswana, Brazil, Congo, and South Korea had all received funding from the Global Fund, leaving 11 countries with no international assistance for malaria control (figure 1). These 11 countries represent less than 0·9% of about 2 billion people exposed to stable P vivax or P falciparum transmission in 2007–09.
Figure 1.
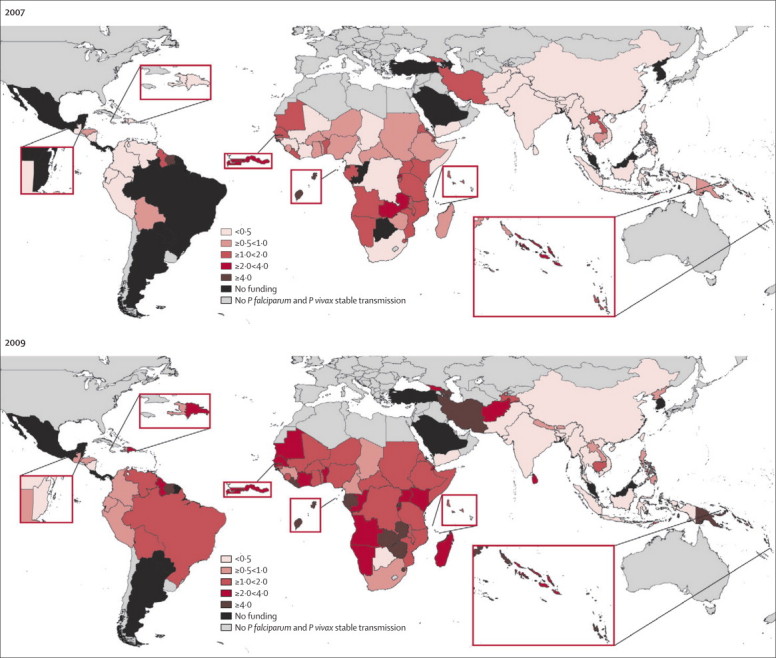
Per-person at-risk donor assistance (US$) by 2007 and 2009 across 93 malaria-endemic countries where stable transmission exists
By the end of 2009, more than US$9·9 billion had been committed by international donor agencies for malaria control in 81 countries where populations were exposed to stable P vivax or P falciparum transmission: 75·6% committed by the Global Fund since 2002, 12·8% by the President's Malaria Initiative since 2004, 4·9% through the World Bank Booster Program since 2006, 1·4% through the US Agency for International Development, and an estimated 5·3% provided through other bilateral and multilateral agencies. Average annualised international donor assistance to malaria-endemic countries rose by 166% from $0·73 billion by the end of 2007 to $1·94 billion by the end of 2009.
Among the 81 endemic countries that have received some international assistance for malaria control since 2002, 26 (32%) continue to receive less than $1 per person at risk in an average year by 2009 (figure 1 and table). However, there has been substantial improvement since 2007 when 47 (61%) of 77 recipient countries were funded at this level (figure 1). The greatest improvements in funding since 2007 have been in Africa, with modest changes in the Americas and, with the exception of Sri Lanka and Papua New Guinea, almost no change across much of southeast Asia (figure 1). Overall there is a strong correlation between funding provided since 2002 and populations at risk of stable transmission across the 81 countries that received funding (figure 2; r=0·76, p<0·001). Although countries with bigger populations at risk tend to get more donor assistance, there are important anomalies. Five countries (Azerbaijan, Suriname, São Tomé and Príncipe, Equatorial Guinea, and Swaziland) were in receipt of more than $10 per person at risk and all were countries with small at-risk populations: 0·05% of the worldwide stable-risk population but receiving 0·9% of the yearly malaria funding commitment. 13 countries by 2009 received more than $4 per person at-risk per year (figure 1), compared with only three countries in 2007 (figure 1); these countries represent 2% of the worldwide population at risk of stable malaria transmission in 2009, but receive 11·8% of the annualised international funding commitment. 37% of people living under stable malaria transmission in 2009 were in India, which received only $0·03 external development assistance per person at risk, and China, which received only $0·28, or 2% of total annualised donor funding for malaria. Neither country is poor, although large sectors of their population live in poverty, and arguably they might be seen as able to fund national malaria control from domestic resources. We use these examples here to illustrate how donor assistance does not always scale with populations at risk.
Table.
Countries according to international funding awarded per person at stable malaria risk per year up to end of 2009 and per-person gross domestic product
| $0 funding per person | $0–1 funding per person | $>1–4 funding per person | $>4 funding per person | |
|---|---|---|---|---|
| ≥$4000 per-person GDP | Argentina,* Belize,* Costa Rica,* Mexico,* Panama,* Saudi Arabia, South Korea, Turkey,* Malaysia,* French Guiana* | Botswana,* Colombia, South Africa* | Brazil,* Dominican Republic, Namibia, Venezuela* | Iran, Gabon,* Equatorial Guinea, Suriname* |
| $≥1000 to <$4000 per-person GDP | Paraguay | Bhutan, Cameroon,† China, Ecuador, Guatemala, Honduras,† India, Indonesia, Nicaragua,† Peru, Philippines, Thailand | Angola, Bolivia,† Congo, Georgia, Guyana, Nigeria, Solomon Islands, Sri Lanka, Sudan | Azerbaijan, Swaziland, Vanuatu |
| ≥$500 to <$1000 per-person GDP | .. | Chad,† Haiti,† Laos, Pakistan, Vietnam, Yemen | Côte d’Ivoire,† Benin,† Cambodia, Comoros, Djibouti, Ghana,† Kenya, Mali,† Mauritania,† Senegal,† Tajikistan | Zambia,† Papua New Guinea, Sã Tomé and Príncipe† |
| <$500 per-person GDP | .. | Bangladesh, Burma, Guinea,† Nepal, North Korea | Afghanistan,† Burkina Faso,† Burundi,† Central African Republic,† Democratic Republic of the Congo,† Eritrea, Ethiopia,† Gambia,† Guinea-Bissau,† Madagascar,† Malawi,† Mozambique,† Niger,† Sierra Leone,† Somalia, Tanzania,† Timor-Leste, Togo,† Uganda† | Liberia,† Rwanda,† Zimbabwe |
Currency is US$. GDP=gross domestic product.
Countries that are regarded by the Development Assistance Committee of the Organisation for Economic Co-operation and Development as middle-high income countries least eligible for donor assistance.
Countries that are regarded as heavily indebted countries that have received or pending debt cancellation.
Figure 2.
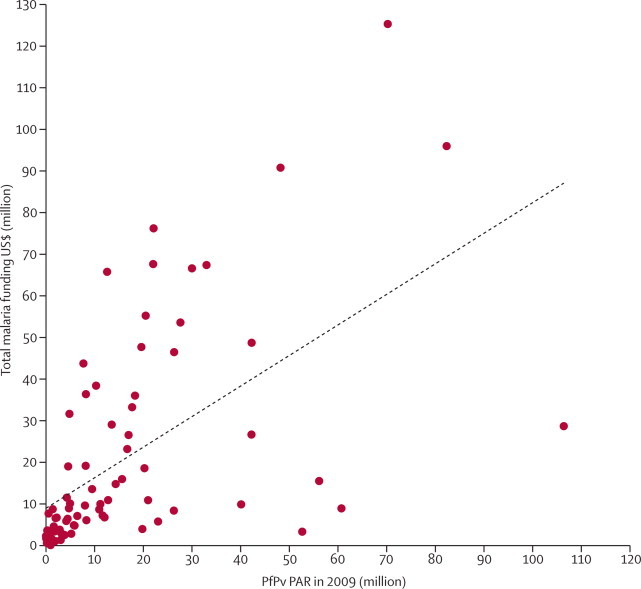
Populations at risk of stable
Plasmodium vivax or Plasmodium falciparum (PfPv PAR) versus cumulative funding commitments (US$) to 80 countries that had received funding by the end of 2009
Does not include two outliers: India with a huge population at risk, 758 million people, but receives only about $0·03 per person at risk per year, and Nigeria because it has more than 167 million people at risk of stable P falciparum infection, distorting the plot of funding and populations at-risk worldwide. In Nigeria funding increased since 2007 from $0·73–1·71 per person at risk in 2009.
As one might expect, most high per-person GDP countries have received no international donor assistance, although four have received a yearly average of more than $4 per person at risk of stable malaria transmission (table). Gabon and Equatorial Guinea receive more than $6 per person at risk of malaria but have per-person GDP estimates of $8137 and $19 582 respectively, higher than most countries studied, with the exception of Malaysia, that have not received any donor assistance; substantially higher than the GDP estimate for Botswana, Namibia, and South Africa, which have not received much donor assistance for control and also higher than that of India and China. Despite evidence of biological equity, there is no correlation between GDP as a measure of economic equity and funding commitments since 2002 (r=0·051, p=0·65).
We used the needs assessment by Kiszewski and colleagues15 to compare per-person at-risk annualised donor assistance for malaria control by 2009 with expected per-person needs for 2010. Of 81 countries that have received any donor support for malaria, 21 (26%) had exceeded their projected yearly per-person needs by 2009; ten (12%) countries were within $0·5 per-person at risk of their projected needs and therefore seen as close to optimum funding; 50 (62%) countries however were below adequate external funding to support malaria prevention and disease management by 2010. Several countries within this group had per-person GDP estimates greater than $4000; however, 16 countries had estimates lower than $500, and ten of these countries were located in Africa and five in Asia (table). Figure 3 shows the prioritisation of future investment by donor agencies to close the gap on projected country-level unmet needs allowing for some index of equity if national funding capacities were included.
Figure 3.
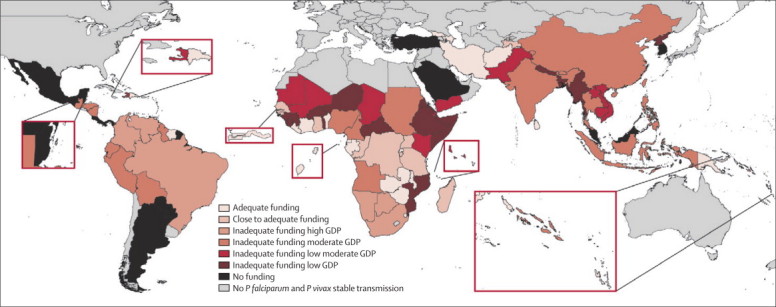
Prioritisation for international donor support based on current per-person per year external malaria donor support and expected needs for 2010
Discussion
Despite substantial increases in international donor assistance to malaria-endemic countries since 2007, worldwide commitment remains below that needed to mount effective coverage of prevention and clinical management strategies necessary to substantially affect disease burden by 2015. The RBM global business plan states that it needs about $4·9 billion in 2010, including the need to ensure rapid scale-up of campaigns for universal access to existing interventions in 43 sub-Saharan African countries and India.1 These estimates fall within the range of the modelled predictions provided by Kiszewski and colleagues for average yearly funding between 2006 and 2015.14 Our assembly of external donor support to 93 malaria-endemic countries shows that, on an average year since 2002, $1·9 billion has been provided as a contribution to scaled malaria control. This funding has increased by 166% since 2007 but is 60% below what RBM has estimated is needed worldwide.
These headline figures suggest that much more is needed but hide the fact that 21 countries, including 12 in Africa, have now reached, or nearly reached, a predicted adequacy in donor assistance for effective malaria control (figure 3). We have defined adequacy of support using populations at risk of stable transmission of either P vivax or P falciparum measured against the predicted needs defined for 2010 through a detailed costing exercise.15 Those countries that rapidly reached adequate levels of donor assistance have small populations at risk, and in many of these countries, risk is not distributed evenly within their borders—eg, Mauritania, Djibouti, Madagascar, Papua New Guinea, Sri Lanka, and Suriname. Measures of funding adequacy for universal coverage therefore imply coverage only within constrained areas within national borders; we cannot capture resources used within a country for those not at risk. Our metrics are useful for worldwide priority setting but demand more appropriate use of national-level malaria risk mapping and knowledge of within-country disbursement to be translated into effective use of funds.
International support for malaria control has been largely biologically equitable, with more funding approved for countries with larger populations at risk (figure 2). The largest anomalies correspond to countries where P vivax is more ubiquitous in its distribution than P falciparum. This finding highlights the neglect of this malaria parasite in worldwide priority setting and financial support. These anomalies are best shown by India and China, two countries with large populations at risk of P vivax malaria that need complex disease surveillance, clinical management, and prevention strategies, and where aspirations for subnational elimination might benefit neighbouring risk-free communities and neighbouring countries sharing similar ambitions such as Sri Lanka, Vietnam, and Thailand. India was singled out as a priority country within the RBM global business plan. Neither India nor China has very high estimates of GDP, or is seen as an upper-middle income country by the OECD (figure 3 and table).21 These classifications, however, could simply show the inadequacy of the GDP/GNI quotient to identify national spending priorities, and explain why countries with higher GDPs such as Gabon and Equatorial Guinea are so well funded through donor assistance despite large per-person incomes from oil revenues. India and China have space programmes and, at the recent meeting of the World Economic Forum in Davos, were seen as the emerging global economies of the next two decades, with growth and per-person income poised to surpass those of the USA and Europe.25 Whether such countries should receive donor assistance for malaria control remains a point worthy of further discussion. However, if we assume that both India, China, and all high GDP countries shown in the table should support malaria-control ambitions from domestic resources, the resource envelope to support worldwide malaria control through international donor assistance changes substantially. Among 70 countries prioritised by these criteria the yearly needs have been estimated to be $2·94 billion;15 current annualised donor commitments to these priority countries covering more than 60% of the worldwide population at malaria risk are $1·83 billion, 38% below what is needed but a gap easier to close than a 54% deficit estimated for all endemic countries by an adjusted needs calculation.15
Economic eligibility for donor assistance and priority setting for the poorest countries least able to support scaled malaria control from national resources needs further debate. As a prelude to this debate we have used a combination of unmet per-person at-risk funding needs and GDP to set some benchmarks for those countries that have the greatest need in 2010 but are possibly the least able to support these through domestic funding (figure 3). At the lowest end of the GDP spectrum, substantial progress has been made to support the poorest countries in Africa, importantly by the increased funding made available through the President's Malaria Initiative since 2005 to augment funding provided by the Global Fund (table). In several countries there is still a need to focus donor attention: these include ten high-priority countries in Africa that represent 22% of Africa's population at risk of malaria, with eight having qualified for assistance as heavily indebted poor countries (excluding Niger and Somalia, which were at a pre-decision point in January 201024) and five high-priority countries in Asia that represent 11% of the at-risk population in this region and none of which receive relief as heavily indebted poor countries (table).
We assessed adequacy and equity (biological and economic) of external donor assistance but have not considered the effectiveness of this funding in our investigation. However, the metrics developed here provide a platform for interpretation of changes in equitable intervention coverage with the national sample household surveys that form the basis for monitoring of RBM progress.26 Countries with adequate external donor assistance to scale up disease prevention and control should do better than their counterparts without adequate financing. In Africa, progress towards universal intervention access and coverage would be expected to be substantially faster in countries such as Rwanda, Zambia, and Equatorial Guinea, which have adequate predicted donor assistance, than in Guinea, Sierra Leone, and Niger, which have inadequate funding. At present, national sample surveys are too infrequent to allow examination of temporal effectiveness of funding within Africa by the end of 2009. Outside Africa, comparable national coverage survey data are incomplete. Monitoring of progress towards universal intervention access must be considered in the context of funding made available to countries; inadequate funding will result in the incomplete coverage of interventions, which will not be solely a failure of national governments but a more collective responsibility. Conversely, adequate funding combined with poor coverage is an issue of accountability for recipient governments and partners.
We have not considered the costs per person at risk for a malaria elimination goal because the cost of moving from effective sustained control to elimination is poorly understood.27 We believe that funding priorities should remain focused on reducing the malaria burden in high-transmission countries.28 Our metrics are essentially based on intervention options for reducing endemicity to levels where malaria is not a major public health threat. These metrics have a documented efficacy and their costs are generally predictable. All the countries that have not received any donor assistance since 2002 (figure 1) have stated that they intend to eliminate malaria, with the exception of French Guiana.23 Other countries that remain poorly funded by the international donor community, but have nonetheless declared an elimination ambition, include South Africa, Namibia, Iran, the Philippines, Haiti, and the Dominican Republic.23 Given the shortfalls that exist in meeting the needs for universal intervention coverage for poor countries with high disease burdens to reach low endemic control, donors should work to ensure a careful approach when supporting different regional and national, less predictable, elimination agendas and ambitions.
We end with the inevitable plea for more money, at a time when developed countries face financial crises of their own. But we would like to emphasise that should funding commitments fall to the levels that applied in 2007 from those in 2009 (figure 1) we run the risk of a resurgence of malaria in countries that have enjoyed the benefits of this funding to provide protection from malaria since 2002.28 Sustained funding in these countries is crucial or $9·9 billion invested since 2002 will have been in vain.
Acknowledgments
Acknowledgments
We thank Caroline Kabaria for help with the map production; Viola Kurui, Richard Carr, and Yoko Akachi for help with data assemblies; Mike English and Kevin Marsh for comments on an earlier draft. We also acknowledge the support of the Kenyan Medical Research Institute (KEMRI). This paper is published with the permission of the director of KEMRI. RWS is a Wellcome Trust Principal Research Fellow (#079080). EAO is a Wellcome Trust Research Training Fellow (#086166). SIH is a Wellcome Trust Senior Research Fellow (#076951). The same grant also supports PWG. This work forms part of the output of the Malaria Atlas Project, which is principally funded by the Wellcome Trust, UK.
Contributors
RWS was responsible for the design of the study and gathering, collation, preparation, analysis, and interpretation of the data, and wrote the report. EAO was responsible for data analysis and preparation of the final report. PWG developed the population-at-risk data and contributed to the preparation of the final report. RA and SIH were involved in the design, interpretation of data, and writing of the final report.
Conflicts of interest
RWS has received funding from Novartis for chairing meetings of national control programmes in Africa and has received a research grant from Pfizer. RA is Director of Strategy, Performance and Evaluation Cluster at the Global Fund to Fight AIDS, Tuberculosis and Malaria. All other authors declare that they have no conflicts of interest.
Web Extra Material
References
- 1.Roll Back Malaria Global Malaria Action Plan for a malaria-free world. 2008. http://www.rollbackmalaria.org/gmap/toc.html (accessed April 29, 2010).
- 2.Global Fund to Fight AIDS. Tuberculosis and Malaria Commitments and disbursements 2009. http://www.theglobalfund.org/en/commitmentsdisbursements/ (accessed March 13, 2010).
- 3.World Bank Booster program for malaria control in Africa. http://siteresources.worldbank.org/extafrboopro/resources/malariareportfinallowres.pdf (accessed Sept 20, 2010).
- 4.Presidents Malaria Initiative PMI Country profiles. Washington DC: Presidents Malaria Initiative. 2009. http://www.fightingmalaria.gov/countries/profiles/index.html (accessed April 3, 2010).
- 5.United Nations Population Division . Human development report, 2003. The millennium development goals: a compact among nations to end human poverty. Oxford University Press; New York: 2003. http://hdr.undp.org/en/media/hdr03_complete.pdf (accessed April 3, 2010). [Google Scholar]
- 6.Snow RW, Guerra CA, Mutheu JJ, Hay SI. International funding for malaria control in relation to populations at risk of stable Plasmodium falciparum transmission. PLoS Med. 2008;5:e142. doi: 10.1371/journal.pmed.0050142. [DOI] [PMC free article] [PubMed] [Google Scholar]
- 7.Baird JK. Neglect of Plasmodium vivax malaria. Trends Parasitol. 2007;23:533–539. doi: 10.1016/j.pt.2007.08.011. [DOI] [PubMed] [Google Scholar]
- 8.Guerra CA, Howes RE, Patil AP, et al. The international limits and population at risk of Plasmodium vivax transmission in 2009. PLoS Negl Trop Dis, 4: e744. [DOI] [PMC free article] [PubMed]
- 9.Guerra CA, Gikandi PW, Tatem AJ. The limits and intensity of Plasmodium falciparum transmission: implications for malaria control and elimination worldwide. PLoS Med. 2008;5:e38. doi: 10.1371/journal.pmed.0050038. [DOI] [PMC free article] [PubMed] [Google Scholar]
- 10.Hay SI, Guerra CA, Gething PW. A world malaria map: Plasmodium falciparum endemicity in 2007. PLoS Med. 2009;6:e1000048. doi: 10.1371/journal.pmed.1000048. [DOI] [PMC free article] [PubMed] [Google Scholar]
- 11.Balk DL, Deichmann U, Yetman G. Determining global population distribution: methods, applications and data. Adv Parasitol. 2006;62:119–156. doi: 10.1016/S0065-308X(05)62004-0. [DOI] [PMC free article] [PubMed] [Google Scholar]
- 12.United Nations Population Division . World urbanization prospects: the 2007 revision population database. United Nations Population Division; New York: 2008. http://esa.un.org/unup/ (accessed Aug 31, 2009). [Google Scholar]
- 13.Organisation for Economic Co-operation and Development Creditor reporting system. http://stats.oecd.org/index.aspx?datasetcode=crsnew (accessed July 20, 2010).
- 14.WHO World malaria report 2009. http://www.who.int/malaria/world_malaria_report_2009/en/index.html (accessed April 3, 2010).
- 15.Kiszewski A, Johns B, Schapira A. Estimated global resources needed to attain international malaria control goals. Bull World Health Organ. 2007;85:623–630. doi: 10.2471/BLT.06.039529. [DOI] [PMC free article] [PubMed] [Google Scholar]
- 16.Yukich JO, Lengeler C, Tediosi F. Costs and consequences of large-scale vector control for malaria. Malar J. 2008;7:e258. doi: 10.1186/1475-2875-7-258. [DOI] [PMC free article] [PubMed] [Google Scholar]
- 17.Eisele TP, Larsen D, Steketee RW. Protective efficacy of interventions for preventing malaria mortality in children in Plasmodium falciparum endemic areas. Int J Epidemiol. 2010;39(suppl 1):88–101. doi: 10.1093/ije/dyq026. [DOI] [PMC free article] [PubMed] [Google Scholar]
- 18.Kleinschmidt I, Schwabe C, Benavente L. Marked increase in child survival after four years of intensive malaria control. Am J Trop Med Hyg. 2009;80:882–888. [PMC free article] [PubMed] [Google Scholar]
- 19.Bhattarai A, Ali AS, Kachur SP. Impact of artemisinin-based combination therapy and insecticide-treated nets on malaria burden in Zanzibar. PLoS Med. 2007;4:e309. doi: 10.1371/journal.pmed.0040309. [DOI] [PMC free article] [PubMed] [Google Scholar]
- 20.Teklehaimanot HD, Teklehaimanot A, Kiszewski A, Rampao HS, Sachs JD. Malaria in Sao Tome and Principe: on the brink of elimination after three years of effective antimalarial measures. Am J Trop Med Hyg. 2009;80:133–140. [PubMed] [Google Scholar]
- 21.Donor Assistance Committee. OECD DAC list of ODA recipients used for 2008, 2009, and 2010 flows. http://www.oecd.org/dac/stats/daclist/ (accessed Sept 20, 2010).
- 22.Global Fund to Fight AIDS. Tuberculosis and Malaria Country eligibility criteria. http://www.theglobalfund.org/en/eligibility/ (accessed July 20, 2010).
- 23.World Bank . Worldwide governance indicators. World Bank; Washington, DC: 2009. http://data.worldbank.org/indicator/ny.gdp.pcap.cd (accessed April 3, 2010). [Google Scholar]
- 24.International Monetary Fund Debt relief under the heavily indebted poor countries (HIPC) initiative. http://www.imf.org/external/np/exr/facts/pdf/hipc.pdf (accessed Sept 20, 2010).
- 25.BBC Davos 2010: the West accepts India and China as equals. Jan 28, 2010. http://news.bbc.co.uk/2/hi/business/8486094.stm (accessed May 5, 2010).
- 26.Roll Back Malaria Monitoring Evaluation and Reference Group. http://www.rollbackmalaria.org/mechanisms/merg.html (accessed April 29, 2010).
- 27.Feachem RGA, Phillips AA, Targett GA, on behalf of the Malaria Elimination Group, editors. Shrinking the Malaria Map: a prospectus on malaria elimination. The Global Health Group, University of California—Santa Cruz Global Health Sciences; San Francisco, USA: 2009. p. 187.http://www.malariaeliminationgroup.org/sites/default/files/fileuploads/AProspectusonMalariaElimination.pdf (accessed April 29, 2010). [Google Scholar]
- 28.Snow RW, Marsh K. Malaria in Africa: progress and prospects in the decade since the Abuja Declaration. Lancet, 376: 137–39. [DOI] [PMC free article] [PubMed]
Associated Data
This section collects any data citations, data availability statements, or supplementary materials included in this article.