

Introduction
The microcirculation plays a fundamental role in the pathophysiology of several cardiovascular disorders. Its primary function is to regulate the delivery of oxygen and other nutrients to the myocardium. Although the myocardial microcirculation cannot currently be directly visualized in vivo, its integrity and function can be inferred by several noninvasive imaging techniques. Cardiac magnetic resonance (CMR) imaging is an extremely versatile modality, and it is particularly useful for the evaluation of the microcirculation. The integrity of the microcirculation can be evaluated by use of contrast-enhanced first-pass perfusion imaging and late gadolinium enhancement imaging; in addition, insights into its functional capacity are surmised via evaluation of its perfusion reserve and its capacity to deliver oxygen. In this review we will discuss the role of CMR for evaluating the microcirculation in the context of a variety of cardiac disorders.
Basic Principles of Image Preparation and Acquisition for Perfusion Imaging
Regardless of the imaging modality used for assessing myocardial perfusion, the signal measured must adequately differentiate normally perfused myocardial segments from abnormally perfused segments. Contrast-enhanced CMR was initially used to estimate the perfusion reserve by Miller et al1 in 1989. A year later, Atkinson et al2 developed a technique that enabled a more dynamic evaluation of perfusion using first-pass imaging. Images are serially acquired in 1 or more preselected imaging planes as an intravenously administered bolus of a gadolinium chelate transits the vasculature and eventually the myocardium. As gadolinium migrates through the right-sided cardiac chambers, the pulmonary vasculature, the left-sided chambers, and ultimately, the myocardium, a bright signal is generated (Figure 1). The rate of signal increase as the contrast agent initially perfuses a tissue is a gauge of blood flow.3
Figure 1.
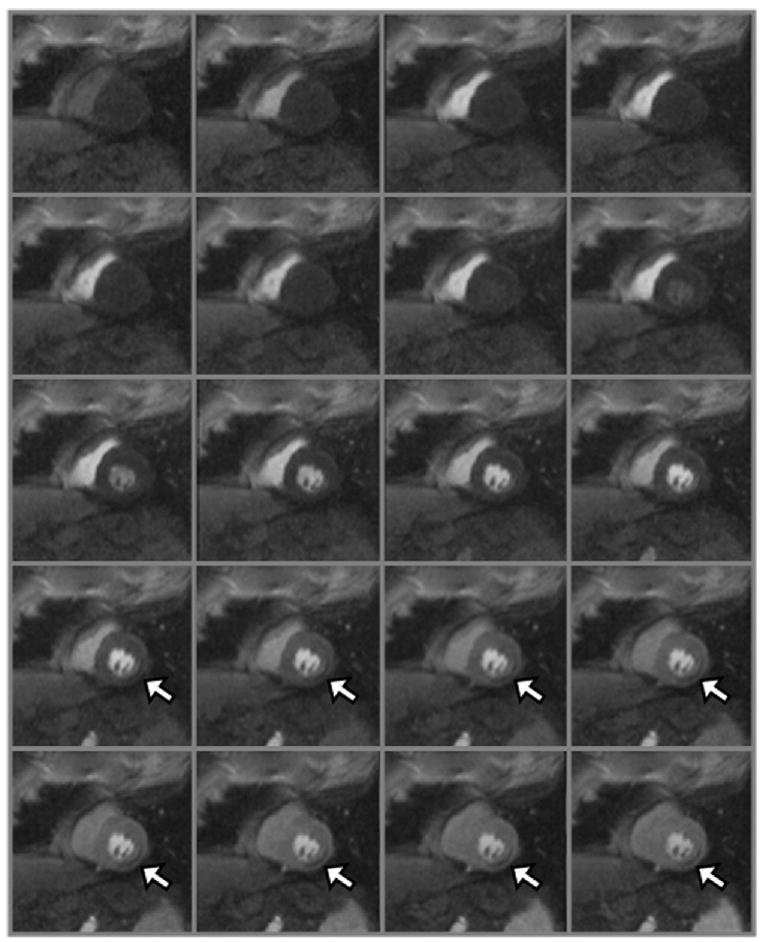
Twenty frames of a first-pass perfusion CMR study are shown. It should be noted that the signal intensity increases in the right ventricle as the gadolinium passes through. Next, the signal in the pulmonary vasculature increases, followed by the left ventricle and the aorta. Ultimately, the signal enhances in the myocardium. A perfusion defect (arrows) is present in the inferolateral wall.
The signal generated, as well how closely it is correlated to myocardial blood flow, is also a function of the specific CMR pulse sequence parameters used. To generate a signal by use of magnetic resonance, the magnetization must be manipulated by applying a brief radiofrequency pulse to flip the proton alignment into the transverse plane. Once the radiofrequency pulse is completed, the protons return to their previous alignment. The rate at which the proton alignment recovers determines the longitudinal relaxation time (T1) of the tissue. Gadolinium is a paramagnetic contrast agent that shortens the T1 of neighboring protons, ultimately causing increased signal intensity in a concentration-dependent manner for T1-weighted images. In addition to the gadolinium concentration, the magnitude of the T1-weighted signal is dependent on the type of magnetization preparation used. The initial perfusion CMR studies were performed by use of an inversion recovery pulse sequence.2 Because inversion recovery can be used to null the signal from tissues that are not exposed to gadolinium, a large signal contrast exists between hypoperfused and normally perfused tissues. However, inversion recovery schemes of magnetization preparation are less reliable in the presence of arrhythmias and require long acquisition times that compromise temporal resolution and limit the number of left ventricular slices that can be acquired during 1 cardiac cycle.
A more commonly used approach to magnetization preparation is saturation recovery.4 Saturation recovery is insensitive to arrhythmias, has a shorter acquisition window than inversion recovery, and more readily allows multislice coverage with an improved temporal resolution at the expense of reduced signal contrast between normally perfused and hypoperfused tissues. In experimental models and in clinical practice, the resultant contrast difference is sufficient to make a diagnosis.5 The amount of signal generated by a given concentration of gadolinium also depends on the time delay between magnetization preparation and image acquisition.6 Specifically, shorter delays allow for improved discrimination of higher concentrations of gadolinium, whereas longer delays allow for improved differentiation between lower concentrations of gadolinium.
Another important component of the CMR pulse sequence is the method of image acquisition. Currently, 3 approaches are most commonly used: gradient recalled echo (GRE),2 hybrid GRE and echo-planar imaging (GRE-EPI),7 and balanced steady-state free precession (SSFP).8 Each approach has its unique set of advantages and disadvantages. No consensus exists as to the best technique for image acquisition. The use of parallel imaging shortens the time necessary to acquire an image and likely reduces blurring and improves image quality of all 3 approaches.9,10
Of the 3 techniques, SSFP-based approaches have the highest contrast-to-noise ratio and the signal is most linearly related to the underlying gadolinium concentration.11 However, the technique also requires a longer imaging duration, resulting in more blurring and motion artifact. SSFP is fairly vulnerable to susceptibility artifact. On the other hand, GRE-EPI has the most extensive spatial coverage and the shortest imaging duration, which results in less blurring and better image quality at higher heart rates. The signal is also linearly correlated with the concentration of gadolinium, but higher gadolinium concentrations are underestimated and the overall contrast-to-noise ratio is less than that for SSFP-based images. GRE-based techniques have the lowest contrast-to-noise ratio and the poorest relationship between signal and gadolinium concentration. The image duration is similar to SSFP, but the image quality may be better than with SSFP at higher heart rates. In a direct comparison of GRE-EPI and GRE, Elkington et al12 studied 15 patients under resting and hyperemic conditions using both techniques. They found that GRE-EPI had a significantly higher contrast-to-noise ratio but it did not translate into an improved detection of ischemia or a reduction in artifacts.
An important challenge of perfusion CMR is the so-called dark rim artifact, which mimics a hypoperfused segment on the subendocardial border.13,14 The etiology of the artifact is not clearly defined but appears to be related to cardiac motion, partial-volume effects between the left ventricular cavity and the myocardium, and sudden changes in the concentration of contrast agent in the left ventricular blood pool and the myocardium. Whatever the etiology, the artifact is less pronounced when the hybrid GRE-EPI pulse sequence and parallel imaging are used.
Quantification of Myocardial Blood Flow
A major advantage of perfusion CMR is the ability to quantify myocardial blood flow. The signal intensity changes that occur as gadolinium transits the myocardium can be used to generate time-intensity curves. Semiquantitative estimates of perfusion, such as the rate at which the signal enhances or the peak signal intensity that is achieved, have been used to detect coronary artery disease15 and are correlated reasonably well to flow determined by positron emission tomography16,17 and invasive fractional flow reserve.18 However, these simplified indexes of perfusion underestimate absolute myocardial blood flow.19 An absolute measurement of myocardial blood flow in milliliters per minute per gram of tissue during a myocardial perfusion imaging study would be desirable. In an idealized situation, this can be determined by measuring how quickly a contrast agent flows out of a region of interest (washout or tissue impulse response). However, an accurate measurement requires that the entire contrast bolus arrive instantaneously into the region of interest. Such circumstances necessitate that the contrast agent be injected directly into the coronary artery. When injected peripherally, upstream dispersion distorts the contrast bolus into a bell-shaped curve, preventing the entire bolus from arriving instantaneously into the region of interest. As the bell-shaped bolus travels through the myocardium, the concentration of contrast agent entering the tissue initially increases; therefore, as the low-concentration part of the contrast agent is washing out, a higher concentration of contrast is simultaneously entering the tissue. Effectively, the changing bolus concentration (or arterial input function [AIF]) masks the actual tissue impulse response. In fact, the signal (or time-intensity curve) actually generated as the bolus transits the myocardium (tissue function) is a fusion (convolution) of the AIF and the actual tissue impulse response. By use of a constrained Fermi function deconvolution (Figure 2), the tissue impulse response can be untwisted from the AIF and tissue function. The amplitude of the tissue impulse response is a measure of absolute myocardial blood flow.20,21 Therefore a fully quantitative perfusion reserve is simply a ratio of the impulse response amplitudes obtained during hyperemia and during resting conditions.
Figure 2.
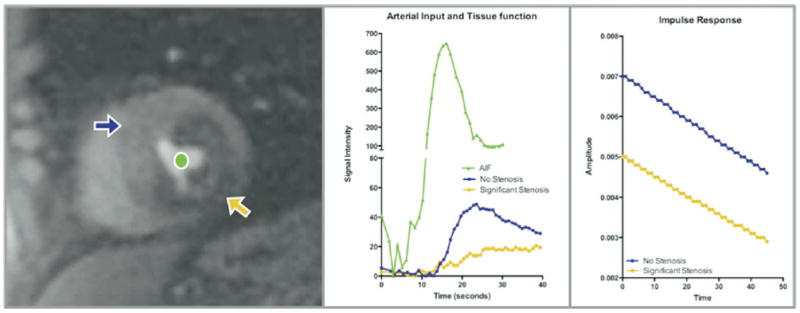
Left, Short-axis slice of left ventricle, shown at peak enhancement during first-pass perfusion imaging. The orange arrow points to a large perfusion defect in the inferolateral wall, which is visually apparent, and the purple arrow points to a region with normal perfusion. The green circle is in the left ventricular cavity. Middle, Time-intensity curves generated as gadolinium traverses the left ventricular cavity and the normal and abnormal myocardial segments. By deconvolution of the tissue function (purple and orange curves) from the AIF (green curve), an impulse response is generated (right). The initial amplitude of the impulse response (which is a measure of myocardial blood flow) is much higher for the normal (purple) sector than for the abnormal (orange) sector.
An accurate assessment of myocardial blood flow requires precise measurement of the gadolinium concentration both in the left ventricular cavity and in the myocardium. This is typically accomplished by use of a low concentration of gadolinium; however, a low concentration of gadolinium is suboptimal for visual interpretation of the tissue perfusion. To solve this problem, Christian et al19 proposed using a dual-bolus technique in which the AIF is measured using a very low dose of gadolinium and the tissue function is separately measured using a full dose. Measurements of myocardial blood flow made via the dual-bolus technique are strongly correlated to gold-standard microsphere measurements of myocardial blood flow, up to 5 mL · min−1 · g−1 (r = 0.95, P < .001). Alternatively, dual-contrast techniques simultaneously acquire low-resolution images, which do not underestimate the AIF, and high-resolution and higher-signal images, which provide adequate contrast enhancement for the tissue perfusion.22
Microcirculation in Cardiovascular Disorders
Microvascular Obstruction in Acute Myocardial Infarction
One of the more destructive insults afflicting the microcirculation occurs after an acute myocardial infarction. Prolonged ischemia causes myocardial necrosis and microvascular obstruction propagated by an inflammatory process, resulting in the accumulation of neutrophil plugs, endothelial swelling, and compression of capillaries between swollen myocytes.23 On the basis of experiments using radiolabeled microspheres, it is known that these regions are also characterized by very low regional myocardial blood flow. Given its high spatial and contrast resolution, dynamic contrast-enhanced CMR provides a unique opportunity to study microvascular obstruction. The distribution of gadolinium in a tissue is dependent on its perfusion and on the extent of extracellular space present in the tissue. After an acute myocardial infarction, the myocardium will display 1 of several patterns of contrast enhancement.24 As gadolinium perfuses normal myocardium, the T1-weighted signal intensity will rapidly increase, plateau, and then decrease as the gadolinium washes out. Alternatively, in myocardial segments supplied by the infarct-related artery, 2 distinct patterns of contrast enhancement are seen. In the periphery of the infarcted region, the signal intensity will increase slightly more slowly than in normal myocardium and a hyperintense signal plateau will persist over a period of 10 minutes. On the other hand, contrast enhancement will occur very slowly in the core of the infarcted region and will be hypointense in comparison to the periphery, and this hypointensity will persist for several minutes (Figure 3). The persistently hypointense region at the core of the infarcted segment represents microvascular obstruction with disruption of the microcirculatory architecture and severely reduced myocardial blood flow.25 The delayed contrast penetration is due to widespread microvascular damage and a decrease in the functional capillary density, resulting in a large increase in the time required for the contrast agent to diffuse into the extracellular space.
Figure 3.
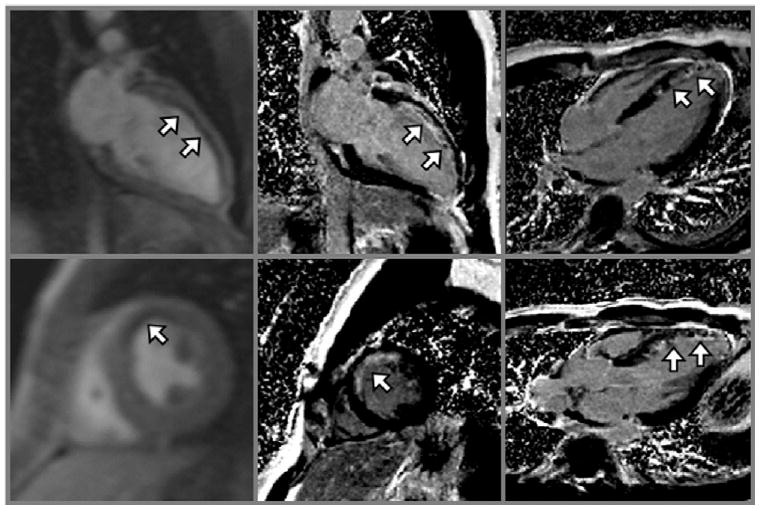
Left, Two-chamber view and left ventricular short-axis view shown at peak enhancement during first-pass perfusion imaging in a patient who had a recent acute myocardial infarction. The white arrows point to hypointense regions representing perfusion defects. The corresponding late gadolinium-enhanced images (middle) and other views (right) show hypointense regions of microvascular obstruction surrounded by large areas of hyperintensity representing myocardial scar (white arrows).
By use of CMR, it has been shown that microvascular obstruction expands up to 3-fold during the initial 48 hours after a myocardial infarction26 and persists for at least 9 days.27 Rogers et al28 showed that the pattern of contrast enhancement after an acute myocardial infarction could predict the likelihood of functional recovery after revascularization. Segments of myocardium that had reduced signal enhancement during first-pass perfusion imaging and remained hypoenhanced on follow-up imaging at 5 to 7 minutes after contrast infusion, evidence of microvascular obstruction, were irreversibly damaged. Hombach et al29 studied 110 patients within a week of having an acute myocardial infarction and found that the presence of persistent microvascular obstruction was predictive of adverse left ventricular remodeling. Wu et al,30 moreover, showed in 44 patients that the presence of microvascular obstruction identified by use of CMR predicted the occurrence of cardiovascular complications independently of the underlying infarct size and left ventricular ejection fraction.
Microcirculation and Coronary Artery Disease
The profoundly reduced myocardial blood flow in regions with microvascular obstruction and in regions with myocardial infarction without microvascular obstruction is easily identified via contrast-enhanced CMR. The ability to detect more subtle abnormalities in microvascular function by use of perfusion imaging requires expanded coverage of the heart, a high temporal resolution, excellent image quality, and a strong correlation between the signal generated as the gadolinium perfuses the myocardium and underlying myocardial blood flow. To meet these requirements, Ding et al7 modified an interleaved gradient-echo EPI sequence (GRE-EPI) to be applied for multislice first-pass myocardial perfusion imaging. Using this technique, they were able to acquire up to 8 separate slices of the left ventricle during each cardiac cycle for perfusion imaging with a limited sensitivity to susceptibility-related artifacts.
The survival of myocardial cells requires the maintenance of a minimum capillary hydrostatic pressure.31 In the presence of an upstream coronary stenosis, auto-regulatory mechanisms maintain this hydrostatic pressure by adjusting the resistance in the precapillary arterioles. Once the autoregulatory capacity has been exhausted, the hydrostatic pressure is maintained through a process of capillary derecruitment, ultimately resulting in a reduction in myocardial blood flow and myocardial blood volume. Using the GRE-EPI pulse sequence, Kwong et al32 exploited the changes that occur in the microcirculation in the presence of critical coronary stenoses to identify high-risk patients presenting with acute chest pain. They studied 161 consecutive patients presenting with at least 30 minutes of chest pain using a combination of resting first-pass perfusion imaging and late gadolinium-enhancement imaging. The presence of a perfusion defect or late gadolinium enhancement identified acute coronary syndromes with a sensitivity of 84% and a specificity of 85%. When combined with adenosine perfusion imaging, patients with normal studies were very unlikely to be diagnosed with coronary artery disease during the ensuing year.33
Although the presence of a hypointense signal by visual inspection can identify segments of myocardium that are hypoperfused, as described earlier, an important advantage of perfusion CMR is the ability to absolutely measure myocardial blood flow by deconvolution of the AIF from the tissue function. This powerful tool can be used to improve our understanding of the pathophysiology of many cardiac disorders. Selvanayagam et al34 used this technique to determine whether regions of hibernating myocardium have a reduction in the resting myocardial blood flow. In a group of patients with resting wall motion abnormalities thought to be due to the presence of a severe coronary stenosis, the resting myocardial blood flow was 0.7 ± 0.2 mL · min−1 · g−1 in regions of hibernating myocardium and 1.2 ± 0.3 mL · min−1 · g−1 in normal segments (P < .001). After revascularization of the vessels supplying the hibernating myocardium, both myocardial blood flow and resting wall motion normalized. Other investigators have analyzed the kinetics of myocardial contrast enhancement using model-independent methods of deconvolution to gain insight into the extent of collateral circulation present in the myocardium.35 Specifically, the delayed arrival of an injected tracer into the myocardium during basal conditions appears to be a marker of collateral-dependent myocardium.
Although resting myocardial blood flow is reduced in regions of microvascular obstruction after a myocardial infarction and in hibernating myocardium supplied by a critical coronary stenosis, it is typically preserved in the presence of most coronary stenoses. When normal myocardium has an increased oxygen demand, autoregulatory mechanisms in the microcirculation reduce the resistance in the arterioles to effectively increase myocardial blood flow.36 The ability to increase perfusion to meet the metabolic demands of the myocardium is described as the perfusion reserve. As discussed previously, resting myocardial blood flow distal to a stenosis is maintained via these same autoregulatory mechanisms, but its perfusion reserve is diminished because the autoregulatory capacity of the microcirculation has already been exhausted. Vasodilator stress testing takes advantage of the diminished perfusion reserve distal to a significant stenosis to identify regions of myocardium that are supplied by a hemodynamically significant coronary stenosis.
Klocke et al37 showed that perfusion CMR may be sensitive enough to detect reductions in flow reserve greater than 35%, suggesting that 50% stenoses may be detectable even in the absence of underlying myocardial scar. In a recent meta-analysis of 14 studies, CMR perfusion imaging had a sensitivity of 91% and a specificity of 81% for detecting significant coronary artery disease.38 A recent multicenter trial suggested that CMR perfusion imaging performed at least as well as single photon emission computed tomography imaging.39 Some authors have suggested that the diagnostic performance of perfusion CMR might be further improved by using an algorithm that incorporates late gadolinium-enhancement imaging.40 Vasodilator stress perfusion CMR has been shown to have prognostic importance. The absence of ischemia during a perfusion CMR study was associated with a 2-year event-free survival rate of 99.2%.41
Taking advantage of the ability to fully quantify myocardial blood flow using perfusion CMR, Cullen et al42 showed that CMR-measured perfusion reserve was inversely correlated with the severity of underlying coronary stenosis (r = −0.81, P < .01) (Figure 4). Futamatsu et al43 prospectively compared the diagnostic performance of fully quantitative analysis of perfusion CMR against semiquantitative and visual interpretation schemes. By use of fractional flow reserve as the reference standard, perfusion reserve measured via deconvolution most accurately identified the presence of hemodynamically significant coronary stenoses.44 Our group has also shown that the perfusion reserve cutoff value can be optimized to detect the desired severity of coronary stenosis.45 A higher perfusion reserve cutoff value (<1.85) is better for detecting coronary stenoses greater than 50%, whereas a lower cutoff value (<1.55) is optimal for detecting stenoses greater than 70%. Furthermore, when compared with fully quantitative perfusion reserve analysis, visual interpretation underestimated the ischemic burden in patients with 3-vessel coronary artery disease and did not adequately differentiate single-vessel disease from 3-vessel disease. Selvanayagam et al46 have shown that perfusion reserve typically improves after revascularization but noted that regions of myocardium showered by emboli from atherosclerotic plaques disrupted during percutaneous revascularization had evidence of new late gadolinium enhancement and did not have an acute improvement in perfusion reserve.
Figure 4.

Myocardial perfusion reserve is inversely related to the severity of coronary artery stenosis. (Reprinted with permission from Cullen et al.42)
Other Causes of Microcirculatory Dysfunction
Although compensatory changes that occur in the microcirculation in the presence of a severely stenotic coronary artery are exploited to facilitate the diagnosis of significant coronary disease, primary impairment of the coronary microcirculation also exists and contributes independently to cardiac risk47; therefore careful evaluation of its role in other cardiac pathologies is warranted.48 Because quantitative perfusion CMR accurately measures myocardial blood flow, it holds the promise of detecting microvascular dysfunction caused by subclinical atherosclerosis. The MESA (Multi-Ethnic Study of Atherosclerosis) investigators used perfusion CMR to better understand microcirculatory function in asymptomatic individuals with evidence of coronary artery calcification but without a prior history of coronary heart disease.49 In the 222 persons they studied, the resting myocardial blood flow did not change as a function of coronary artery calcium score, but both the hyperemic myocardial blood flow and the perfusion reserve were inversely related to the extent of coronary calcium. In fact, nearly 80% of middle-aged asymptomatic individuals with a calcium score greater than 400 had an abnormal perfusion reserve.
In the same cohort the MESA investigators studied the relationship between myocardial perfusion reserve and risk factors for coronary artery disease.50 Resting myocardial blood flow was positively correlated with the rate-pressure product and was higher in women and those with elevated high-density lipoprotein cholesterol levels. Resting perfusion also increased as a function of age and total cholesterol level. On the other hand, the investigators found that hyperemic myocardial blood flow was lower in men and was strongly affected by age. It was also reduced in those with higher blood pressure, higher fasting blood glucose levels, and higher low-density lipoprotein cholesterol levels.
Diabetes mellitus is considered to be a coronary artery disease equivalent. Several investigators have shown that diabetes is associated with microvascular dysfunction and diabetic neuropathy. Taskiran et al51 investigated the relationship between the 2 abnormalities using quantitative perfusion CMR. They used myocardial perfusion reserve as a marker of microvascular dysfunction and measured it in diabetic patients with and without diabetic neuropathy. Although both groups had a similar incidence of microalbuminuria and retinopathy, those with diabetic neuropathy had a significantly lower perfusion reserve. No difference in resting perfusion was present. The authors speculated that the inadequate perfusion reserve seen in patients with diabetic neuropathy was a result of defective prearteriolar vasodilatation caused by a defective sympathetic nervous system.
Opportunities to directly observe the microcirculation are limited during a physical examination. Although the caliber of retinal arterioles seen during a fundoscopic examination provides a window into the structure of the microcirculation, it is unknown whether this physical examination finding is a surrogate for microcirculatory function in the myocardium. Wang et al52 examined this relationship in 212 asymptomatic patients and found that for every 1-μm reduction in central retinal arteriolar equivalents, there was a 0.009–mL · min−1 · g−1 reduction in hyperemic myocardial blood flow (P = .04) and a decrease of 0.09 in the perfusion reserve (P = .05). This relationship was most pronounced in individuals who did not have any coronary artery calcium, whereas the relationship no longer persisted in the presence of coronary calcification, supporting the notion that microvascular dysfunction can occur independently of epicardial atherosclerosis.
Although it has previously been shown that significant reductions in resting myocardial blood flow due to the presence of a critical coronary stenosis results in downregulation of regional wall motion, it is unknown whether the subclinical reduction in hyperemic myocardial blood flow that is related to various risk factors for atherosclerosis is also associated with reduced regional myocardial function. Because CMR can quantify regional strain and myocardial perfusion with a high spatial resolution, Rosen et al53 used it to study 74 asymptomatic participants without a history of cardiac disease. Strain was quantified via myocardial tagging. Circumferential strain decreased by −0.9% (where more negative numbers imply greater strain) for every 1–mL ·min−1 · g−1 increase in myocardial blood flow during hyperemia. Individuals with hyperemic myocardial blood flow in the lowest tenth percentile (<1.8 mL · min−1 · g−1) had a mean circumferential systolic shortening of −13.9%, whereas it was −16.7% in those with a higher hyperemic myocardial blood flow (P < .01). Because the investigators did not perform late gadolinium-enhancement imaging, the presence of an underlying myocardial scar could not be excluded.
Transmural Perfusion Gradients
The combination of accurate quantification of myocardial perfusion and the excellent spatial resolution of CMR enables the detection of differences in subendocardial and subepicardial blood flow.54 Under normal conditions, myocardial blood flow is higher in the subendocardium than in the subepicardium55 because autoregulation at the arteriolar level reduces the vascular resistance in the subendocardium to compensate for the effects of highly compressive forces generated by the left ventricle.56,57 Because much of the autoregulatory capacity of the microcirculation is exhausted to overcome these compressive forces, the subendocardium has a limited perfusion reserve compared with the subepicardium. Lee et al58 validated that perfusion CMR was sensitive enough to noninvasively detect this transmural perfusion gradient in a chronically instrumented dog model. They showed that the gradient increases exponentially with the severity of stenosis and suggest that the presence of an abnormal transmural gradient may occur before a significant reduction in perfusion reserve.
Muehling et al59 studied the regional heterogeneity of myocardial blood flow in 17 volunteers. Resting myocardial blood flow was 1.4 mL · min−1 · g−1 in the subendocardium and 0.9 mL · min−1 · g−1 in the subepicardium (P < .01), but during hyperemic conditions, the subepicardial blood flow increased more than the subendocardial blood flow, resulting in a higher subepicardial perfusion reserve (4.8 vs 3.5, P < .01). Petersen et al60 used perfusion CMR to better define the relationship between the microcirculatory dysfunction and fibrosis known to occur in hypertrophic cardiomyopathy. In 35 hypertrophic cardiomyopathy patients with a relatively low risk profile, they found that hyperemic myocardial blood flow was inversely related to the incidence of fibrosis or late gadolinium enhancement. In fact, the odds for fibrosis in a myocardial segment increased by 2.2:1 for each 1–mL · min−1 · g−1 decrease in blood flow during hyperemia. These investigators also found that subendocardial blood flow was disproportionately reduced and inversely related to the magnitude of hypertrophy. They speculated that this abnormal flow through microcirculation may lead to the development of fibrosis and that it may be a novel risk factor for sudden cardiac death in these patients.
In patients who have had a heart transplant, Muehling et al61 took advantage of the high spatial resolution of perfusion CMR to identify those who may have had a prior episode of transplant rejection or have transplant arteriopathy. Patients without evidence of left ventricular hypertrophy or a history of rejection had a perfusion reserve of 3.6 ± 0.7, whereas those with hypertrophy or a history of rejection had a reduced perfusion reserve of 2.7 ± 0.9 (P < .03). Furthermore, patients with angiographically defined transplant arteriopathy had the lowest perfusion reserve. In a selected group of patients, transplant arteriopathy could be diagnosed with a sensitivity of 100% and a specificity of 80% by the presence of an abnormal resting subendocardial-to-subepicardial blood flow ratio. The authors also found that the subendocardial-to-subepicardial ratio was strongly correlated with invasive measurements of coronary flow reserve.
Another potential role for the high spatial resolution of perfusion CMR is the evaluation of patients with coronary microvascular dysfunction or cardiac syndrome X. The microvascular abnormalities in these patients often result in symptomatic ischemia despite the absence of significant epicardial coronary disease. Using perfusion CMR, Panting et al62 showed that, in these patients, the myocardial perfusion reserve index was significantly reduced in the subendocardium but not in the subepicardium. Wohrle et al63 showed that the myocardial perfusion reserve index was blunted in response to both intravenous adenosine and intracoronary acetylcholine and correlated strongly with invasive Doppler measurements of coronary blood flow reserve. They noted that cardiac syndrome X patients with an abnormal perfusion reserve were more likely to have elevated serum levels of inflammatory markers, suggesting that inflammation plays an important pathophysiologic role in the microvascular dysfunction that is the hallmark of this disease.
Newer CMR Techniques for Evaluating Microcirculation
Unique to CMR perfusion imaging is the ability to determine perfusion without the use of exogenous contrast agents. One approach, arterial spin labeling (ASL), uses endogenous water as a freely diffusible tracer.64 Although numerous implementations are possible, in some approaches protons in water molecules located in a slice proximal to the desired imaging slice are inverted or labeled. As these labeled protons enter the desired imaging slice, an apparent change in the T1 of the imaging slice occurs. By use of specific variants of ASL, quantification of myocardial blood flow is feasible.65 An important limitation of ASL is that a large increase in flow results in a relatively small increase in signal. Despite this limitation, when combined with vasodilator stress testing, territories supplied by a stenotic coronary artery have a measurably lower perfusion reserve than segments supplied by normal coronary arteries.66
A major function of the microcirculation is to deliver oxygen to the tissue that it perfuses. CMR provides a unique opportunity to study oxygen delivery and uptake via blood oxygen level–dependent (BOLD) imaging. BOLD imaging takes advantage of the fact that deoxygenated hemoglobin changes proton signals in such a way as to reflect blood oxygenation.67 In normal volunteers Li et al68 used BOLD imaging to detect alterations in the relationship between myocardial oxygen supply and demand caused by vasodilators and inotropes. Segments of myocardium distal to a significant stenosis can only maintain adequate tissue oxygenation by increasing myocardial blood volume.69 As the myocardial blood volume increases, the amount of deoxygenated hemoglobin present increases. As such, Wacker et al70 showed that, under resting conditions, myocardial segments supplied by a stenosed coronary had a significantly lower BOLD signal than normal segments and that this difference could be amplified by using vasodilators. An important limitation of BOLD imaging is that significant changes in perfusion result in relatively small changes in signal.71 Newer, multislice techniques with a more robust signal response are currently under development72 (Figure 5). In addition to ASL's ability to estimate myocardial blood flow without the use of exogenous contrast agents, some investigators have combined it with BOLD imaging to quantify the rate of regional myocardial oxygen consumption.73,74
Figure 5.

Top, BOLD images acquired during resting conditions and after a left circumflex intracoronary adenosine injection. The hyperintensity in the inferolateral wall (arrowheads) on stress images but not on rest images should be noted. Bottom, Graph showing strong correlation between BOLD signal and myocardial blood flow determined by radiolabeled microspheres. LCx, Left circumflex artery; LAD, left anterior descending artery. (Reprinted with permission from Fieno et al.72)
Conclusion
In this review we have examined the role of perfusion CMR for evaluating the integrity and function of the microcirculation. We have discussed the techniques for fully quantifying myocardial blood flow and the impact of different imaging parameters on quantification. Perfusion CMR not only identifies the presence of microvascular obstruction after a myocardial infarction but also relates it to patient prognosis. The ability to absolutely quantify myocardial blood flow improves the detection and evaluation of epicardial coronary disease and its risk factors. CMR perfusion imaging has proved to be an invaluable tool for understanding the integral role of the microcirculation in a variety of other cardiac disorders. Another advantage of perfusion CMR is the ability to measure differences in subendocardial and subepicardial blood flow. Newer techniques such as ASL and BOLD imaging promise to further improve the ability of CMR to assess the microcirculation without the use of exogenous contrast agents.
Acknowledgments
The authors have indicated they have no financial conflicts of interest.
References
- 1.Miller DD, Holmvang G, Gill JB, Dragotakes D, Kantor HL, Okada RD, et al. MRI detection of myocardial perfusion changes by gadolinium-DTPA infusion during dipyridamole hyperemia. Magn Reson Med. 1989;10:246–55. doi: 10.1002/mrm.1910100209. [DOI] [PubMed] [Google Scholar]
- 2.Atkinson DJ, Burstein D, Edelman RR. First-pass cardiac perfusion: Evaluation with ultrafast MR imaging. Radiology. 1990;174:757–62. doi: 10.1148/radiology.174.3.2305058. [DOI] [PubMed] [Google Scholar]
- 3.Manning WJ, Atkinson DJ, Grossman W, Paulin S, Edelman RR. First-pass nuclear magnetic resonance imaging studies using gadolinium-DTPA in patients with coronary artery disease. J Am Coll Cardiol. 1991;18:959–65. doi: 10.1016/0735-1097(91)90754-w. [DOI] [PubMed] [Google Scholar]
- 4.Tsekos NV, Zhang Y, Merkle H, Wilke N, Jerosch-Herold M, Stillman A, et al. Fast anatomical imaging of the heart and assessment of myocardial perfusion with arrhythmia insensitive magnetization preparation. Magn Reson Med. 1995;34:530–6. doi: 10.1002/mrm.1910340408. [DOI] [PubMed] [Google Scholar]
- 5.Wilke N, Jerosch-Herold M, Wang Y, Huang Y, Christensen BV, Stillman AE, et al. Myocardial perfusion reserve: Assessment with multisection, quantitative, first-pass MR imaging. Radiology. 1997;204:373–84. doi: 10.1148/radiology.204.2.9240523. [DOI] [PubMed] [Google Scholar]
- 6.Bertschinger KM, Nanz D, Buechi M, Luescher TF, Marincek B, von Schulthess GK, et al. Magnetic resonance myocardial first-pass perfusion imaging: Parameter optimization for signal response and cardiac coverage. J Magn Reson Imaging. 2001;14:556–62. doi: 10.1002/jmri.1219. [DOI] [PubMed] [Google Scholar]
- 7.Ding S, Wolff SD, Epstein FH. Improved coverage in dynamic contrast-enhanced cardiac MRI using interleaved gradient-echo EPI. Magn Reson Med. 1998;39:514–9. doi: 10.1002/mrm.1910390403. [DOI] [PubMed] [Google Scholar]
- 8.Judd RM, Reeder SB, Atalar E, McVeigh ER, Zerhouni EA. A magnetization-driven gradient echo pulse sequence for the study of myocardial perfusion. Magn Reson Med. 1995;34:276–82. doi: 10.1002/mrm.1910340220. [DOI] [PMC free article] [PubMed] [Google Scholar]
- 9.Kellman P, Epstein FH, McVeigh ER. Adaptive sensitivity encoding incorporating temporal filtering (TSENSE) Magn Reson Med. 2001;45:846–52. doi: 10.1002/mrm.1113. [DOI] [PubMed] [Google Scholar]
- 10.Griswold MA, Jakob PM, Heidemann RM, Nittka M, Jellus V, Wang J, et al. Generalized autocalibrating partially parallel acquisitions (GRAPPA) Magn Reson Med. 2002;47:1202–10. doi: 10.1002/mrm.10171. [DOI] [PubMed] [Google Scholar]
- 11.Lyne JC, Gatehouse PD, Assomull RG, Smith GC, Kellman P, Firmin DN, et al. Direct comparison of myocardial perfusion cardiovascular magnetic resonance sequences with parallel acquisition. J Magn Reson Imaging. 2007;26:1444–51. doi: 10.1002/jmri.21167. [DOI] [PubMed] [Google Scholar]
- 12.Elkington AG, Gatehouse PD, Cannell TM, Moon JC, Prasad SK, Firmin DN, et al. Comparison of hybrid echo-planar imaging and FLASH myocardial perfusion cardiovascular MR imaging. Radiology. 2005;235:237–43. doi: 10.1148/radiol.2351040360. [DOI] [PubMed] [Google Scholar]
- 13.Storey P, Chen Q, Li W, Edelman RR, Prasad PV. Band artifacts due to bulk motion. Magn Reson Med. 2002;48:1028–36. doi: 10.1002/mrm.10314. [DOI] [PubMed] [Google Scholar]
- 14.Di Bella EVR, Parker DL, Sinusas AJ. On the dark rim artifact in dynamic contrast-enhanced MRI myocardial perfusion studies. Magn Reson Med. 2005;54:1295–9. doi: 10.1002/mrm.20666. [DOI] [PMC free article] [PubMed] [Google Scholar]
- 15.Nagel E, Klein C, Paetsch I, Hettwer S, Schnackenburg B, Wegscheider K, et al. Magnetic resonance perfusion measurements for the noninvasive detection of coronary artery disease. Circulation. 2003;108:432–7. doi: 10.1161/01.CIR.0000080915.35024.A9. [DOI] [PubMed] [Google Scholar]
- 16.Schwitter J, Nanz D, Kneifel S, Bertschinger K, Büchi M, Knüsel PR, et al. Assessment of myocardial perfusion in coronary artery disease by magnetic resonance: A comparison with positron emission tomography and coronary angiography. Circulation. 2001;103:2230–5. doi: 10.1161/01.cir.103.18.2230. [DOI] [PubMed] [Google Scholar]
- 17.Ibrahim T, Nekolla SG, Schreiber K, Odaka K, Volz S, Mehilli J, et al. Assessment of coronary flow reserve: Comparison between contrast-enhanced magnetic resonance imaging and positron emission tomography. J Am Coll Cardiol. 2002;39:864–70. doi: 10.1016/s0735-1097(01)01829-0. [DOI] [PubMed] [Google Scholar]
- 18.Rieber J, Huber A, Erhard I, Mueller S, Schweyer M, Koenig A, et al. Cardiac magnetic resonance perfusion imaging for the functional assessment of coronary artery disease: A comparison with coronary angiography and fractional flow reserve. Eur Heart J. 2006;27:1465–71. doi: 10.1093/eurheartj/ehl039. [DOI] [PubMed] [Google Scholar]
- 19.Christian TF, Rettmann DW, Aletras AH, Liao SL, Taylor JL, Balaban RS, et al. Absolute myocardial perfusion in canines measured by using dual-bolus first-pass MR imaging. Radiology. 2004;232:677–84. doi: 10.1148/radiol.2323030573. [DOI] [PubMed] [Google Scholar]
- 20.Jerosch-Herold M, Wilke N, Stillman AE. Magnetic resonance quantification of the myocardial perfusion reserve with a Fermi function model for constrained deconvolution. Med Phys. 1998;25:73–84. doi: 10.1118/1.598163. [DOI] [PubMed] [Google Scholar]
- 21.Axel L. Tissue mean transit time from dynamic computed tomography by a simple deconvolution technique. Invest Radiol. 1983;18:94–9. doi: 10.1097/00004424-198301000-00018. [DOI] [PubMed] [Google Scholar]
- 22.Gatehouse PD, Elkington AG, Ablitt NA, Yang GZ, Pennell DJ, Firmin DN. Accurate assessment of the arterial input function during high-dose myocardial perfusion cardiovascular magnetic resonance. J Magn Reson Imaging. 2004;20:39–45. doi: 10.1002/jmri.20054. [DOI] [PubMed] [Google Scholar]
- 23.Reffelmann T, Kloner RA. The “no-reflow” phenomenon: Basic science and clinical correlates. Heart. 2002;87:162–8. doi: 10.1136/heart.87.2.162. [DOI] [PMC free article] [PubMed] [Google Scholar]
- 24.Lima JA, Judd RM, Bazille A, Schulman SP, Atalar E, Zerhouni EA. Regional heterogeneity of human myocardial infarcts demonstrated by contrast-enhanced MRI. Potential mechanisms Circulation. 1995;92:1117–25. doi: 10.1161/01.cir.92.5.1117. [DOI] [PubMed] [Google Scholar]
- 25.Judd RM, Lugo-Olivieri CH, Arai M, Kondo T, Croisille P, Lima JA, et al. Physiological basis of myocardial contrast enhancement in fast magnetic resonance images of 2-day-old reperfused canine infarcts. Circulation. 1995;92:1902–10. doi: 10.1161/01.cir.92.7.1902. [DOI] [PubMed] [Google Scholar]
- 26.Rochitte CE, Lima JA, Bluemke DA, Reeder SB, McVeigh ER, Furuta T, et al. Magnitude and time course of microvascular obstruction and tissue injury after acute myocardial infarction. Circulation. 1998;98:1006–14. doi: 10.1161/01.cir.98.10.1006. [DOI] [PubMed] [Google Scholar]
- 27.Wu KC, Kim RJ, Bluemke DA, Rochitte CE, Zerhouni EA, Becker LC, et al. Quantification and time course of microvascular obstruction by contrast-enhanced echocardiography and magnetic resonance imaging following acute myocardial infarction and reperfusion. J Am Coll Cardiol. 1998;32:1756–64. doi: 10.1016/s0735-1097(98)00429-x. [DOI] [PubMed] [Google Scholar]
- 28.Rogers WJ, Jr, Kramer CM, Geskin G, Hu YL, Theobald TM, Vido DA, et al. Early contrast-enhanced MRI predicts late functional recovery after reperfused myocardial infarction. Circulation. 1999;99:744–50. doi: 10.1161/01.cir.99.6.744. [DOI] [PubMed] [Google Scholar]
- 29.Hombach V, Grebe O, Merkle N, Waldenmaier S, Höher M, Kochs M, et al. Sequelae of acute myocardial infarction regarding cardiac structure and function and their prognostic significance as assessed by magnetic resonance imaging. Eur Heart J. 2005;26:549–57. doi: 10.1093/eurheartj/ehi147. [DOI] [PubMed] [Google Scholar]
- 30.Wu KC, Zerhouni EA, Judd RM, Lugo-Olivieri CH, Barouch LA, Schulman SP, et al. Prognostic significance of microvascular obstruction by magnetic resonance imaging in patients with acute myocardial infarction. Circulation. 1998;97:765–72. doi: 10.1161/01.cir.97.8.765. [DOI] [PubMed] [Google Scholar]
- 31.Wei K, Kaul S. The coronary microcirculation in health and disease. Cardiol Clin. 2004;22:221–31. doi: 10.1016/j.ccl.2004.02.005. [DOI] [PubMed] [Google Scholar]
- 32.Kwong RY, Schussheim AE, Rekhraj S, Aletras AH, Geller N, Davis J, et al. Detecting acute coronary syndrome in the emergency department with cardiac magnetic resonance imaging. Circulation. 2003;107:531–7. doi: 10.1161/01.cir.0000047527.11221.29. [DOI] [PubMed] [Google Scholar]
- 33.Ingkanisorn WP, Kwong RY, Bohme NS, Geller NL, Rhoads KL, Dyke CK, et al. Prognosis of negative adenosine stress magnetic resonance in patients presenting to an emergency department with chest pain. J Am Coll Cardiol. 2006;47:1427–32. doi: 10.1016/j.jacc.2005.11.059. [DOI] [PubMed] [Google Scholar]
- 34.Selvanayagam JB, Jerosch-Herold M, Porto I, Sheridan D, Cheng AS, Petersen SE, et al. Resting myocardial blood flow is impaired in hibernating myocardium—a magnetic resonance study of quantitative perfusion assessment. Circulation. 2005;112:3289–96. doi: 10.1161/CIRCULATIONAHA.105.549170. [DOI] [PubMed] [Google Scholar]
- 35.Jerosch-Herold M, Hu XD, Murthy NS, Seethamraju RT. Time delay for arrival of MR contrast agent in collateral-dependent myocardium. IEEE Trans Med Imaging. 2004;23:881–90. doi: 10.1109/TMI.2004.827969. [DOI] [PubMed] [Google Scholar]
- 36.Chilian WM, Layne SM, Klausner EC, Eastham CL, Marcus ML. Redistribution of coronary microvascular resistance produced by dipyridamole. Am J Physiol Heart Circ Physiol. 1989;256:H383–90. doi: 10.1152/ajpheart.1989.256.2.H383. [DOI] [PubMed] [Google Scholar]
- 37.Klocke FJ, Simonetti OP, Judd RM, Kim RJ, Harris KR, Hedjbeli S, et al. Limits of detection of regional differences in vasodilated flow in viable myocardium by first-pass magnetic resonance perfusion imaging. Circulation. 2001;104:2412–6. doi: 10.1161/hc4501.099306. [DOI] [PubMed] [Google Scholar]
- 38.Nandalur KR, Dwamena BA, Choudhri AF, Nandalur MR, Carlos RC. Diagnostic performance of stress cardiac magnetic resonance imaging in the detection of coronary artery disease: A meta-analysis. J Am Coll Cardiol. 2007;50:1343–53. doi: 10.1016/j.jacc.2007.06.030. [DOI] [PubMed] [Google Scholar]
- 39.Schwitter J, Wacker CM, van Rossum AC, Lombardi M, Al-Saadi N, Ahlstrom H, et al. MR-IMPACT: Comparison of perfusioncardiac magnetic resonance with single-photon emission computed tomography for the detection of coronary artery disease in a multicentre, multivendor, randomized trial. Eur Heart J. 2008;29:480–9. doi: 10.1093/eurheartj/ehm617. [DOI] [PubMed] [Google Scholar]
- 40.Klem I, Heitner JF, Shah DJ, Sketch MH, Jr, Behar V, Weinsaft J, et al. Improved detection of coronary artery disease by stress perfusion cardiovascular magnetic resonance with the use of delayed enhancement infarction imaging. J Am Coll Cardiol. 2006;47:1630–8. doi: 10.1016/j.jacc.2005.10.074. [DOI] [PubMed] [Google Scholar]
- 41.Jahnke C, Nagel E, Gebker R, Kokocinski T, Kelle S, Manka R, et al. Prognostic value of cardiac magnetic resonance stress tests: Adenosine stress perfusion and dobutamine stress wall motion imaging. Circulation. 2007;115:1769–76. doi: 10.1161/CIRCULATIONAHA.106.652016. [DOI] [PubMed] [Google Scholar]
- 42.Cullen JHS, Horsfield MA, Reek CR, Cherryman GR, Barnett DB, Samani NJ. A myocardial perfusion reserve index in humans using first-pass contrast-enhanced magnetic resonance imaging. J Am Coll Cardiol. 1999;33:1386–94. doi: 10.1016/s0735-1097(99)00004-2. [DOI] [PubMed] [Google Scholar]
- 43.Futamatsu H, Wilke N, Klassen C, Shoemaker S, Angiolillo DJ, Siuciak A, et al. Evaluation of cardiac magnetic resonance imaging parameters to detect anatomically and hemodynamically significant coronary artery disease. Am Heart J. 2007;154:298–305. doi: 10.1016/j.ahj.2007.04.024. [DOI] [PubMed] [Google Scholar]
- 44.Costa MA, Shoemaker S, Futamatsu H, Klassen C, Angiolillo DJ, Nguyen M, et al. Quantitative magnetic resonance perfusion imaging detects anatomic and physiologic coronary artery disease as measured by coronary angiography and fractional flow reserve. J Am Coll Cardiol. 2007;50:514–22. doi: 10.1016/j.jacc.2007.04.053. [DOI] [PubMed] [Google Scholar]
- 45.Patel AR, Antkowiak P, Nandalur KR, et al. Differentiating moderate from severe coronary artery stenosis using quantitative myocardial perfusion imaging. J Cardiovasc Magn Reson. 2008;11:239. abstract. [Google Scholar]
- 46.Selvanayagam JB, Cheng AS, Jerosch-Herold M, Rahimi K, Porto I, van Gaal W, et al. Effect of distal embolization on myocardial perfusion reserve after percutaneous coronary intervention: A quantitative magnetic resonance perfusion study. Circulation. 2007;116:1458–64. doi: 10.1161/CIRCULATIONAHA.106.671909. [DOI] [PubMed] [Google Scholar]
- 47.Marcus ML, Chilian WM, Kanatsuka H, Dellsperger KC, Eastham CL, Lamping KG. Understanding the coronary circulation through studies at the microvascular level. Circulation. 1990;82:1–7. doi: 10.1161/01.cir.82.1.1. [DOI] [PubMed] [Google Scholar]
- 48.Chilian WM. Coronary microcirculation in health and disease. Summary of an NHLBI workshop. Circulation. 1997;95:522–8. doi: 10.1161/01.cir.95.2.522. [DOI] [PMC free article] [PubMed] [Google Scholar]
- 49.Wang L, Jerosch-Herold M, Jacobs DR, Jr, Shahar E, Detrano R, Folsom AR, et al. Coronary artery calcification and myocardial perfusion in asymptomatic adults: The MESA (Multi-Ethnic Study of Atherosclerosis) J Am Coll Cardiol. 2006;48:1018–26. doi: 10.1016/j.jacc.2006.04.089. [DOI] [PMC free article] [PubMed] [Google Scholar]
- 50.Wang L, Jerosch-Herold M, Jacobs DR, Jr, Shahar E, Folsom AR. Coronary risk factors and myocardial perfusion in asymptomatic adults: The Multi-Ethnic Study of Atherosclerosis (MESA) J Am Coll Cardiol. 2006;47:565–72. doi: 10.1016/j.jacc.2005.09.036. [DOI] [PubMed] [Google Scholar]
- 51.Taskiran M, Fritz-Hansen T, Rasmussen V, Larsson HB, Hilsted J. Decreased myocardial perfusion reserve in diabetic autonomic neuropathy. Diabetes. 2002;51:3306–10. doi: 10.2337/diabetes.51.11.3306. [DOI] [PubMed] [Google Scholar]
- 52.Wang L, Wong TY, Sharrett AR, Klein R, Folsom AR, Jerosch-Herold M. Relationship between retinal arteriolar narrowing and myocardial perfusion: Multi-ethnic study of atherosclerosis. Hypertension. 2008;51:119–26. doi: 10.1161/HYPERTENSIONAHA.107.098343. [DOI] [PubMed] [Google Scholar]
- 53.Rosen BD, Lima JA, Nasir K, Edvardsen T, Folsom AR, Lai S, et al. Lower myocardial perfusion reserve is associated with decreased regional left ventricular function in asymptomatic participants of the multi-ethnic study of atherosclerosis. Circulation. 2006;114:289–97. doi: 10.1161/CIRCULATIONAHA.105.588525. [DOI] [PubMed] [Google Scholar]
- 54.Epstein FH, London JF, Peters DC, Goncalves LM, Agyeman K, Taylor J, et al. Multislice first-pass cardiac perfusion MRI: Validation in a model of myocardial infarction. Magn Reson Med. 2002;47:482–91. doi: 10.1002/mrm.10085. [DOI] [PubMed] [Google Scholar]
- 55.Bache RJ, McHale PA, Greenfield JC., Jr Transmural myocardial perfusion during restricted coronary inflow in the awake dog. Am J Physiol. 1977;232:H645–51. doi: 10.1152/ajpheart.1977.232.6.H645. [DOI] [PubMed] [Google Scholar]
- 56.Klocke FJ. Coronary blood flow in man. Prog Cardiovasc Dis. 1976;19:117–66. doi: 10.1016/0033-0620(76)90020-7. [DOI] [PubMed] [Google Scholar]
- 57.Yada T, Hiramatsu O, Kimura A, Goto M, Ogasawara Y, Tsujioka K, et al. In vivo observation of subendocardial microvessels of the beating porcine heart using a needle-probe videomicroscope with a CCD camera. Circ Res. 1993;72:939–46. doi: 10.1161/01.res.72.5.939. [DOI] [PubMed] [Google Scholar]
- 58.Lee DC, Simonetti OP, Harris KR, Holly TA, Judd RM, Wu E, et al. Magnetic resonance versus radionuclide pharmacological stress perfusion imaging for flow-limiting stenoses of varying severity. Circulation. 2004;110:58–65. doi: 10.1161/01.CIR.0000133389.48487.B6. [DOI] [PubMed] [Google Scholar]
- 59.Muehling OM, Jerosch-Herold M, Panse P, Zenovich A, Wilson BV, Wilson RF, et al. Regional heterogeneity of myocardial perfusion in healthy human myocardium: Assessment with magnetic resonance perfusion imaging. J Cardiovasc Magn Reson. 2004;6:499–507. doi: 10.1081/jcmr-120030570. [DOI] [PubMed] [Google Scholar]
- 60.Petersen SE, Jerosch-Herold M, Hudsmith LE, Robson MD, Francis JM, Doll HA, et al. Evidence for microvascular dysfunction in hypertrophic cardiomyopathy. New insights from multiparametric magnetic resonance imaging. Circulation. 2007;115:2418–25. doi: 10.1161/CIRCULATIONAHA.106.657023. [DOI] [PubMed] [Google Scholar]
- 61.Muehling OM, Wilke NM, Panse P, Jerosch-Herold M, Wilson BV, Wilson RF, et al. Reduced myocardial perfusion reserve and transmural perfusion gradient in heart transplant arteriopathy assessed by magnetic resonance imaging. J Am Coll Cardiol. 2003;42:1054–60. doi: 10.1016/s0735-1097(03)00924-0. [DOI] [PubMed] [Google Scholar]
- 62.Panting JR, Gatehouse PD, Yang GZ, Grothues F, Firmin DN, Collins P, et al. Abnormal subendocardial perfusion in cardiac syndrome X detected by cardiovascular magnetic resonance imaging. N Engl J Med. 2002;346:1948–53. doi: 10.1056/NEJMoa012369. [DOI] [PubMed] [Google Scholar]
- 63.Wöhrle J, Nusser T, Merkle N, Kestler HA, Grebe OC, Marx N, et al. Myocardial perfusion reserve in cardiovascular magnetic resonance: Correlation to coronary microvascular dysfunction. J Cardiovasc Magn Reson. 2006;8:781–7. doi: 10.1080/10976640600737649. [DOI] [PubMed] [Google Scholar]
- 64.Williams DS, Detre JA, Leigh JS, Koretsky AP. Magnetic resonance imaging of perfusion using spin inversion of arterial water. Proc Natl Acad Sci U S A. 1992;89:212–6. doi: 10.1073/pnas.89.1.212. [DOI] [PMC free article] [PubMed] [Google Scholar]
- 65.Reeder SB, Atalay MK, McVeigh ER, Zerhouni EA, Forder JR. Quantitative cardiac perfusion: A noninvasive spin-labeling method that exploits coronary vessel geometry. Radiology. 1996;200:177–84. doi: 10.1148/radiology.200.1.8657907. [DOI] [PMC free article] [PubMed] [Google Scholar]
- 66.Wacker CM, Fidler F, Dueren C, Hirn S, Jakob PM, Ertl G, et al. Quantitative assessment of myocardial perfusion with a spinlabeling technique: Preliminary results in patients with coronary artery disease. J Magn Reson Imaging. 2003;18:555–60. doi: 10.1002/jmri.10386. [DOI] [PubMed] [Google Scholar]
- 67.Ogawa S, Lee TM, Kay AR, Tank DW. Brain magnetic resonance imaging with contrast dependent on blood oxygenation. Proc Natl Acad Sci U S A. 1990;87:9868–72. doi: 10.1073/pnas.87.24.9868. [DOI] [PMC free article] [PubMed] [Google Scholar]
- 68.Li D, Dhawale P, Rubin PJ, Haacke EM, Gropler RJ. Myocardial signal response to dipyridamole and dobutamine: Demonstration of the BOLD effect using a double-echo gradient-echo sequence. Magn Reson Med. 1996;36:16–20. doi: 10.1002/mrm.1910360105. [DOI] [PubMed] [Google Scholar]
- 69.Lindner JR, Skyba DM, Goodman NC, Jayaweera AR, Kaul S. Changes in myocardial blood volume with graded coronary stenosis. Am J Physiol. 1997;272:H567–75. doi: 10.1152/ajpheart.1997.272.1.H567. [DOI] [PubMed] [Google Scholar]
- 70.Wacker CM, Hartlep AW, Pfleger S, Schad LR, Ertl G, Bauer WR. Susceptibility-sensitive magnetic resonance imaging detects human myocardium supplied by a stenotic coronary artery without a contrast agent. J Am Coll Cardiol. 2003;41:834–40. doi: 10.1016/s0735-1097(02)02931-5. [DOI] [PubMed] [Google Scholar]
- 71.Friedrich MG, Niendorf T, Schulz-Menger J, Gross CM, Dietz R. Blood oxygen level-dependent magnetic resonance imaging in patients with stress-induced angina. Circulation. 2003;108:2219–23. doi: 10.1161/01.CIR.0000095271.08248.EA. [DOI] [PubMed] [Google Scholar]
- 72.Fieno DS, Shea SM, Li Y, Harris KR, Finn JP, Li D. Myocardial perfusion imaging based on the blood oxygen level-dependent effect using T2-prepared steady-state free-precession magnetic resonance imaging. Circulation. 2004;110:1284–90. doi: 10.1161/01.CIR.0000140673.13057.34. [DOI] [PubMed] [Google Scholar]
- 73.Reeder SB, Holmes AA, McVeigh ER, Forder JR. Simultaneous noninvasive determination of regional myocardial perfusion and oxygen content in rabbits: Toward direct measurement of myocardial oxygen consumption at MR imaging. Radiology. 1999;212:739–47. doi: 10.1148/radiology.212.3.r99se27739. [DOI] [PMC free article] [PubMed] [Google Scholar]
- 74.McCommis KS, Zhang H, Herrero P, Gropler RJ, Zheng J. Feasibility study of myocardial perfusion and oxygenation by noncontrast MRI: Comparison with PET study in a canine model. Magn Reson Imaging. 2008;26:11–9. doi: 10.1016/j.mri.2007.04.009. [DOI] [PMC free article] [PubMed] [Google Scholar]