Abstract
The hypothalamus regulates numerous [W2]autonomic responses and behaviors. The neuroactive substances corticotropin-releasing factor (CRF), arginine-vasopressin (AVP), histidine decarboxylase (HDC), melanin-concentrating hormone (MCH), and orexin/hypocretins (ORX) produced in the hypothalamus mediate a subset of these processes. Although the expression patterns of these genes have been well studied in rodents, less is known about them in humans. We combined classical histological techniques with in situ hybridization histochemistry to produce both 2 and 3-dimensional images and to visually align and quantify expression of the genes for these substances in nuclei of the human hypothalamus. The hypothalamus was arbitrarily divided into rostral, intermediate and caudal regions. The rostral region, containing the paraventricular nucleus (PVN), was defined by discrete localization of CRF and AVP expressing neurons, whereas distinct relationships between HDC, MCH, and ORX mRNA expressing neurons delineated specific levels within the intermediate and caudal regions. Quantitative mRNA signal intensity measurements revealed no significant differences in overall CRF or AVP expression at any rostro-caudal level of the PVN. HDC mRNA expression was highest at the level of the premammillary areawhich included the dorsomedial and tuberomammillary nuclei as well as the dorsolateral hypothalamic area. In addition, the overall intensity of hybridization signal exhibited by both MCH and ORX mRNA expressing neurons peaked in distinct intermediate and caudal hypothalamic regions. These results suggest that human hypothalamic neurons involved in the regulation of the HPA axis display distinct neurochemical patterns that may encompass multiple local nuclei.
INDEXING TERMS: stress, depression, avp, crf, histamine, orexin
INTRODUCTION
The hypothalamus mediates a diverse array of functions and behaviors related to the endocrine system, circadian rhythms, and homeostatic drives. Studies of the functional and anatomical relationships between hypothalamic nuclei, which collectively produce no fewer than 20 different neuropeptides to regulate such processes (Palkovits, 1984), have relied heavily on the use of rodents. Evidence from rodents as well as human postmortem data indicates that several of these hypothalamic signaling molecules regulate behaviors connected to stress, feeding, and sleep (discussed below). Quantitative studies examining possible links between disease and locally synthesized neuroactive substances are currently compromised by the lack of readily available comprehensive neurochemical maps of the human hypothalamus. In an effort to overcome this problem, we generated an expression map of a number of clinically relevant signaling molecules in the human hypothalamus. Two of these include the anterior hypothalamic hormones corticotropin-releasing factor (CRF; also termed corticotropin-releasing hormone, CRH) and arginine-vasopressin (AVP). In both rats and humans, each of these peptides is synthesized by different neurosecretory neurons within the paraventricular nucleus (PVN) and those that generate AVP are found within within the supraoptic nucleus (SON) (Dierickx and Vandesande, 1977; Pelletier et al., 1983; Sawchenko et al., 1984b; Koutcherov et al., 2000). Rodent studies suggest that stimulated release of both neuropeptides enhances the secretion of the pituitary secretagogue adrenocorticotropic hormone (ACTH) (Gillies et al., 1982; Rivier and Vale, 1983), which in turn stimulates the hypothalamo-pituitary-adrenal (HPA) axis that is critical for stress responses in both rodents and humans (Arborelius et al., 1999; Swaab et al., 2005; Bao et al., 2008; Lightman, 2008).
More caudally located hypothalamic nuclei produce other neuroactive substances to regulate HPA function and additional physiological processes. Amongst these are the histamine synthesizing neurons localized in the tuberomammillary region (TM) in rodents and humans (Castren and Panula, 1990; Panula at al., 1990). In rodents, histamine augments ACTH release (Kjaer et al., 1994), and promotes food intake (Masaki et al., 2001) and arousal (Huang et al., 2001). Neurons that produce melanin-concentrating hormone (MCH) and orexin/hypocretin (ORX) are part of separate, but overlapping subpopulations particularly concentrated within the lateral hypothalamic area (LHA) and dorsal hypothalamic area (DHA) in both rats and humans (Qu et al., 1996; Broberger et al., 1998, Elias et al., 1998). Rodent studies show each of these molecules increases ACTH release (Kuru et al., 2000, Al-Barazanji et al., 2001, Kennedy et al., 2003) and feeding behavior (Qu et al., 1996; Sakurai et al., 1998). As determined by expression of the immediate-early gene c-fos, MCH and ORX expressing neurons tend to be more active during sleep (Verret et al., 2003) and wake states (Estabrooke et al., 2001), respectively.
Examining the regulation of hypothalamic signaling molecules is of particular interest given their relationship to human neuropsychiatric and neurodegenerative disorders. For instance, the brains of subjects who had been diagnosed with depression display both an increased number of immunoreactive CRF and AVP neurons and increases in levels of the corresponding mRNAs (Raadsheer at al., 1994a; Purba et al., 1996; Meynen 2006). Similarly, brains from Alzheimer’s disease patients show elevated levels of CRF mRNA (Raadsheer et al., 1994a; Raadsheer et al., 1995) along with degeneration of histaminergic neurons (Airaksinen et al., 1991). In addition, a reduction in the number of ORX-positive neurons is associated with narcolepsy (Peyron et al., 2000; Thannikal et al., 2000) and Huntington’s disease (Aziz et al., 2008) while decreased numbers of both ORX and MCH neurons are observed in Parkinson’s disease (Thannikal et al., 2007). Taken together, these studies highlight the clinical importance of understanding the pattern and regulation of gene expression in the human hypothalamus.
In the present study, we aimed to expand on previously published data by combining in situ hybridization histochemistry (ISH) and classical histological staining to delineate the anatomical patterns of gene expression for CRF, AVP, the histamine synthesizing enzyme histidine decarboxylase (HDC), MCH, and ORX in the hypothalamus of healthy human subjects. To achieve this, we first determined the precise nuclear localization of mRNAs by comparing the distribution of cells showing saturated ISH signals in autoradiograms with adjacent 50µm thick Nissl-stained sections. Next, computer-based techniques were used to generate both 2-dimensional (2D) and 3D reconstructions from 10µm thick sections illustrating the spatial relationships between the neurons expressing the peptide mRNAs. Using the thinner sections, quantitative analyses were performed for each transcript within identical regions of specimens from different brains in order to determine the extent of neurochemical heterogeneity within the human hypothalamus.
MATERIALS AND METHODS
Sample Collection
Tissue was obtained from 53 brains in the University of California, Irvine and Davis, Brain Repository. The University of California, Irvine Dept. of Psychiatry and Human Behavior Psychological Autopsy Protocol, which is based on procedures validated by Kelly and Mann (1996), was used to assess each subject. Next-of-kin are asked questions concerning decedents’ demographics, medical history, medication use, hospitalizations, and manner of death. Family members are also asked questions adapted from the Structured Clinical Interview for the Diagnostic and Statistical Manual for Mental Disorder - Fourth Edition (First et al., 1995) in order to extract information concerning decedents’ psychiatric symptoms and substance use. All subjects selected for the current investigation were free of any psychiatric disturbances at the time of death with no known psychiatric disturbances over the life span, no known prior treatment with psychotropic medications, and no history of mental illness among first-order or second order relatives. All subjects exhibited no clinical evidence of neurodegenerative disorders, such as Parkinson’s, Huntington’s, dementia, or impairment as a result of cerebrovascular accident (CVA). All subjects had zero agonal factors and brain pH was above 6.5 which assures maximum mRNA preservation (Li et al., 2004; Tomita et al., 2004; for detailed subject data see Table 1). Full details of the psychological autopsy, medical history acquisition, matters pertaining to agonal state and other aspects related to tissue quality and expression profiling are described in Li et al 2004; 2007, Vawter et al 2004; Atz et al 2007 and in other publications from our group. After removal, brains were cooled to 4°C; cut into coronal slices ~0.8cm thick, flash-frozen between two liquid nitrogen-cooled aluminum plates, and stored at – 85°C as previously described (Jones et al. 1992).
Table 1.
Subject demographics and post mortem data.
| Subject ID | Gender | Age | Cause of Death | AFS | pH | PMI | Race |
|---|---|---|---|---|---|---|---|
| 1 | Male | 49 | Cardiac Event | 0 | 6.68 | 27.5 | C |
| 2 | Male | 40 | Chronic glomerulonephritis | 0 | 6.76 | 12.3 | C |
| 3 | Male | 39 | Electrocution | 0 | 7.02 | 30 | C |
| 4 | Male | 56 | Cardiac Event | 0 | 6.98 | 24.5 | C |
| 5 | Male | 66 | Cardiac Event | 0 | 6.94 | 18 | C |
| 6 | Male | 30 | Cardiac Event | 0 | 7.15 | 18.2 | C |
| 7 | Male | 48 | Cardiac Event | 0 | 6.79 | 20.2 | C |
| 8 | Male | 65 | Hemorrhagic Epicarditis | 0 | 6.88 | 13.5 | AA |
| 9 | Male | 55 | Cardiac Event | 0 | 6.89 | 15 | C |
| 10 | Male | 41 | Cardiac Event | 0 | 7.01 | 22.5 | C |
| 11 | Male | 52 | Cardiac Event | 0 | 6.53 | 18.8 | C |
| 12 | Male | 58 | Cardiac Event | 0 | 6.58 | 21 | C |
| 13 | Male | 29 | Cardiac Event | 0 | 6.81 | 18.2 | PI |
| 14 | Male | 64 | Cardiac Event | 0 | 7.13 | 10.5 | C |
| 15 | Female | 45 | Trauma | 0 | 7.05 | 16 | C |
| 16 | Female | 74 | Respiratory Failure | 0 | 7.21 | 18.5 | C |
| 17 | Female | 73 | Cardiac Event | 0 | 7.21 | 20 | C |
| 18 | Male | 75 | Cardiac Event | 0 | 7.18 | 19 | C |
| 19 | Male | 67 | Cardiac Event | 0 | 6.96 | 15 | C |
| 20 | Male | 51 | Cardiac Event | 0 | N/A | 19 | C |
| 21 | Male | 62 | Cardiac Event | 0 | N/A | 17.8 | C |
The table shows the serial numbers, general demographics, cause of death, pH, agonal factors scores and postmortem interval for the 21 subjects used in the study. Abbreviations: AA, African American; AFS, agonal factors score; C, Caucasian; N/A, not available; PI, Pacific Islander; PMI, postmortem interval.
ISH and Histological Methods Using 50µm Thick Sections
In brains from two subjects, the three or four frozen coronal slices containing the diencephalon were identified and a single block encompassing the hypothalamus and thalamus of both sides was removed from each slice with a mechanical saw. The temperature of the blocks was raised to ~4°C at which point they were fixed in cold 4% paraformaldehyde in 0.1 M phosphate buffer (pH 7.4) overnight, then infiltrated with 30% sucrose in 0.1 M phosphate buffer, refrozen in dry ice, and kept at −85°C until sectioning. The blocks were assembled in rostro-caudal order and serial sections 50µm thick were cut from each on a sliding microtome. They were collected in groups of ten; 8 in 4% paraformaldehyde in 0.1M phosphate buffer in which they remained for 7 days prior to ISH and two in 0.1M phosphate buffer for Nissl staining.
For ISH, sections were washed in 0.1 M glycine in 0.1 M phosphate buffer (pH 7.4) followed by two washes in 0.1 M phosphate buffer (pH 7.4) and 2 washes in 2x saline sodium citrate (SSC; 1xSSC is 0.15 M sodium chloride and 0.015 M sodium citrate, pH 7.0). Sections were then incubated in hybridization solution containing 50% formamide, dextran sulfate 10%, 0.7% Ficoll, 0.7% polyvinyl pyrolidone, 0.5 mg/ml yeast tRNA, 0.33 mg/ml yeast tRNA, 0.33 mg/ml denatured herring sperm DNA, 20 mM dithiothreitol (DTT), and 5.0 × 10⁵ cpm/ml of the 33P-labeled antisense or sense probe. The target, size and accession number of each cRNA probe were as follows: CRF, 586 nucleotides (nt), 216–802 nt of NM 000756; AVP, 145 nt, 473–618 nt of NM 000490; HDC, 850 nt, 1235–2085 nt of NM 002112; MCH, 388 nt, 10–398 of NM 002674; ORX, 327 nt, 3–330 of NM 001524. Hybridization was carried out overnight at 60°C in a humid chamber. After hybridization, sections were washed twice in 4xSSC at 60°C, digested with 20 µg/ml of ribonuclease A (pH 8.0) for 30 min at 45°C, and washed through descending concentrations of SSC to a final stringency of 0.5x SSC. Sections were mounted on gelatin-coated slides, dried, and exposed to Amersham β-max autoradiographic film for 3 or 7 days, after which they were developed in Kodak GBX developer (Eastman Kodak, Rochester, NY, USA). Sections for Nissl staining were mounted on glass slides, dried, stained with thionin, dehydrated, cleared and coverslipped in DPX mountant (VWR International Inc., Poole, U.K.). Higher magnification images of the original Nissl-stained sections can be found in supplementary figures 1A through 11A.
ISH and Histology Methods Using 10µm Thick Sections
Blocks containing the hypothalamus were removed from the frozen slices of the remaining 51 brains. They were sectioned on a cryostat at 10µm, thaw mounted onto Superfrost®/ Plus glass slides (Fisher Scientific, USA), and stored at −80°C until use. For a detailed description of this in situ hybridization protocol, see Kabbaj et al., (2000). Mounted sections at 500µm intervals were immersion-fixed in 4% paraformaldehyde for 1 hr, washed in 2X SCC and incubated for 10 min in 0.1M triethanolamine (TEA). Slides were subsequently rinsed in distilled water, the sections dehydrated in ascending alcohol concentrations; air dried, and hybridized with 35S-labeled cRNA probes at 55°C overnight. The target, size, and accession number of each cRNA probe were identical to those used for processing 50µm sections (see above). Slides were subsequently rinsed in 2X SSC, digested with ribonuclease A (200µg/ml ), washed in descending SSC concentrations, dehydrated, and exposed to Kodak Biomax MR film (Eastman Kodak, Rochester, NY, USA). Exposure times were as follows: CRF, 7 days; AVP, 24 hr; HDC, 6 days; MCH, 6 days; ORX, 5 days.
Sections adjacent to those processed for ISH were stained using a combination of Luxol Fast Blue and Cresyl Violet. Slides were immersed in a solution containing 0.94% Luxol Fast Blue (w/v), 89.6% ethanol (v/v) and 0.5% acetic acid (v/v), and then incubated overnight at 37 °C. The slides were then washed sequentially in 95% ethanol, distilled water, 50% lithium carbonate, 70% ethanol, distilled water, 70% ethanol, and then placed in 1% Eosin Y solution for 1 minute. The slides were then rinsed in distilled water, dipped in 1% Cresyl Violet, rinsed in tap water, dehydrated, cleared in xylene, and coverslipped with Permount®.
Image Capture and Quantification
The autoradiograms of each in situ-labeled 50µm section and the matching Nissl-stained section were imaged at 5,000 d.p.i with a Phase One (Phase One A/S, Fredericksberg, Denmark) 4"×5" digital camera mounted on a Nikon Multiphot photomacrographic apparatus. Captured images were exported to Adobe Photoshop® CS 8.0 (Adobe Systems Inc., San Jose, CA, USA), downsized to 1200 d.p.i., assembled in rostro-caudal order and images of autoradiographs at the same rostro-caudal levels matched to those of the corresponding Nissl-stained sections and matched for brightness and contrast. Nuclei of the hypothalamus and adjacent regions were identified primarily in terms of the atlases of Saper (2004) and Jones (2007) and labeled accordingly. Autoradiograms of sections hybridized with sense probes displayed light background staining only.
ISH films developed from 10µm thick sections and adjacent Fast Blue/Cresyl Violet slides were digitized at 1600 pixels/inch using a flat bed scanner (Microtek ScanMaker 1000XL, Microtek Inc, Carson, California) and Nikon LS 4000 (Nikon Inc., Tokyo, Japan) slide scanner, respectively. Specific hypothalamic nuclei and areas within nuclei were outlined using the freehand tool in Image J software (NIH, Bethesda, MD, USA). Specific nuclei were identified by the combined analyses of ISH and Nissl staining on the 50µm sections from the two brains prepared in this way. The optical density of hybridization signal within the outlined nuclei was defined as follows: Signal intensity of CRF, AVP, HDC, MCH, and ORX gene expression was quantified in a linear grayscale range and values generated utilizing Image J were expressed as optical density units. [W3]It should be noted that these values are dependent on density of labeled cells within an analyzed region, and are, therefore, not comparable across probes. For each cRNA probe, only optical density measurements of at least 3.5x the standard deviation (3.5x STD) above the mean of non-specific signals in each section were collected. Resulting data was analyzed using GraphPad Software® (GraphPad Software Inc., La Jolla, CA, USA) to perform One-way ANOVAs and subsequent Tukey-post test when appropriate. Effects were considered significant at P< 0.05.
Anatomical Alignment of Hybridization Signals in 10µm Thick Sections
Because of discrepancies resulting from incompleteness of the blocks and irregularities in the angle of sectioning, not all blocks from the 51 brains could be used for mapping the full extent of the relevant hypothalamic nuclei. Blocks from 19 of the brains sectioned at 10µm showed no loss of tissue from the hypothalamus and the sections were oriented in planes that facilitated reconstruction. These were used for 2D and 3D reconstructions. Using Adobe Photoshop® CS 8.0 (Adobe Systems Inc., San Jose, CA, USA), Luxol Fast Blue images were converted to grayscale while in situ hybridization images were first inverted in grayscale and then converted to RGB for artificial color coding of each probe (CRF-red, AVP-green, HDC-purple, MCH-cyan, ORX-yellow). Using the Adobe Photoshop® CS 8.0 layer menu, 2D representations were constructed. In these, captured images of Luxol Fast Blue + Cresyl Violet stained sections formed the background at reduced opacity to an overlaid image of an adjacent section labeled by in situ hybridization. Merged 2D images were then compared with those from descriptions of the human hypothalamus (Braak and Braak, 1987, 1992; Airaksinen et al., 1991; Elias et al., 1998; Trottier et al., 2002; Saper, 2004) to generate a neurochemical atlas of each hypothalamus.
For constructing 3D representations of gene transcription patterns, grayscale ISH TIFF files for each transcript were overlaid and digitally cleaned to eliminate artifacts using Adobe® Photoshop® CS 8.0. The resulting files were then exported to Volocity® 5.1 (Perkin Elmer Inc, Waltham MA, USA) where the following data was entered: distance between images on the Z plane (500 µm), number of color channels desired (one per transcript) and number of Z slices per volume, which was set as an automated function. The program then converted the two dimensional pixels into three dimensional voxels that rendered a representation of the spatial distribution of the gene expression pattern.
RESULTS
CRF and AVP mRNA Distribution
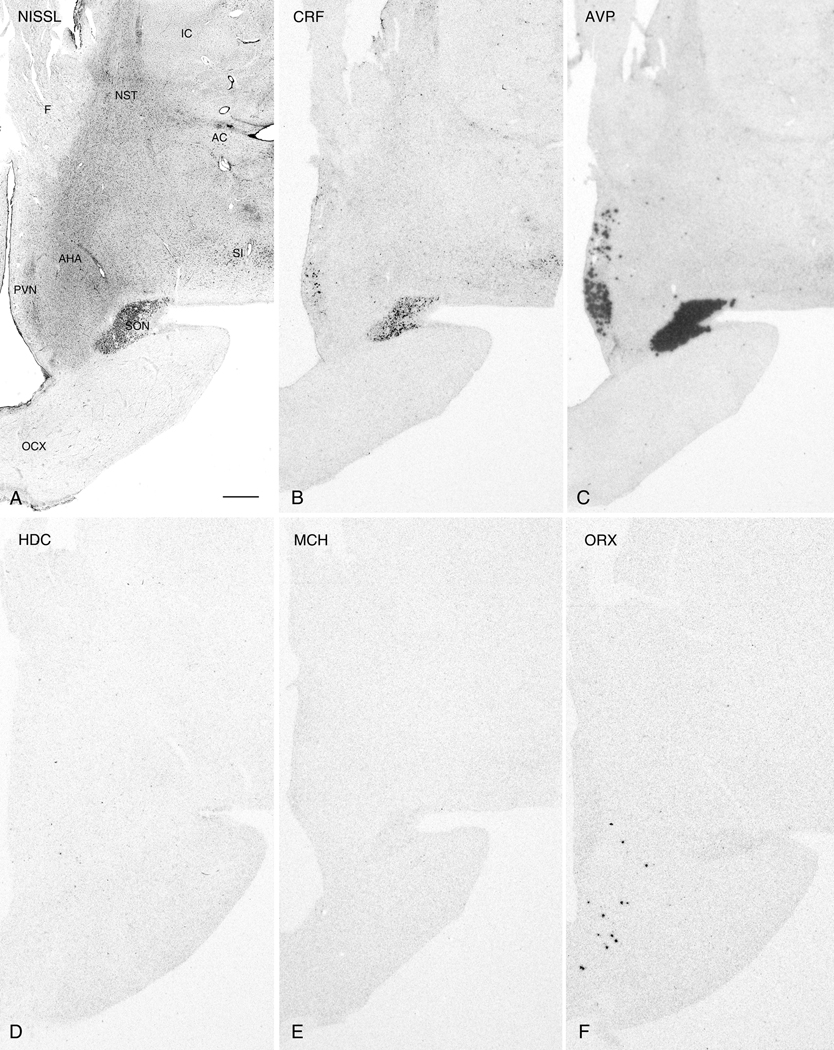
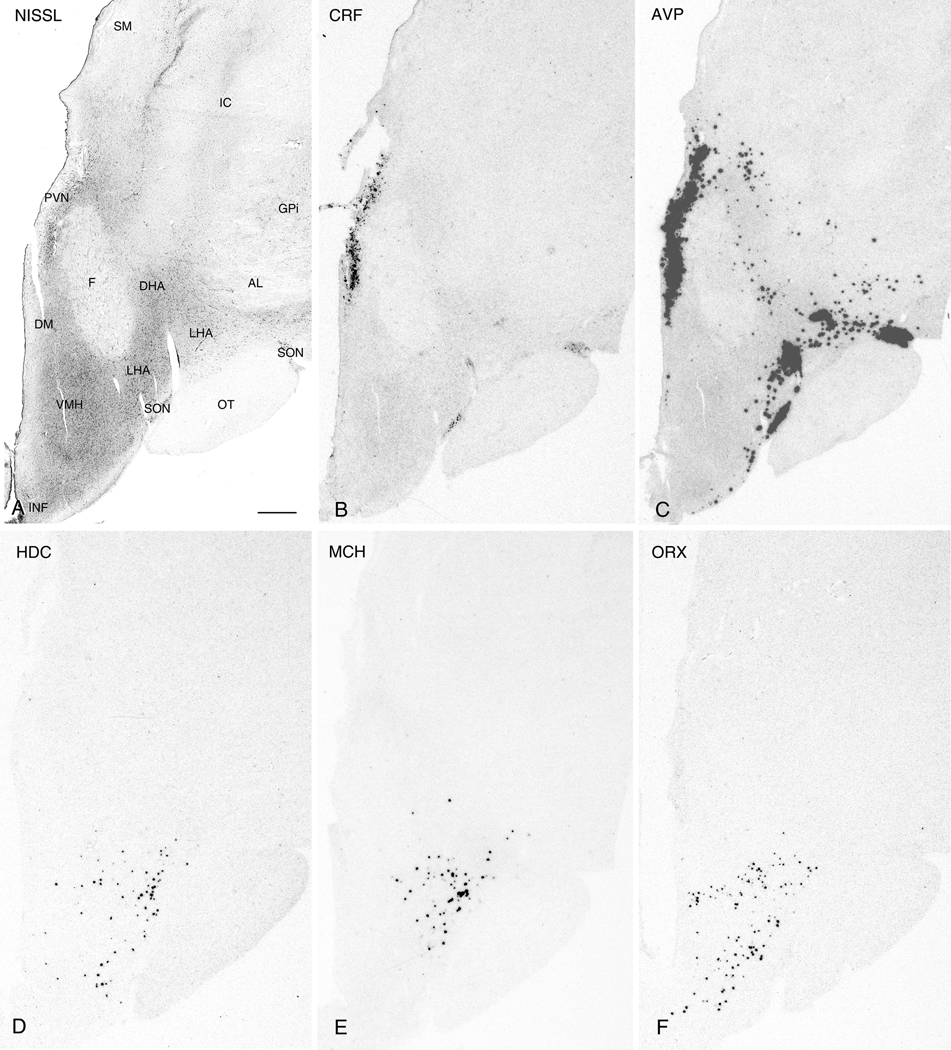
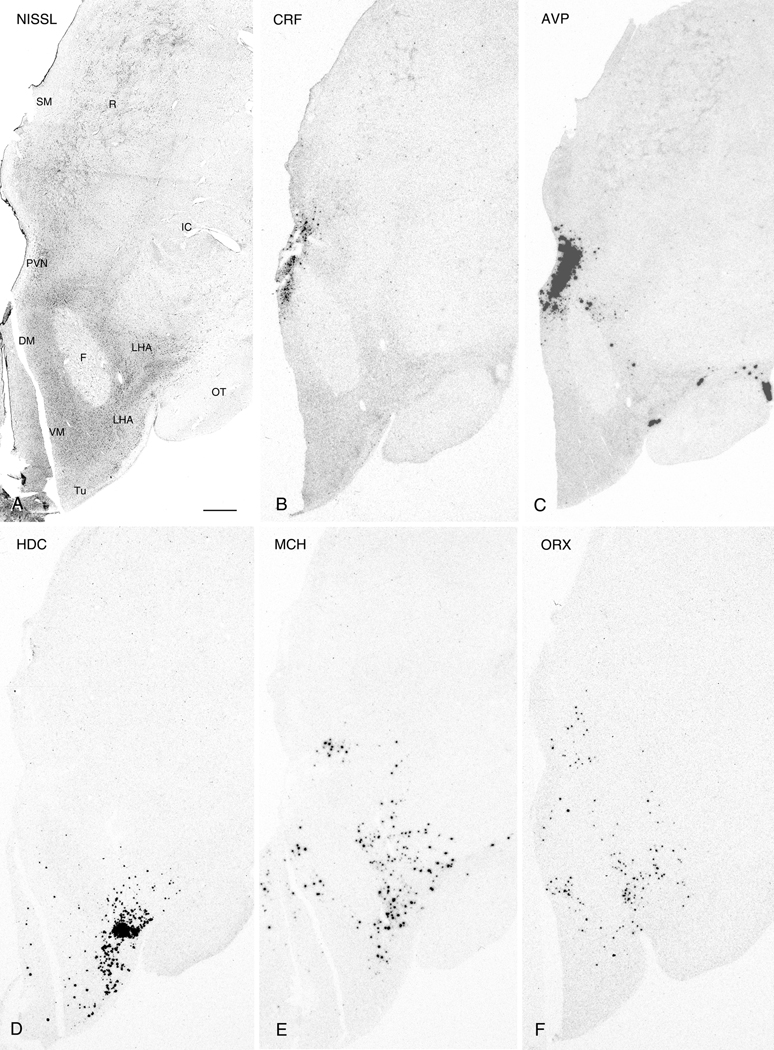
For the purposes of description, the hypothalamus was arbitrarily divided into three rostro-caudal regions. The most anterior region was defined as that containing the full rostro-caudal extent of the PVN. The intermediate region was defined as that containing the greater part of the ventral medial nucleus and adjacent tuberal area. The caudal region was that which contained the full extent of the mammillary nuclei. Within each region, sublevels could also be discerned based upon the presence of particular nuclei and the expression patterns of individual mRNAs. Evaluation of saturated ISH signals and adjacent 50µm Nissl-stained sections revealed a similar distribution of both CRF and AVP mRNA in cells forming the PVN and SON. In the PVN, the localization of both molecules was co-extensive, beginning rostrally where labeled cells were located ventral to the fornix and adjacent to the 3V (Fig. 1B,C) and continued with the localization shifting medial (Fig. 2B,C) and finally dorsal to the fornix (Fig. 3B,C). A change in the topography of CRF and AVP mRNA-expressing cells also followed the changes in topographic localization of the SON. The presence of weak CRF ISH signal in the SON contrasts with the results of Mouri et al. (1992) who reported an absence of CRF immunoreactivity in the SON of the human hypothalamus, but is in agreement with similar studies in rodents that detected specific CRF signal in the SON (Burlet et al., 1983; Shioda et al., 1985). Hybridization signals for both probes displayed a clear rostro-caudal transition from a single neuronal group along the optic tract rostrally (Fig. 1B,C) to distinct dorsolateral (dlSON) and ventromedial (vmSON) segments separated by the lateral hypothalamic area (LHA) including its larger celled lateral part more posteriorly (Fig. 2B,C). At the latter level, unlike CRF, appreciable AVP expression was also observed within the LHA and dorsal hypothalamic area (DHA) (Fig 2B). This labeling may reflect expression in neurons displaced from the SON.
Figure 1.
Nissl-staining and ISH in adjacent 50µm thick sections from the anterior PVN region. Photomicrographs of a Nissl-stained section (A) and autoradiograms of adjacent sections labeled with cRNA probes for CRF (B), AVP (C), HDC (D), MCH (E), and ORX (F). Note the weak CRF ISH signal in the SON and absence of HDC, MCH, and ORX expression at this anatomical level. Abbreviations: AC, anterior commissure;AHA, anterior hypothalamic area; F, fornix; IC: internal capsule; NST: nucleus of stria terminalis; OCX, optic chiasm; PVN, paraventricular nucleus; SI: substantia innominata; SON, supraoptic nucleus. Scale bar, 1mm.
Figure 2.
Nissl-staining and ISH in adjacent 50µm thick sections from the intermediate PVN region. Photomicrographs of a Nissl-stained section (A) and autoradiograms of adjacent sections demonstrating expression of CRF (B), AVP (C), HDC (D), MCH (E), and ORX (F). Note the expression of AVP, but not CRF, in the LHA. Abbreviations: AL: ansa lentyicularis; DHA, dorsal hypothalamic area; DM, dorsomedial hypothalamic nucleus; F, fornix; GPi: internal; segment of globus pallidus; IC: internal capsule; INF, infundibulum; LHA, lateral hypothalamic area; OT, optic tract; PVN, paraventricular nucleus; SM: stria medullaris; SON, supraoptic nucleus; VM, ventromedial hypothalamic nucleus. Scale bar, 1mm.
Figure 3.
Nissl-staining and ISH in adjacent 50µm thick sections from the caudal PVN region. Photomicrographs of a Nissl-stained section (A) and autoradiograms of adjacent sections demonstrating expression of CRF (B), AVP (C), HDC (D), MCH (E), and ORX (F). Abbreviations: DHA, dorsal hypothalamic area; DM, dorsomedial hypothalamic nucleus; F, fornix; IC: internal capsule; INF, infundibulum; LHA, lateral hypothalamic area; OT, optic tract; PVN, paraventricular nucleus; R: reticular nucleus of thalamus; SM: stria medullaris; SON, supraoptic nucleus; TM, tuberomammillary nucleus; TU, tuberal region; VM, ventromedial hypothalamic nucleus. Scale bar, 1mm.
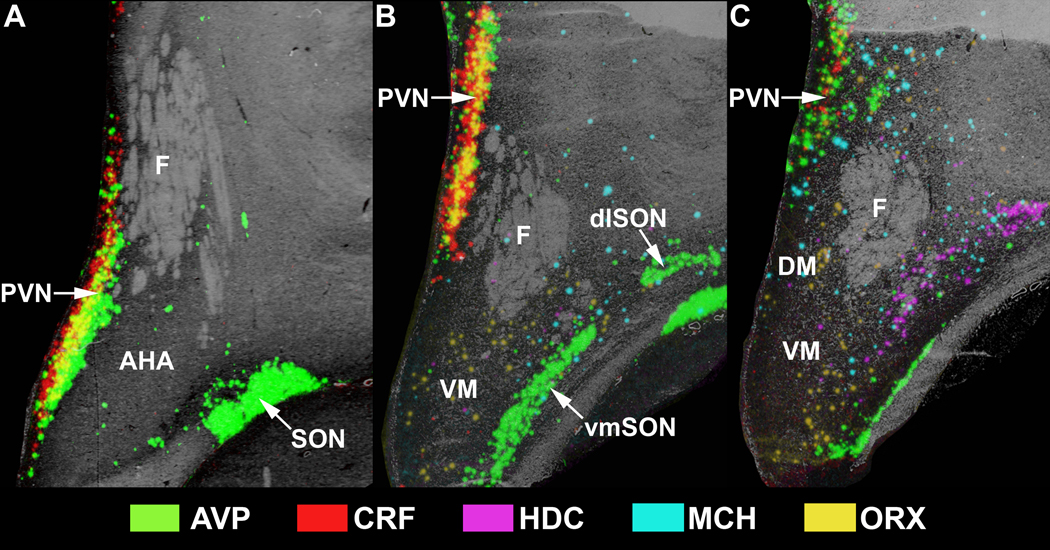
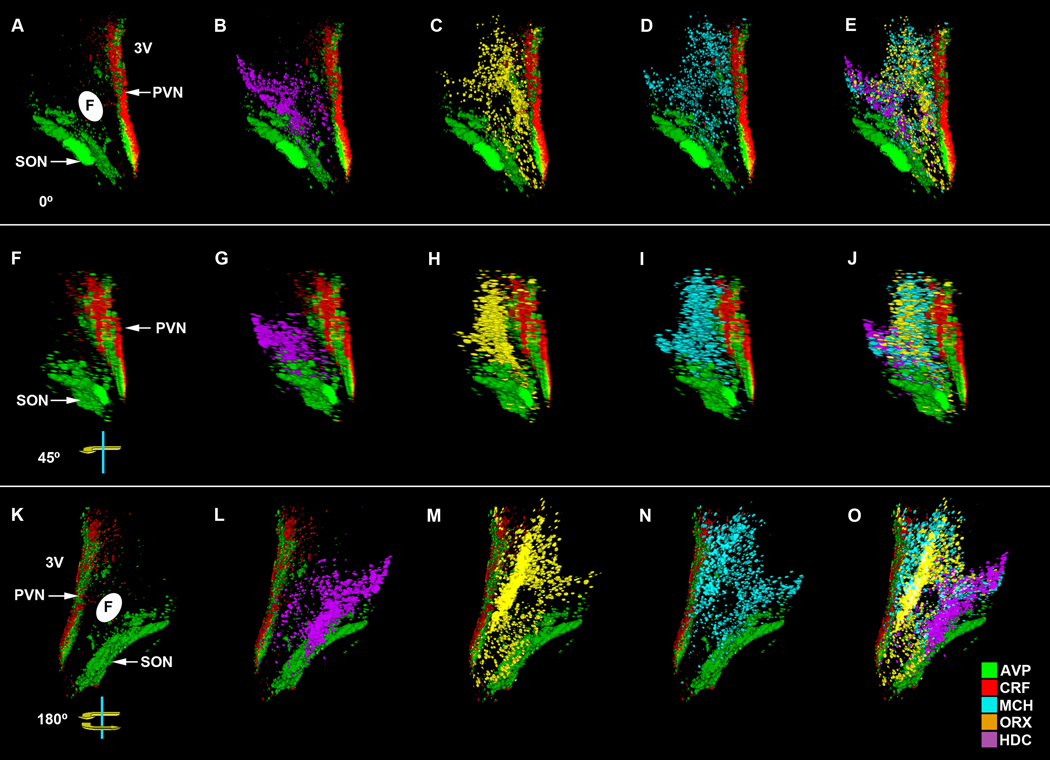
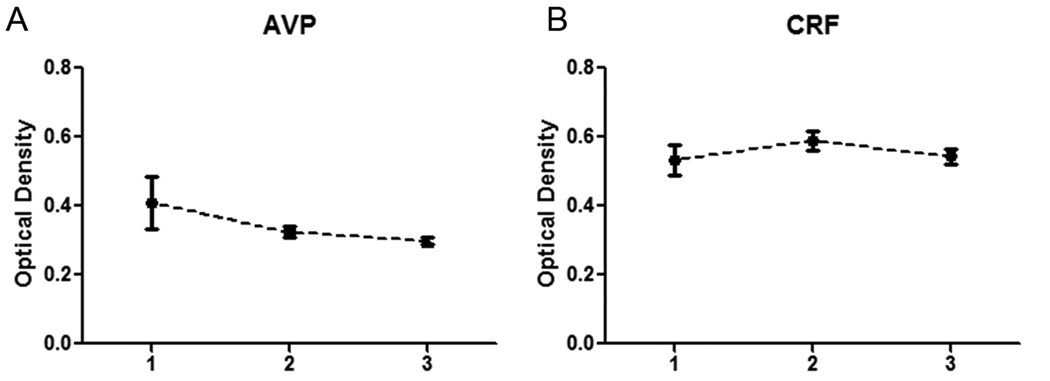
To further visualize hypothalamic neurochemical architecture and to perform quantitative measurements, ISH experiments utilizing 10µm thick sections from 19 of the 51 brains were used, for reasons outlined in the methods. Of these, a total of 11 exhibited CRF and AVP mRNA signal in the PVN. Computer-based 2D color-coded photomicrographs (Fig. 4A-C) showed that CRF and AVP ISH signals largely overlap along the rostral-caudal extent of the PVN. However, CRF expression did appear slightly more intense medially adjoining the 3V where consistent overlap with AVP mRNA was not evident (Fig 4A,B). 3D reconstruction of the PVN region and rotation of 0° (Fig. 5A-E), 45° (Fig. 5F-J), and 180° (Fig. 5K-O) demonstrates the continuity of CRF mRNA within the PVN as well as AVP mRNA in the PVN and SON. Moreover, 3D visualization of the PVN showed the spatial distribution of CRF and AVP mRNAs along the z-axis, defined by depth, as well as by its relationship to HDC, MCH, and ORX mRNA transcript expression which began at the level of the intermediate and caudal PVN (see below). Quantitative analyses between subjects along the rostro-caudal extent of the PVN showed no significant differences in the overall intensity of CRF or AVP mRNA between rostral, intermediate, or caudal levels of the hypothalamus (Fig. 6A,B). Due to the disparities in the dorsoventral and/or mediolateral extent of some of the hypothalamic blocks, insufficient samples of the SON were available for subregional quantitative analyses. In contrast to 50µm sections, CRF mRNA was rarely detected in the SON in 10µm hypothalamic sections. This observation likely reflects the inability to identify low expression levels in thin sections of the human SON.
Figure 4.
2D reconstruction of the human hypothalamus in the region of the paraventricular nucleus. Overlays of ISH signals over the grayscale images of an adjacent Nissl- stained section at different levels of the anterior hypothalamus. A, B, and C are in sequential rostro-caudal order which can be determined by the pattern of gene expression in relation to the fornix. Abbreviations: AHA, anterior hypothalamic area; dlSON, dorsolateral supraoptic nucleus; DM, dorsomedial hypothalamic nucleus; F, fornix; LHA, lateral hypothalamic nucleus; PVN, paraventricular nucleus; SON, supraoptic nucleus; vmSON, ventromedial supraoptic nucleus; VM, ventromedial hypothalamic nucleus.
Figure 5.
3D reconstruction and rotation of the human hypothalamus in the region of the paraventricular nucleus. Combined visualization of CRF, AVP, HDC, MCH and ORX. The representative 3D shows a 0° front view (A-E) as well as a 45° z-axis visualization (F-J) and 180° caudal view (K-O). Abbreviations: 3V, third ventricle; F, fornix; PVN, paraventricular nucleus; SON, supraoptic nucleus.
Figure 6.
Quantitative in situ hybridization of three subregions of the human PVN. The suggested divisions are based in a combination of anatomical features and signal topography for each transcript. Regions 1, 2, and 3 correspond to the rostral, intermediate, and caudal PVN, respectively. (A) Quantitation of AVP signal intensity. (B) Quantitation of CRF signal intensity.
HDC, MCH, and ORX mRNA Distribution
Comparisons between ISH and Nissl-stained 50µm guide sections revealed HDC, MCH, and ORX mRNA labeling at the levels of the intermediate and caudal PVN where each exhibited similar gene expression patterns. (see Fig. 4B,C and Fig. 5A-C for 2- and 3-dimensional visualizations, respectively). At the intermediate PVN level, mRNA for each of these signaling molecules was largely confined to the LHA with ORX additionally localized to the ventromedial hypothalamic nucleus (VM) (Fig. 2D-F). At the level of the caudal PVN, all three hybridization signals extended into the lateral aspect of the LHA (Fig. 3D-F). However, in contrast, MCH and ORX mRNA were also jointly expressed in the DHA and DM (Fig. 3E,F).
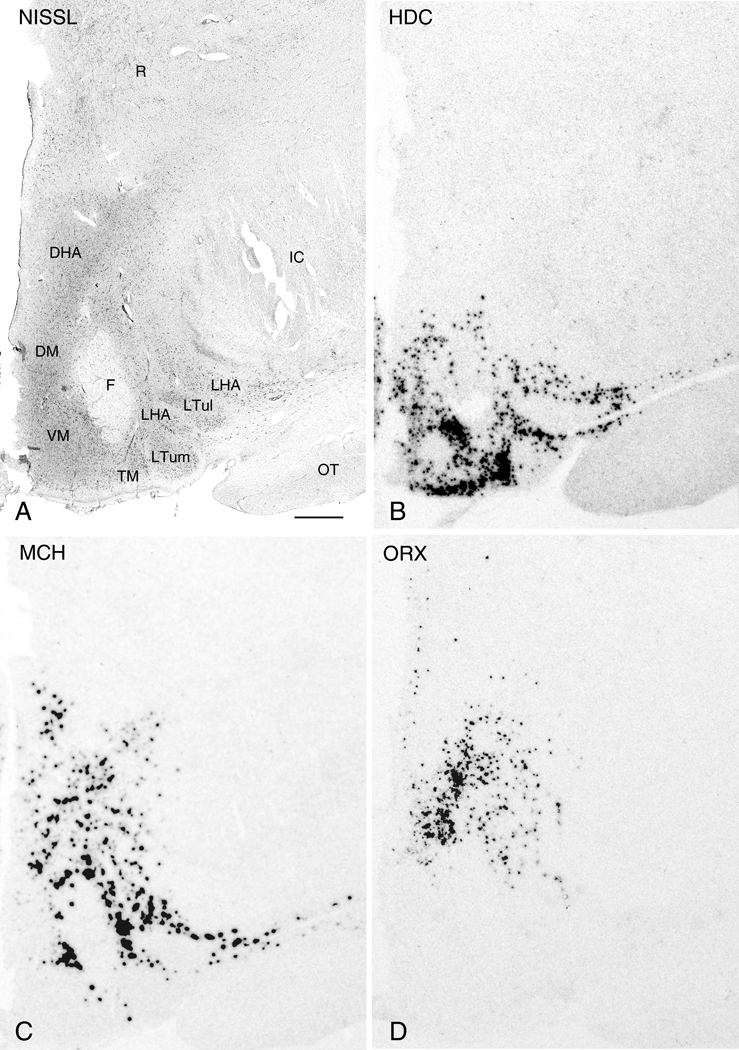
In intermediate and caudal regions of the hypothalamus, five distinct successive levels could be distinguished by differences in the labeling pattern. Beginning at a level where the PVN ends and the tuberomammillary nucleus (TM) becomes evident, HDC, MCH, and ORX mRNA each displayed characteristic expression patterns. HDC hybridization signal was robust throughout most of the ventral hypothalamus including the HLA, TM, and DM (Fig. 7B). HDC mRNA expressing cells generally circumscribed the VM with sparse expression centrally. This expression pattern appears to correspond to the TM subdivisions previously described by Panula et al. (1990) with HDC neurons extending into what we define as the DM and the HLA. These likely represent displaced HDC cells corresponding to the medial and lateral TM, respectively, while a combination of the HLA and TM represent the ventral TM segment. Nonetheless, MCH mRNA shared some degree of similarity with both HDC by displaying substantial signal in the HLA, DM, and DHA (Fig. 7C). ORX mRNA expression was generally confined to the DHA (Fig. 7D).
Figure 7.
Nissl-staining and ISH in adjacent 50µm thick sections from the intermediate region of the hypothalamus. Photomicrographs of a Nissl-stained section (A) and autoradiograms of adjacent sections demonstrating expression of HDC (B), MCH (C), and ORX (D). Abbreviations: DHA, dorsal hypothalamic area; DM, dorsomedial hypothalamic nucleus; F, fornix; IC: internal capsule; LHA, lateral hypothalamic area; OT, optic tract; PVN, paraventricular nucleus; R: reticular nucleus of thalamus; SON, supraoptic nucleus; TM, tuberomammillary nucleus; Tu: tuberal region; VM: ventromedial hypothalamic nucleus. Scale bar, 1mm.
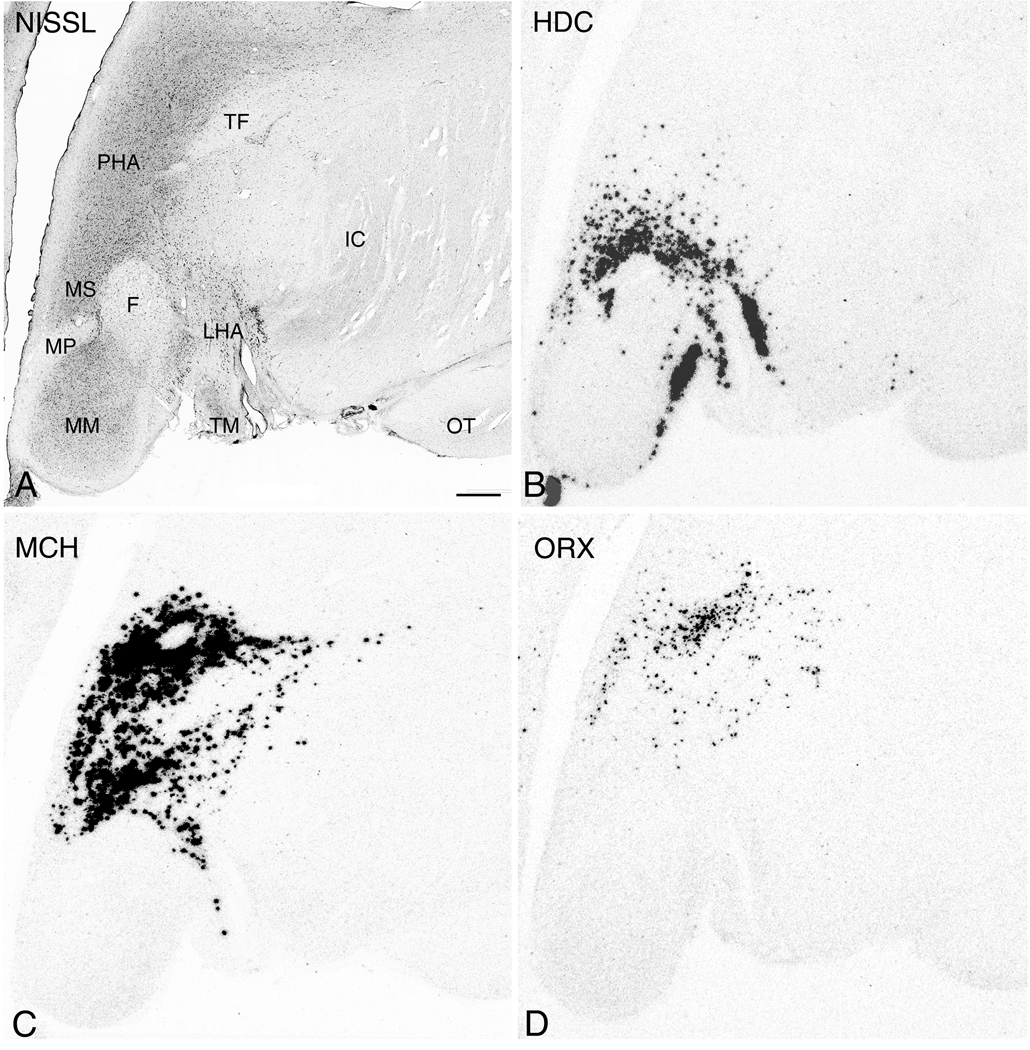
Moving caudally, the lateral (LTul) and medial (LTum) segments of the lateral tuberal nucleus become apparent within the LHA region. Here, HDC, MCH, and ORX hybridization signal was similar to that found at the previous level. However, the LTul and LTum were virtually void of HDC and MCH signal (Fig. 8B-D). In the caudal region of the hypothalamus the presence of the mammillary peduncle and its transition into the mammillothalamic tract serve as key anatomical landmarks. Where the mammillary peduncle is present ventral to the fornix and the rostral parts of the mammillary bodies begin to take shape, HDC mRNA is still confined to cells of the DM, TM, and HLA (Fig. 9B). At this level, the cells showing the presence of HDC signal in the latter two nuclei correspond to the caudal TM segment previously described by Panula et al. (1990). The extent of MCH mRNA expression was shown to span the LHA, DM, and DHA (Fig. 9C) while ORX mRNA was localized to cells of the DHA (Fig. 9D). Within the dorsal part of the DHA and close to the midline within an area of dense MCH positive neurons, the labeled neurons formed a ring-like shape outlining a central core of non-labeled cells. Previous double-labeling ISH experiments (Krolewski et al., 2008) in combination with examination of adjacent Nissl-sections demonstrated that the center portion exhibiting an absence of signal is not a white matter tract, but rather a separate neurochemically distinct neuronal cluster.
Figure 8.
Nissl-staining and ISH in adjacent 50µm thick sections from the intermediate region of the hypothalamus (plane of the lateral tuberal nucleus). Photomicrographs of a Nissl-stained section (A) and autoradiograms of sections demonstrating expression of HDC (B), MCH (C), and ORX (D). Abbreviations: DHA, dorsal hypothalamic area; DM, dorsomedial hypothalamic nucleus; F, fornix; IC: internal capsule; INF, infundibulum; LTul, lateral portions of the lateral tuberal nucleus; LTum, medial portion of the lateral tuberal nucleus; LHA, lateral hypothalamic area; OT, optic tract; PVN, paraventricular nucleus; R: reticular nucleus of thalamus; SON, supraoptic nucleus; TM, tuberomammillary nucleus; TU, tuberal region; VM, ventromedial hypothalamic nucleus. Scale bar, 1mm.
Figure 9.
Nissl-staining and ISH in adjacent 50µm thick sections from the caudal hypothalamic region (plane of rostral mammillary bodies). Photomicrographs of a Nissl-stained section (A) and autoradiograms of sections demonstrating expression of HDC (B), MCH (C), and ORX (D). Abbreviations: DHA, dorsal hypothalamic area; DM, dorsomedial hypothalamic nucleus; F, fornix; IC: internal capsule; LHA: lateral hypothalamic area; MM, medial mammillary nucleus; MP, mammillary peduncle; OT, optic tract; TF: thalamic fasciculus; TM, tuberomammillary nucleus. Scale bar, 1mm.
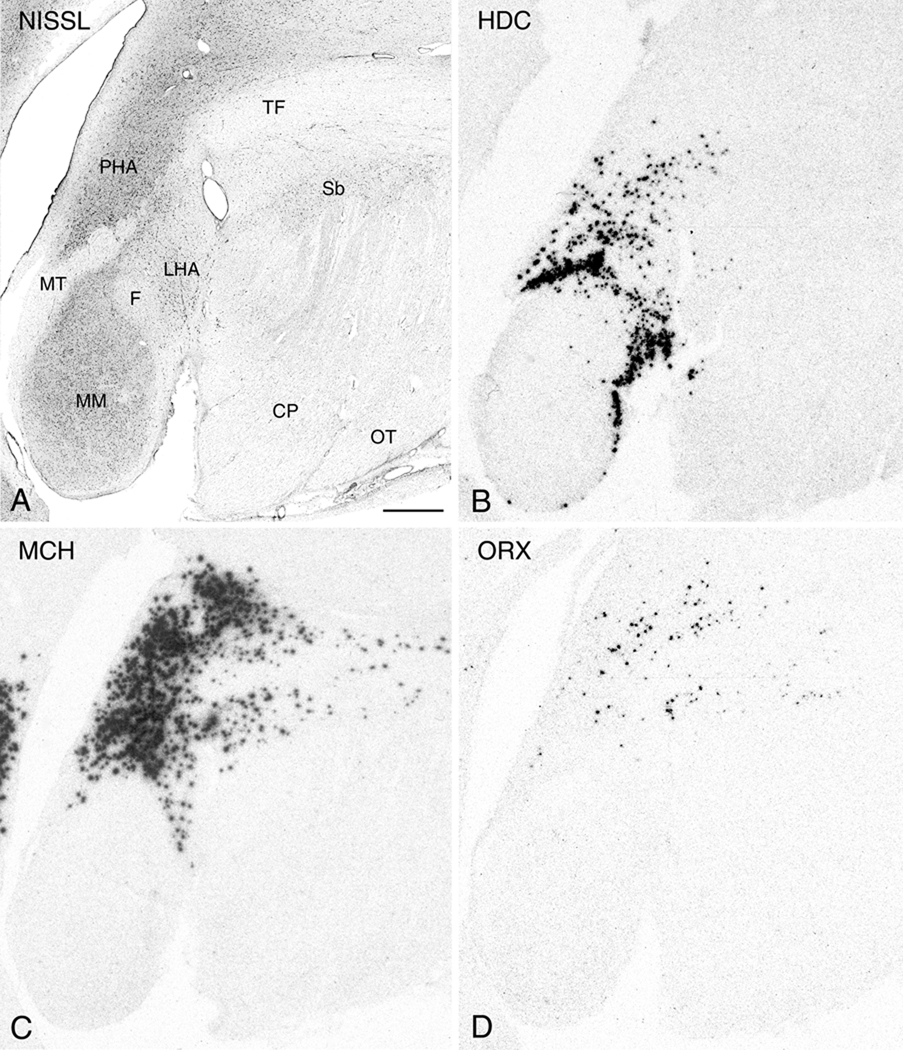
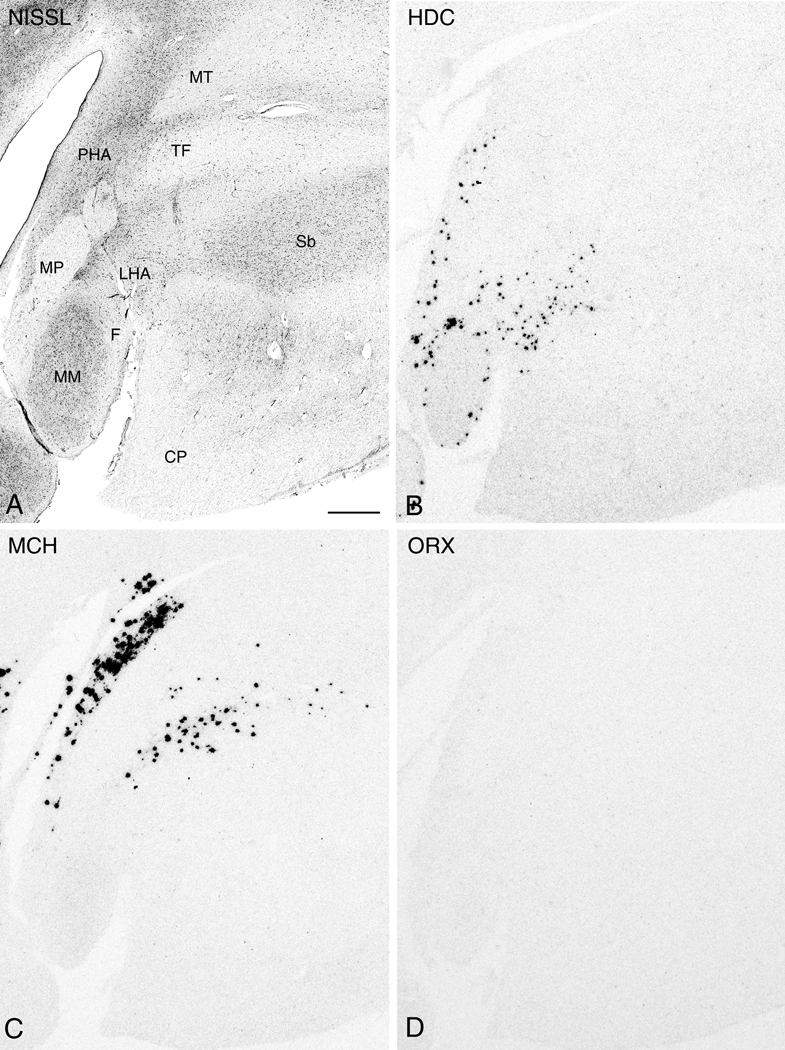
More caudally where there is appreciable enlargement of the mammillary bodies and the formation of the mammillothalamic tract which demarcates the posterior hypothalamic area (PHA). Here, diminishing size of the mammillary bodies and a shift of the PHA toward the 3V are characteristic. Among the most caudal regions, with the exception of visible HDC expression within the cells of the lateral mammillary nucleus (ML) (Fig. 10B), the comparative relationships between HDC, MCH, and ORX mRNA expressing cells are generally similar, with a noticeable qualitative reduction in the area of expression caudally (Figs. 10A-D and 11A-D).
Figure 10.
Nissl-staining and ISH in adjacent 50µm thick sections from the caudal hypothalamic region (plane of the intermediate mammillary bodies). Photomicrographs of a Nissl-stained section (A) and autoradiograms of adjacent sections demonstrating expression of HDC (B), MCH (C), and ORX (D). Abbreviations: CP: cerebral peduncle; F, fornix; LHA: lateral hypothalamic area; ML, lateral mammillary nucleus; MM, medial mammillary nucleus; MT, mammillothalamic tract; OT: optic tract; PHA, posterior hypothalamic area; Sb: subthalamic nucleus; TF: thalamic fasciculus. Scale bar, 1mm.
Figure 11.
Nissl-staining and ISH in adjacent 50µm thick sections from the caudal hypothalamic region (plane of the caudal mammillary bodies). Photomicrographs of a Nissl-stained section (A) and autoradiograms of adjacent sections demonstrating expression of HDC (B), MCH (C), and ORX (D). Abbreviations: CP: cerebral peduncle; F, fornix; LHA: lateral hypothalamic area; MM, medial mammillary nucleus; MP: mammillary peduncle; MT, mammillothalamic tract; PHA, posterior hypothalamic area; Sb: subthalamic nucleus; TF: thalamic fasciculus. Scale bar, 1mm.
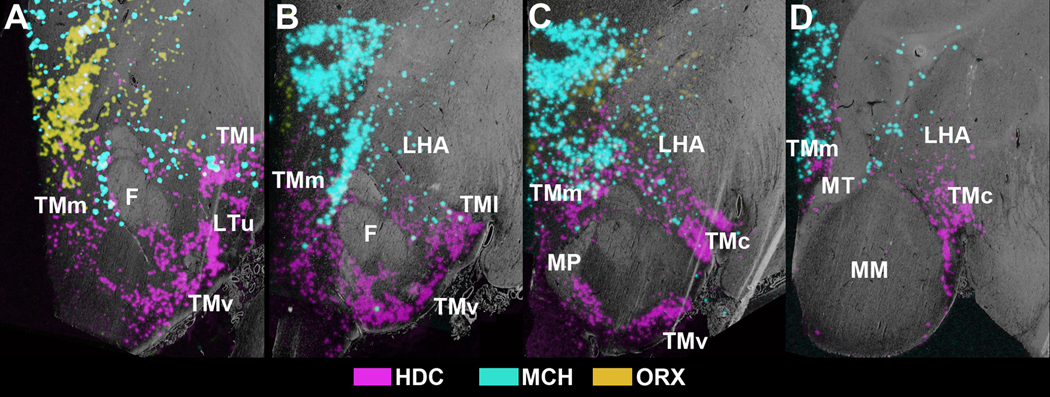
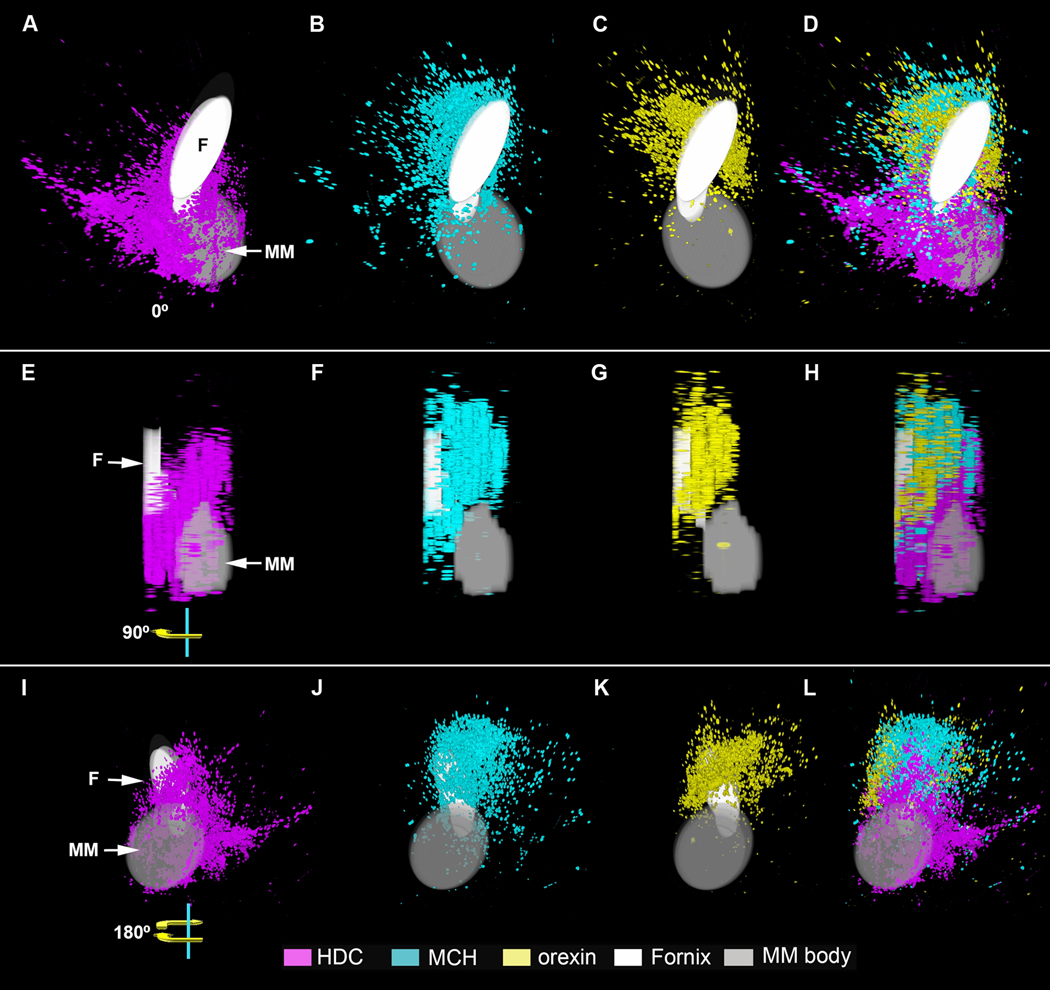
In an effort to further detail the relative distributions of HDC, MCH, and ORX expression and determine potential quantitative regional differences, we studied in detail sections from hypothalamic blocks of the 19 brains that had intact hypothalami, showed optimal orientation, and exhibited hybridization. The spatial distribution of cells expressing HDC, MCH, and ORX mRNA demonstrated distinct non-overlapping regions that could be recognized based on characteristics such as shape and intensity of labeling of the regions containing labeled cells. The anatomical relationships between nuclei expressing these transcripts are represented by 2D color-coded photomicrographs (Fig. 12A-D) and 3D reconstructions (Fig. 13A-L). Sections from hypothalami of the 19 subjects with suitable anatomical orientation were aligned by matching the outlines of nuclei from section to section (HDC, n=11; MCH, n=6, ORX, n=7). The overall intensity of hybridization signal within specific hypothalamic nuclei was quantified in a linear gray-scale range and expressed as optical density units.
Figure 12.
Overlays of ISH signals over the grayscale images of adjacent Cresyl Violet/Luxol Fast Blue stained sections at different levels of the intermediate and caudal regions of the human hypothalamus. (A) Premammillary level. (B) Level of the caudal end of the fornix. (C) Rostral mammillary level at the principal mammillary fasciculus. (D) Posterior level through the medial mammillary nucleus. Abbreviations: F, fornix; Ff, field of Forel; MM, medial mammillary nucleus; MP, peduncle; Mt, mammillothalamic tract; TMc, caudal tuberomammillary nucleus; TMl; lateral tuberomammillary nucleus; TMm, medial tuberomammillary nucleus; TMv, ventral tuberomammillary nucleus.
Figure 13.
3D reconstruction of in-situ hybridization signals for HDC (purple), MCH (blue) and orexin (yellow) mRNA. Solid drawings of the fornix (F) and medial mammillary nucleus (MM) were added for anatomical reference. This set of images represents rotation from the 0° front (A-D), to the 90° sagittal (E-H), and 180° caudal (I-L) views. Note the considerable overlap between the transcripts is accompanied by the predominance for each within specific areas. Abbreviations: F: fornix. MM: mammillary bodies.
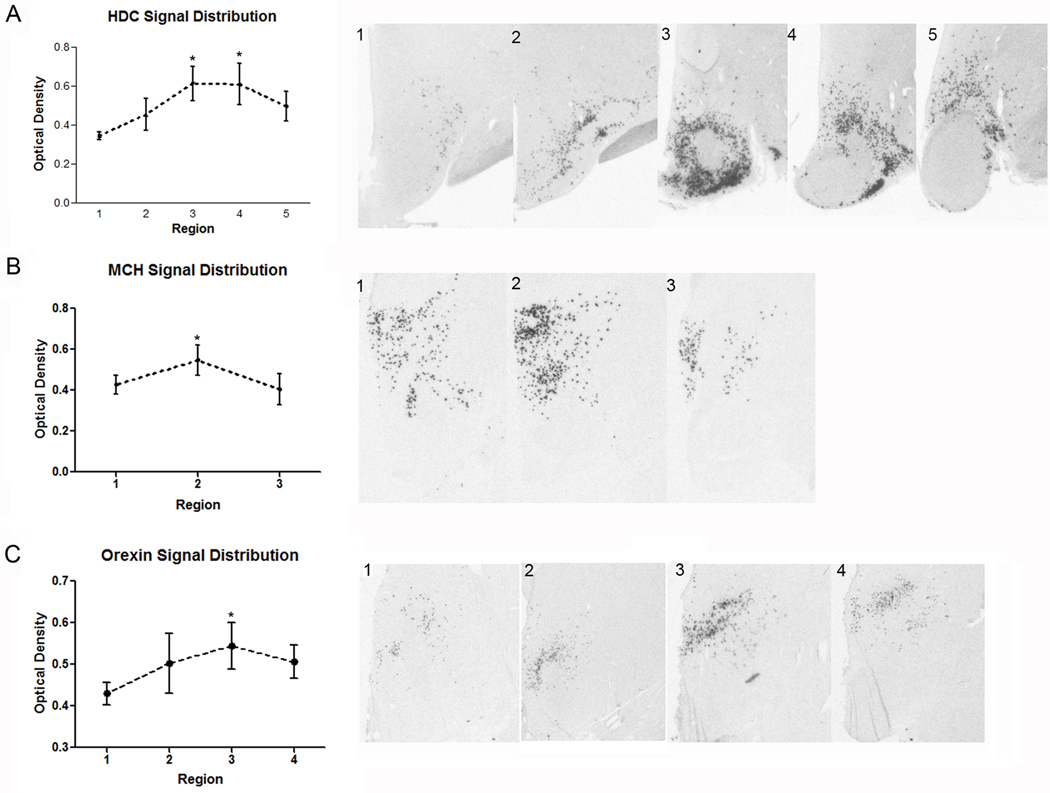
Examination of 5 comparable regions displaying HDC mRNA expression was undertaken. Starting at the level of the caudal PVN, where the rostral LHA is situated, a progressive increase in the intensity of HDC mRNA signal leading up to the level of the TM, caudal DM and more caudal LHA was revealed (Fig. 14A). Individual signal intensity measurements taken from the TMm, TMv, TMl, and TMc as described by Panula et al. (1990) showed no sub-regional differences. However, when measuring combined nuclear signal intensity, the planes of the premammillary area and rostral mammillary bodies showed the highest densitometric expression of HDC mRNA.
Figure 14.
Quantitative in situ hybridization for HDC, MCH and orexin mRNA in the intermediate and caudal regions of the human hypothalamus. The suggested divisions are based in a combination of anatomical features and quantification of the signal intensity for each transcript. (A1-5) Subdivisions for HDC expression. (A1) Level of the caudal paraventricular nucleus. (A2) Level of the lateral tuberal nucleus. (A3) Premammillary level. (A4) Rostral mammillary level. (A5) Mammillary level. (B1-4) MCH distribution can be divided in three main levels: (B1) premammillary level, (B2), rostral mammillary level and (B3), posterior hypothalamic level, with the higher intensity of signal at the second level. (C1-4) Suggested divisions for orexin signal: (C1) Periventricular level. (C2) Rostral premammillary level. (C3) Caudal premammillary level. (C4) Rostral mammillary level. Asterisk denotes p<0.05 versus “region one” within the rostro-caudal extent of analysis for each probe.
Similar to HDC patterns of expression, MCH and ORX patterns each initially appeared as low intensity signal that progressively became more intense along the rostro-caudal axis and declined after achieving maximum intensity. In the caudal region of the hypothalamus, in identifying the hypothalamic nuclei containing highest expression levels, we evaluated MCH and ORX expression intensity within 3 and 4 planes, respectively, that encompassed the overall region of labeled cells. Measurement of MCH hybridization signal was evaluated in the DHA and PHA only and was significantly different and most intense in the DHA at the level of the rostral mammillary bodies which included the characteristic ring-like configuration of labeled cells (Fig. 14B). The measurements acquired from the most rostral plane analyzed for ORX mRNA showed expression in the DM nucleus; those at more caudal planes showed labeling confined to the DHA. Quantitative analysis demonstrated ORX hybridization signal to be highest in the DHA at a level dorsal to the premammillary area (Fig. 14C)
DISCUSSION
Importance of Human Hypothalamic Biochemical Maps
In the present study we utilized ISH histochemistry in order to generate gene expression maps for CRF, AVP, HDC, MCH, and ORX in the human hypothalamus. These anatomical templates serve not only to map specific nuclei, but also to create maps of the nuclear relationships characterized by labeling with selected probe sets. Establishing these types of neurochemical maps will form a baseline for further studies and facilitate the identification of nuclei expressing particular mRNAs in the human hypothalamus. The importance of understanding the neurochemical organization of the human hypothalamus is highlighted by the dysregulation of one or more of these neuroactive substances in neuropsychiatric disorders such as depression (Raadsheer et al., 1994a; Raadsheer et al., 1995; Pruba et al., 1996; Meynen 2006; Wang et al., 2008), Alzheimer’s disease (Airaksinen et al., 1991; Raadsheer et al., 1995), Huntington’s disease (Aziz et al., 2007), Parkinson’s disease (Thannikal et al., 2007), and narcolepsy (Peyron et al., 2000; Thannikal et al., 2000).
Experimental evidence suggests that the genes whose expression was studied function, in part, to coordinate biological events throughout the HPA axis, which implies potential overlapping roles in neuropsychiatric/neurologic disorders. This is of particular importance given that the HPA axis exerts influence over an array of homeostatic and autonomic events that are central to an organism's ability to respond and adapt to environmental challenges. The role of CRF and AVP-expressing neurons within the PVN, which has been greatly detailed in depression, are crucial to such mechanisms and, therefore, human health and disease (for reviews see: Sawchenko et al., 1996; Herman et al., 2003; McEwen, 2007). Along with studies showing increased expression of these genes in depression (Raadsheer et al., 1994a; Raadsheer et al., 1995; Pruba et al., 1996; Meynen 2006; Wang et al., 2008), heightened levels of cerebrospinal fluid-derived CRF-like immunoreactivity (Nemeroff et al., 1984), as well as alterations in cortical CRF receptor expression (Merali et al., 2004) have also been demonstrated. These findings not only validate the need to pharmacologically target CRF and AVP receptors in the treatment of depressive symptoms as done previously (Holsboer et al., 2003a, 2003b), but to further uncover additional neurochemical signaling molecules that mediate the HPA axis.
Rodent studies indicate that central administration of histamine, MCH, or ORX enhances circulating levels of ACTH (Kjaer et al., 1994; Kuru et al., 2000; Al-Baranzanji et al., 2001; Kennedy et al., 2003). Similar studies also demonstrate that histamine and ORX each function to elevate CRF and AVP mRNA in the PVN (Kjaer et al., 1994; Al-Baranzanji et al., 2001). Although the fact that MCH infused directly into the PVN enhances ACTH release (Kennedy et al., 2003) suggests a direct mechanism, this neuropeptide along with histamine and ORX may also modulate HPA-related processes through polysynaptic mechanisms. Histaminergic, MCH, and ORX neurons transmit information via extensive projections throughout the brain, to regions that include the thalamus, hippocampus, amygdala, dorsal raphe, locus coeruleus, and nearly the entire cortical mantle (Haas and Panula, 2003; Adamantidis and de Lecea, 2008). Taken together, the ability of these signaling molecules to increase ACTH secretion, and thus stimulate the HPA axis, implies a cooperative system that should be considered when examining human CNS disorders linked to stress (Swaab et al., 2005; Bao et al., 2008). Examination of this human hypothalamic network requires precise anatomical localization, as recently demonstrated through the use of laser capture microdissection (LCM) and quantitative PCR of the PVN (Wang et al., 2008). In the PVN of brains from depressed subjects, levels of mRNA for CRF are increased along with those for CRFR1, AVPR1A, mineralocorticoid, and estrogen receptors which mediate CRF production (Wang et al., 2008).
CRF and AVP Maps
Quantification of both CRF and AVP transcript signals in our sections showed no significant differences in the overall signal intensity of either transcript along the rostro-caudal axis of the PVN. However, the qualitative results of the current ISH-driven 2D and 3D reconstructions of the human PVN revealed an unexpectedly strong anatomical overlap between CRF and AVP mRNA expression along the rostro-caudal axis of the nucleus. This is somewhat different from the pattern described in the rat by Simmons and Swanson (2008) in their high-resolution, serial section 3D reconstruction of the PVN. Their results suggest that although CRF-producing neurons are mainly situated along the 3V, as in the present study, AVP expressing cells form a more complex wing-like region within the nucleus. The present observations are more in line with the previous work of Koutcherov et al. (2000) who prepared a 3D immunohistochemistry-based human PVN reconstruction in which CRF immunostained cells were most often localized nearer the 3V while those immunostained for AVP typically extended more laterally. However, we observed an appreciable overlap of cells expressing each mRNA signal suggesting conjoint transcription in a sub-population of PVN neurons. This may reflect increased sensitivity of the radiolabeled ISH technique and/or post-translational differences. It should be noted that several previous immunocytochemical investigations of the human PVN indicate that CRF and AVP protein can be detected in the same PVN neurons (Mouri et al., 1993). Other studies show that when compared to controls, the PVNs in brains from depressed subjects exhibit nearly a three-fold increase in the number of CRF neurons displaying co-immunoreactivity for AVP (Raadsheer et al., 1994a). Enhanced colocalization of CRF and AVP is also associated with aging and Alzheimer’s Disease (Raadsheer et al., 1994b, 1994c). Thus an appreciable number of human periventricular localized CRF neurons appear capable of acquiring a gain in AVP transcription and this may be pertinent in the neurobiology of depression. An analogous capacity may also exist in rats, given that adrenalectomy or inhibition of axoplasmic transport with colchicine treatment increases CRF and AVP colocalization in parvocellular neurons by about 2 and 70%, respectively (Sawchenko et al., 1984a). In a surprising observation, we noted low CRF expression levels in the human SON, seen only after saturation of the radioactive labeling. This is unusual since local expression has not been described in the SON in other studies of the human hypothalamus (Wang et al., 2008). In rodents, however, it can be seen after physiological manipulations, such as dehydration or salt loading (Imaki et al., 1992; Kay-Nishiyama et al., 1999), which reveals that these magnocellular neurons are capable of expressing the gene. Therefore, in our human brains, conditions associated with the causes and nature of death may have predisposed to the upregulation of CRF in the SON.
HDC, MCH, and ORX Maps
Given the potential functional relationships of CRF and AVP with other hypothalamic signaling molecules, we sought to examine the mRNA expression pattern and intensities of expression for HDC, MCH, and ORX. Expression of these transcripts overlapped to some extent, but occurred in different nuclei along the rostro-caudal axis of the human hypothalamus. The distribution of HDC mRNA in the present study agrees with the findings of the ISH-based study of Trottier et al., (2002) as well as with the immunohistochemical analysis of histaminergic neurons in human brain (Airaksinen et al., 1991). The latter study localized histamine synthesizing neurons in clusters collectively termed the tuberomammillary complex. This complex was subdivided into four distinct parts classified as medial (TMm), ventral (TMv), caudal premammillary (TMc), and minor lateral parts (TMl) (Airaksinan et al., 1991). In the present study, maximum expression was found in the TMm, TMv, and TMl but expressing cells were also found within the DM and HLA,.
The extent to which the present results relate to rodent histamine neurochemistry is difficult to determine since the rodent TM complex cannot be readily homologized to the histaminergic E1-E5 cellular groups previously described in rats (Castren and Panula, 1990; Airaksinan et al., 1991). The distribution of histaminergic neurons in rodents is distinguished by more discrete cell clusters starting rostrally with the E4–5 group located dorsal to the dorsomedial nucleus. More caudally, the E2–3 group is positioned dorsal and lateral to the arcuate nucleus, while the E1 group is present only at the most posterior level of the mammillary nuclei (Castren and Panula, 1990; Airaksinan et al., 1991). It will be important to consider how the variations in human HDC gene expression we observed might be related to HPA axis activation in view of the increased expression of the immediate-early gene c-fos that occurs within E1-E5 histaminergic neurons in rats exposed to stress (Miklos and Kovacs 2003).
Our examination of MCH and ORX mRNA expression demonstrated patterns similar to those observed in previous immunohistochemical and ISH experiments on the human hypothalamus (Elias et al., 1998; Elias et al., 2001; Thannickal et al., 2007; Aziz et al., 2008). The anatomical localization of these transcripts greatly overlapped in the DHA within the anatomical planes of the premammillary area and rostral mammillary region. Expression of the transcripts had previously been localized to separate and distinct populations of neurons in both human and rat (Elias et al., 1998). The analyses of MCH and ORX mRNA showed anatomical heterogeneity, with mRNA signal reaching maximum intensity for MCH mRNA in the DHA dorsal to the rostral mammillary bodies and for ORX mRNA in the DHA at the level of the supramammillary region. These relationships differ in human as compared to rat since the most prominent MCH expression in the rodent resides within the lateral hypothalamic area and ORX expression is most abundant within the dorsomedial and perifornical areas (Bittencourt et al., 1992; Elias et al., 1998; Peyron et al., 1998; Nambu et al., 1999). In the lateral hypothalamic area of the rat, MCH and ORX have also been shown to be localized in discrete populations of presympathetic motor neurons that may regulate stress responses independent of ACTH release (Kerman et al., 2007). Based on our findings as well those of others, we suggest that the overlapping anatomical pattern of MCH and ORX neurons in the human potentially positions these neuropeptides to participate in the regulation of similar biological processes.
Conclusion
The present anatomical study utilized classical histological techniques and ISH histochemistry in conjunction with computer-based mapping to generate 2D and 3D reconstructions of the regions and nuclei containing CRF, AVP, HDC, MCH, and ORX expressing neurons in the human hypothalamus. Through the use of these neurochemical maps we were able to quantify the relative mRNA signal strength in identical sub-regions across the hypothalami of brains from different human subjects. Although we did not find differences in CRF and AVP expression at different rostro-caudal levels of the PVN, significant anatomically-dependant variations in the intensity of HDC, MCH, and ORX were revealed. These data further illustrate the neurochemical heterogeneity of the human hypothalamus and will provide an anatomical template for future quantitative experiments linking disease and functional neuroanatomy.
Supplementary Material
ACKNOWLEDGMENTS
The authors would like to thank Dr. David Walsh for explaining the University of California, Irvine Psychological Autopsy Protocol. The authors would also like to acknowledge Ms. Jennifer Fitzpatrick and Mr. Phong Nguyen for their technical assistance in processing the human tissue used in this study. [W5]Finally, we thank James Beals for constructing the 3D hypothalamic models. The authors are members of the Pritzker Neuropsychiatric Disorders Research Fund L.L.C. A shared intellectual property agreement exists between this philanthropic fund and the University of Michigan, Stanford University, the Weill Medical College of Cornell University, the University of California, Davis, the University of California, Irvine, and the HudsonAlpha Institute to encourage the development of appropriate findings for research and clinical applications.
Grant Sponsor: Pritzker Neuropsychiatric Disorders Research Consortium, NIMH Conte Center grant MH60398, and NIMH grant MH077556.
Abbreviations
- 2D
2-dimensional
- 3D
3-dimensional
- 3V
third ventricle
- AC
anterior commissure
- ACTH
adrenocorticotropic hormone
- AHA
anterior hypothalamic area
- AL
ansa lenticularis
- AVP
arginine vasopressin
- CP
cerebral peduncle
- CRF
corticotropin-releasing factor
- DHA
dorsal hypothalamic area
- dlSON
dorsolateral supraoptic nucleus
- DM
dorsomedial hypothalamic nucleus
- F
fornix
- GPi
internal segment of globus pallidus
- HDC
histidine decarboxylase
- HPA
hypothalamo-pituitary-adrenal
- IC
internal capsule
- INF
infundibulum
- ISH
in situ hybridization
- LHA
lateral hypothalamic area
- LTul
lateral segment of the lateral tuberal nucleus
- LTum
medial segment of the lateral tuberal nucleus
- MCH
melanin-concentrating hormone
- ML
lateral mammillary nucleus
- MM
medial mammillary nucleus
- MP
mammillary peduncle
- MS
supramammillary nucleus
- MT
mammillothalamic tract
- NST
nucleus of stria terminalis
- OCX
optic chiasm
- ORX
orexin/hypocretin
- OT
optic tract
- PHA
posterior hypothalamic area
- PVN
paraventricular nucleus of hypothalamus
- R
reticular nucleus of thalamus
- Sb
subthalamic nucleus
- SCN
suprachiasmatic nucleus
- SI
substantia innominata
- SM
stria medullaris
- SON
supraoptic nucleus
- ST
stria terminalis
- TF
thalamic fasciculus
- TM
tuberomammillary nucleus
- TMc
caudal tuberomammillary nucleus
- TMl
lateral tuberomammillary nucleus
- TMm
medial tuberomammillary nucleus
- TMv
ventral tuberomammillary nucleus
- TM
tuberomammillary nucleus
- TU
tuberal region
- VM
ventromedial hypothalamic nucleus
- vmSON
ventromedial supraoptic nucleus
LITERATURE CITED
- Adamantidis A, de Lecea L. Physiological arousal: a role for hypothalamic systems. Cell Mol Life Sci. 2008;65:1475–1488. doi: 10.1007/s00018-008-7521-8. [DOI] [PMC free article] [PubMed] [Google Scholar]
- Airaksinen MS, Paetau A, Paljarvi L, Reinikainen K, Riekkinen P, Suomalainen R, Panula P. Histamine neurons in human hypothalamus: anatomy in normal and Alzheimer diseased brains. Neuroscience. 1991;44:465–481. doi: 10.1016/0306-4522(91)90070-5. [DOI] [PubMed] [Google Scholar]
- Al-Barazanji KA, Wilson S, Baker J, Jessop DS, Harbuz MS. Central orexin-A activates hypothalamic-pituitary-adrenal axis and stimulates hypothalamic corticotropin releasing factor and arginine vasopressin neurones in conscious rats. J Neuroendocrinol. 2001;13:421–424. doi: 10.1046/j.1365-2826.2001.00655.x. [DOI] [PubMed] [Google Scholar]
- Arborelius L, Owens MJ, Plotsky PM, Nemeroff CB. The role of corticotropin-releasing factor in depression and anxiety disorders. J Endocrinol. 1999;160:1–12. doi: 10.1677/joe.0.1600001. [DOI] [PubMed] [Google Scholar]
- Aziz A, Fronczek R, Maat-Schieman M, Unmehopa U, Roelandse F, Overeem S, van Duinen S, Lammers GJ, Swaab D, Roos R. Hypocretin and melanin-concentrating hormone in patients with Huntington disease. Brain Pathol. 2008;18:474–483. doi: 10.1111/j.1750-3639.2008.00135.x. [DOI] [PMC free article] [PubMed] [Google Scholar]
- Bao A-M, Meynen G, Swaab DF. The stress system in depression and neurodegeneration: focus on the human hypothalamus. Brain Res Rev. 2008;57:531–553. doi: 10.1016/j.brainresrev.2007.04.005. [DOI] [PubMed] [Google Scholar]
- Bittencourt JC, Presse F, Arias C, Peto C, Vaughan J, Nahon JL, Vale W, Sawchenko PE. The melanin-concentrating hormone system of the rat brain: an immuno- and hybridization histochemical characterization. J Comp Neurol. 1992;319:218–245. doi: 10.1002/cne.903190204. [DOI] [PubMed] [Google Scholar]
- Braak H, Braak E. The hypothalamus of the human adult: chiasmatic region. Anat Embryol (Berl) 1987;175:315–330. doi: 10.1007/BF00309845. [DOI] [PubMed] [Google Scholar]
- Braak H, Braak E. Anatomy of the human hypothalamus (chiasmatic and tuberal region) Prog Brain Res. 1992;93:3–16. doi: 10.1016/s0079-6123(08)64559-8. [DOI] [PubMed] [Google Scholar]
- Broberger C, De Lecea L, Sutcliffe JG, Hökfelt T. Hypocretin/orexin- and melanin-concentrating hormone-expressing cells form distinct populations in the rodent lateral hypothalamus: relationship to the neuropeptide Y and agouti gene-related protein systems. J Comp Neurol. 1998;402:460–474. [PubMed] [Google Scholar]
- Burlet A, Tonon MC, Tankosic P, Coy D, Vaudry H. Comparative immunocytochemical localization of corticotropin releasing factor (CRF-41) and neurohypophysial peptides in the brain of Brattleboro and Long-Evans rats. Neuroendocrinology. 1983;37:64–72. doi: 10.1159/000123517. [DOI] [PubMed] [Google Scholar]
- Castren E, Panula P. The distribution of histidine decarboxylase mRNA in the rat brain: an in situ hybridization study using synthetic oligonucleotide probes. Neurosci Lett. 1990;120:113–116. doi: 10.1016/0304-3940(90)90181-8. [DOI] [PubMed] [Google Scholar]
- Dierickx K, Vandesande F. Immunocytochemical localization of the vasopressinergic and the oxytocinergic neurons in the human hypothalamus. Cell Tissue Res. 1977;184:15–27. doi: 10.1007/BF00220524. [DOI] [PubMed] [Google Scholar]
- Elias CF, Lee CE, Kelly JF, Ahima RS, Kuhar M, Saper CB, Elmquist JK. Characterization of CART neurons in the rat and human hypothalamus. J Comp Neurol. 2001;432:1–19. doi: 10.1002/cne.1085. [DOI] [PubMed] [Google Scholar]
- Elias CF, Saper CB, Maratos-Flier E, Tritos NA, Lee C, Kelly J, Tatro JB, Hoffman GE, Ollmann MM, Barsh GS, Sakurai T, Yanagisawa M, Elmquist JK. Chemically defined projections linking the mediobasal hypothalamus and the lateral hypothalamic area. J Comp Neurol. 1998;402:442–459. [PubMed] [Google Scholar]
- Estabrooke IV, McCarthy MT, Ko E, Chou TC, Chemelli RM, Yanagisawa M, Saper CB, Scammell TE. Fos expression in orexin neurons varies with behavioral state. J Neurosci. 2001;21:1656–1662. doi: 10.1523/JNEUROSCI.21-05-01656.2001. [DOI] [PMC free article] [PubMed] [Google Scholar]
- Gillies GE, Linton EA, Lowry PJ. Corticotropin releasing activity of the new CRF is potentiated several times by vasopressin. Nature. 1982;299:355–357. doi: 10.1038/299355a0. [DOI] [PubMed] [Google Scholar]
- Haas H, Panula P. The role of histamine and the tuberomamillary nucleus in the nervous system. Nat Rev Neurosci. 2003;4:121–130. doi: 10.1038/nrn1034. [DOI] [PubMed] [Google Scholar]
- Herman JP, Figueiredo H, Mueller NK, Ulrich-Lai Y, Ostrander MM, Choi DC, Cullinan WE. Central mechanisms of stress integration: hierarchical circuitry controlling hypothalamo-pituitary-adrenocortical responsiveness. Front Neuroendocrinol. 2003;24:151–180. doi: 10.1016/j.yfrne.2003.07.001. [DOI] [PubMed] [Google Scholar]
- Holsboer F. Corticotropin-releasing hormone modulators and depression. Curr Opin Investig Drugs. 2003a;4:46–50. [PubMed] [Google Scholar]
- Holsboer F. The role of peptides in treatment of psychiatric disorders. J Neural Transm Suppl. 2003b;64:17–34. doi: 10.1007/978-3-7091-6020-6_2. [DOI] [PubMed] [Google Scholar]
- Huang ZL, Qu WM, Li WD, Mochizuki T, Eguchi N, Watanabe T, Urade Y, Hayaishi O. Arousal effect of orexin A depends on activation of the histaminergic system. Proc Natl Acad Sci U S A. 2001;98:9965–9970. doi: 10.1073/pnas.181330998. [DOI] [PMC free article] [PubMed] [Google Scholar]
- Imaki T, Vale W, Sawchenko PE. Regulation of corticotropin-releasing factor mRNA in neuroendocrine and autonomic neurons by osmotic stimulation and volume loading. Neuroendocrinology. 1992;56:633–640. doi: 10.1159/000126286. [DOI] [PubMed] [Google Scholar]
- Jones EG, Hendry SH, Liu XB, Hodgins S, Potkin SG, Tourtellotte WW. A method for fixation of previously fresh-frozen human adult and fetal brains that preserves histological quality and immunoreactivity. J Neurosci Methods. 1992;44:133–144. doi: 10.1016/0165-0270(92)90006-y. [DOI] [PubMed] [Google Scholar]
- Jones EG. The thalamus. 2nd ed. Cambridge: Cambridge University Press; 2007. [Google Scholar]
- Kabbaj M, Devine DP, Savage VR, Akil H. Neurobiological correlates of individual differences in novelty-seeking behavior in the rat: differential expression of stress-related molecules. J Neurosci. 2000;20:6983–6988. doi: 10.1523/JNEUROSCI.20-18-06983.2000. [DOI] [PMC free article] [PubMed] [Google Scholar]
- Kay-Nishiyama C, Watts AG. Dehydration modifies somal CRH immunoreactivity in the rat hypothalamus: an immunocytochemical study in the absence of colchicine. Brain Res. 1999;822:251–255. doi: 10.1016/s0006-8993(99)01130-0. [DOI] [PubMed] [Google Scholar]
- Kelly TM, Mann JJ. Validity of DSM-III-R diagnosis by psychological autopsy: a comparison with clinician ante-mortem diagnosis. Acta Psychiatr Scand. 1996;94:337–343. doi: 10.1111/j.1600-0447.1996.tb09869.x. [DOI] [PubMed] [Google Scholar]
- Kennedy AR, Todd JF, Dhillo WS, Seal LJ, Ghatei MA, O'Toole CP, Jones M, Witty D, Winborne K, Riley G, Hervieu G, Wilson S, Bloom SR. Effect of direct injection of melanin-concentrating hormone into the paraventricular nucleus: further evidence for a stimulatory role in the adrenal axis via SLC-1. J Neuroendocrinol. 2003;15:268–272. doi: 10.1046/j.1365-2826.2003.00997.x. [DOI] [PubMed] [Google Scholar]
- Kerman IA, Bernard R, Rosenthal D, Beals J, Akil H, Watson SJ. Distinct populations of presympathetic-premotor neurons express orexin or melanin-concentrating hormone in the rat lateral hypothalamus. J Comp Neurol. 2007;505:586–601. doi: 10.1002/cne.21511. [DOI] [PubMed] [Google Scholar]
- Kjaer A, Larsen PJ, Knigge U, Warberg J. Histaminergic activation of the hypothalamic-pituitary-adrenal axis. Endocrinology. 1994;135:1171–1177. doi: 10.1210/endo.135.3.8070360. [DOI] [PubMed] [Google Scholar]
- Koutcherov Y, Mai JK, Ashwell KWS, Paxinos G. Organization of the human paraventricular hypothalamic nucleus. J Comp Neurol. 2000;423:299–318. [PubMed] [Google Scholar]
- Krolewski DM, Medina A, Kerman IA, Bernard R, Burke S, Jones EG, Bunney WE, Akil H, Watson SJ. A comparative anatomical assessment of gene expression patterns for calcium-binding proteins and GAD67 in the human and rhesus monkey hypothalamus. Society for Neuroscience Itinerary planner 677. 2008 6/QQ47. [Google Scholar]
- Kuru M, Ueta Y, Serino R, Nakazato M, Yamamoto Y, Shibuya I, Yamashita H. Centrally administered orexin/hypocretin activates HPA axis in rats. Neuroreport. 2000;11:1977–1980. doi: 10.1097/00001756-200006260-00034. [DOI] [PubMed] [Google Scholar]
- Li JZ, Vawter MP, Walsh DM, Tomita H, Evans SJ, Choudary PV, Lopez JF, Avelar A, Shokoohi V, Chung T, Mesarwi O, Jones EG, Watson SJ, Akil H, Bunney WE, Jr, Myers RM. Systematic changes in gene expression in postmortem human brains associated with tissue pH and terminal medical conditions. Hum Mol Genet. 2004;13:609–616. doi: 10.1093/hmg/ddh065. [DOI] [PubMed] [Google Scholar]
- Li YW, Halliday GM, Joh TH, Geffen LB, Blessing WW. Tyrosine hydroxylase-containing neurons in the supraoptic and paraventricular nuclei of the adult human. Brain Res. 1988;461:75–86. doi: 10.1016/0006-8993(88)90726-3. [DOI] [PubMed] [Google Scholar]
- Lightman SL. The neuroendocrinology of stress: a never ending story. J Neuroendocrinol. 2008;20:880–884. doi: 10.1111/j.1365-2826.2008.01711.x. [DOI] [PubMed] [Google Scholar]
- Masaki T, Yoshimatsu H, Chiba S, Watanabe T, Sakata T. Central infusion of histamine reduces fat accumulation and upregulates UCP family in leptin-resistant obese mice. Diabetes. 2001;50:376–384. doi: 10.2337/diabetes.50.2.376. [DOI] [PubMed] [Google Scholar]
- McEwen BS. Physiology and neurobiology of stress and adaptation: central role of the brain. Physiol Rev. 2007;87:873–904. doi: 10.1152/physrev.00041.2006. [DOI] [PubMed] [Google Scholar]
- Merali Z, Du L, Hrdina P, Palkovits M, Faludi G, Poulter MO, Anisman H. Dysregulation in the suicide brain: mRNA expression of corticotropin-releasing hormone receptors and GABA(A) receptor subunits in frontal cortical brain region. J Neurosci. 2004;24:1478–1485. doi: 10.1523/JNEUROSCI.4734-03.2004. [DOI] [PMC free article] [PubMed] [Google Scholar]
- Meynen G, Unmehopa UA, van Heerikhuize JJ, Hofman MA, Swaab DF, Hoogendijk WJ. Increased arginine vasopressin mRNA expression in the human hypothalamus in depression: A preliminary report. Biol Psychiatry. 2006;60:892–895. doi: 10.1016/j.biopsych.2005.12.010. [DOI] [PubMed] [Google Scholar]
- Miklos IH, Kovacs KJ. Functional heterogeneity of the responses of histaminergic neuron subpopulations to various stress challenges. Eur J Neurosci. 2003;18:3069–3079. doi: 10.1111/j.1460-9568.2003.03033.x. [DOI] [PubMed] [Google Scholar]
- Mouri T, Itoi K, Takahashi K, Suda T, Murakami O, Yoshinaga K, Andoh N, Ohtani H, Masuda T, Sasano N. Colocalization of corticotropin-releasing factor and vasopressin in the paraventricular nucleus of the human hypothalamus. Neuroendocrinology. 1993;57:34–39. doi: 10.1159/000126339. [DOI] [PubMed] [Google Scholar]
- Nambu T, Sakurai T, Mizukami K, Hosoya Y, Yanagisawa M, Goto K. Distribution of orexin neurons in the adult rat brain. Brain Res. 1999;827:243–260. doi: 10.1016/s0006-8993(99)01336-0. [DOI] [PubMed] [Google Scholar]
- Nemeroff CB, Widerlöv E, Bissette G, Walléus H, Karlsson I, Eklund K, Kilts CD, Loosen PT, Vale W. Elevated concentrations of CSF corticotropin-releasing factor-like immunoreactivity in depressed patients. Science. 1984;226:1342–1344. doi: 10.1126/science.6334362. [DOI] [PubMed] [Google Scholar]
- Palkovits M. Distribution of neuropeptides in the central nervous system: a review of biochemical mapping studies. Prog Neurobiol. 1984;23:151–189. doi: 10.1016/0301-0082(84)90001-7. [DOI] [PubMed] [Google Scholar]
- Panula P, Airaksinen MS, Pirvola U, Kotilainen E. A histamine-containing neuronal system in human brain. Neuroscience. 1990;34:127–132. doi: 10.1016/0306-4522(90)90307-p. [DOI] [PubMed] [Google Scholar]
- Pelletier G, Désy L, Côté J, Vaudry H. Immunocytochemical localization of corticotropin-releasing factor-like immunoreactivity in the human hypothalamus. Neurosci Lett. 1983;41:259–263. doi: 10.1016/0304-3940(83)90460-3. [DOI] [PubMed] [Google Scholar]
- Purba JS, Hoogendijk WJ, Hofman MA, Swaab DF. Increased number of vasopressin- and oxytocin-expressing neurons in the paraventricular nucleus of the hypothalamus in depression. Arch Gen Psychiatry. 1996;53:137–143. doi: 10.1001/archpsyc.1996.01830020055007. [DOI] [PubMed] [Google Scholar]
- Peyron C, Faraco J, Rogers W, Ripley B, Overeem S, Charnay Y, Nevsimalova S, Aldrich M, Reynolds D, Albin R, Li R, Hungs M, Pedrazzoli M, Padigaru M, Kucherlapati M, Fan J, Maki R, Lammers GJ, Bouras C, Kucherlapati R, Nishino S, Mignot E. A mutation in a case of early onset narcolepsy and a generalized absence of hypocretin peptides in human narcoleptic brains. Nat Med. 2000;6:991–997. doi: 10.1038/79690. [DOI] [PubMed] [Google Scholar]
- Qu D, Ludwig DS, Gammeltoft S, Piper M, Pelleymounter MA, Cullen MJ, Mathes WF, Przypek R, Kanarek R, Maratos-Flier E. A role for melanin-concentrating hormone in the central regulation of feeding behaviour. Nature. 1996;380:243–247. doi: 10.1038/380243a0. [DOI] [PubMed] [Google Scholar]
- Raadsheer FC, Hoogendijk WJ, Stam FC, Tilders FJ, Swaab DF. Increased numbers of corticotropin-releasing hormone expressing neurons in the hypothalamic paraventricular nucleus of depressed patients. Neuroendocrinology. 1994a;60:436–444. doi: 10.1159/000126778. [DOI] [PubMed] [Google Scholar]
- Raadsheer FC, Oorschot DE, Verwer RW, Tilders FJ, Swaab DF. Age-related increase in the total number of corticotropin-releasing hormone neurons in the human paraventricular nucleus in controls and Alzheimer's disease: comparison of the disector with an unfolding method. J Comp Neurol. 1994b;339:447–457. doi: 10.1002/cne.903390311. [DOI] [PubMed] [Google Scholar]
- Raadsheer FC, Tilders FJ, Swaab DF. Similar age related increase of vasopressin colocalization in paraventricular corticotropin-releasing hormone neurons in controls and Alzheimer patients. J Neuroendocrinol. 1994c;6:131–133. doi: 10.1111/j.1365-2826.1994.tb00563.x. [DOI] [PubMed] [Google Scholar]
- Raadsheer FC, van Heerikhuize JJ, Lucassen PJ, Hoogendijk WJ, Tilders FJ, Swaab DF. Corticotropin-releasing hormone mRNA levels in the paraventricular nucleus of patients with Alzheimer's disease and depression. Am J Psychiatry. 1995;152:1372–1376. doi: 10.1176/ajp.152.9.1372. [DOI] [PubMed] [Google Scholar]
- Rivier C, Vale W. Interaction of corticotropin-releasing factor and arginine vasopressin on adrenocorticotropin secretion in vivo. Endocrinology. 1983;113:939–942. doi: 10.1210/endo-113-3-939. [DOI] [PubMed] [Google Scholar]
- Sakurai T, Amemiya A, Ishii M, Matsuzaki I, Chemelli RM, Tanaka H, Williams SC, Richardson JA, Kozlowski GP, Wilson S, Arch JRS, Buckingham RE, Haynes AC, Carr SA, Annan RS, McNulty DE, Liu WS, Terrett JA, Elshourbagy NA, Bergsma DJ, Yanagisawa M. Orexins and orexin receptors: a family of hypothalamic neuropeptides and G protein-coupled receptors that regulate feeding behavior. Cell. 1998;92:573–585. doi: 10.1016/s0092-8674(00)80949-6. and addendum page 697. [DOI] [PubMed] [Google Scholar]
- Saper CB. Hypothalamus. In: Paxinos G, Mai J, editors. The Human Nervous System. Amsterdam: Elsevier; 2004. pp. 513–550. [Google Scholar]
- Sawchenko PE, Swanson LW, Vale WW. Co-expression of corticotropin-releasing factor and vasopressin immunoreactivity in parvocellular neurosecretory neurons of the adrenalectomized rat. Proc Natl Acad Sci U S A. 1984a;81:1883–1887. doi: 10.1073/pnas.81.6.1883. [DOI] [PMC free article] [PubMed] [Google Scholar]
- Sawchenko PE, Swanson LW, Vale WW. Corticotropin-releasing factor: co-expression within distinct subsets of oxytocin-, vasopressin-, and neurotensin-immunoreactive neurons in the hypothalamus of the male rat. J Neurosci. 1984b;4:1118–1129. doi: 10.1523/JNEUROSCI.04-04-01118.1984. [DOI] [PMC free article] [PubMed] [Google Scholar]
- Sawchenko PE, Brown ER, Chan RK, Ericsson A, Li HY, Roland BL, Kovács KJ. The paraventricular nucleus of the hypothalamus and the functional neuroanatomy of visceromotor responses to stress. Prog Brain Res. 1996;107:201–222. doi: 10.1016/s0079-6123(08)61866-x. [DOI] [PubMed] [Google Scholar]
- Shioda S, Nakai Y, Kitazawa S, Sunayama H. Immunocytochemical observations of corticotropin-releasing-factor-containing neurons in the rat hypothalamus with special reference to neuronal communication. Acta Anat (Basel) 1985;124:58–64. doi: 10.1159/000146097. [DOI] [PubMed] [Google Scholar]
- Simmons DM, Swanson LW. High-resolution paraventricular nucleus serial section model constructed within a traditional rat brain atlas. Neurosci Lett. 2008;438:85–89. doi: 10.1016/j.neulet.2008.04.057. [DOI] [PMC free article] [PubMed] [Google Scholar]
- Swaab DF, Bao AM, Lucassen PJ. The stress system in the human brain in depression and neurodegeneration. Ageing Res Rev. 2005;4:141–194. doi: 10.1016/j.arr.2005.03.003. [DOI] [PubMed] [Google Scholar]
- Thannickal TC, Lai YY, Siegel JM. Hypocretin (orexin) cell loss in Parkinson's disease. Brain. 2007;130:1586–1595. doi: 10.1093/brain/awm097. [DOI] [PMC free article] [PubMed] [Google Scholar]
- Thannickal TC, Moore RY, Nienhuis R, Ramanathan L, Gulyani S, Aldrich M, Cornford M, Siegel JM. Reduced number of hypocretin neurons in human narcolepsy. Neuron. 2000;27:469–474. doi: 10.1016/s0896-6273(00)00058-1. [DOI] [PMC free article] [PubMed] [Google Scholar]
- Tomita H, Vawter MP, Walsh DM, Evans SJ, Choudary PV, Li J, Overman KM, Atz ME, Myers RM, Jones EG, Watson SJ, Akil H, Bunney WE., Jr Effect of agonal and postmortem factors on gene expression profile: quality control in microarray analyses of postmortem human brain. Biol Psychiatry. 2004;55:346–352. doi: 10.1016/j.biopsych.2003.10.013. [DOI] [PMC free article] [PubMed] [Google Scholar]
- Trottier S, Chotard C, Traiffort E, Unmehopa U, Fisser B, Swaab DF, Schwartz JC. Co-localization of histamine with GABA but not with galanin in the human tuberomamillary nucleus. Brain Res. 2002;939:52–64. doi: 10.1016/s0006-8993(02)02546-5. [DOI] [PubMed] [Google Scholar]
- Verret L, Goutagny R, Fort P, Cagnon L, Salvert D, Leger L, Boissard R, Salin P, Peyron C, Luppi PH. A role of melanin-concentrating hormone producing neurons in the central regulation of paradoxical sleep. BMC Neurosci. 2003;4:19. doi: 10.1186/1471-2202-4-19. [DOI] [PMC free article] [PubMed] [Google Scholar]
- Wang SS, Kamphuis W, Huitinga I, Zhou JN, Swaab DF. Gene expression analysis in the human hypothalamus in depression by laser microdissection and real-time PCR: the presence of multiple receptor imbalances. Mol Psychiatry. 2008;13:786–799. doi: 10.1038/mp.2008.38. [DOI] [PubMed] [Google Scholar]
Associated Data
This section collects any data citations, data availability statements, or supplementary materials included in this article.


