Abstract
We present a fiber-optic interferometric system for measuring depth-resolved scattering in two angular dimensions using Fourier-domain low coherence interferometry. The system is a unique hybrid of the Michelson and Sagnac interferometer topologies. The collection arm of the interferometer is scanned in two dimensions to detect angular scattering from the sample, which can then be analyzed to determine the structure of the scatterers. A key feature of the system is the full control of polarization of both the illumination and collection fields, allowing for polarization-sensitive detection which is essential for two-dimensional angular measurements. System performance is demonstrated using a double-layer microsphere phantom. Experimental data from samples with different sizes and acquired with different polarizations show excellent agreement with Mie theory, producing structural measurements with sub-wavelength accuracy.
Light scattering techniques, based on analysis of singly scattered (LSS, light scattering spectroscopy) and/or multiply scattered (ESS, elastic scattering spectroscopy) photons, have been widely used to obtain quantitative morphological information of biological scatterers, such as tissues, cells and sub-cellular components [1–3]. The structure of a scattering medium can be identified by analysis of the spectroscopic or angular dependence of scattered light, sometimes in combination with polarization dependence [4–5]. Various approaches have been successfully exploited to study cell biology and bulk tissue properties [1–5], but most are non-interferometric in nature and do not provide depth resolution of the scattering medium.
Angle-resolved low coherence interferometry (a/LCI) adopts an interferometric approach to light scattering. It measures the angular distribution of singly scattered photons to determine the depth-resolved structure of a scattering sample by comparing measured scattering distributions to a database of theoretical predictions [6]. A fiber-bundle-based endoscopic a/LCI probe has recently been demonstrated for in vivo measurement of average nuclear diameters, as a means to detect dysplasia in the upper gastrointestinal tract [7]. Aiming to improve the design of this instrument, specifically, to overcome a limitation on the length of the fiber bundle imposed by the manufacturing process, a Mach-Zehnder interferometer-based (MZI) scanning fiber system was recently proposed [8]. These previous a/LCI systems collect angular scattering in only one dimension (1D), due to instrumental limitations such as the inability to adequately control the polarization of the collected scattering. Measuring scattering in two angular dimensions (2D) is advantageous over 1D measurement in that the additional information can help improve fitting accuracy and may provide access to additional morphological characteristics, such as aspect ratio and orientation of the scatterer.
To address this issue, we present here the next generation of a/LCI, termed the fiber-optic interferometric two-dimensional scattering (FITS) system. The FITS system is based on a novel fiber-optic Michelson-Sagnac hybrid interferometer (MSI) and is superior to the MZI scheme [8] in that it allows for accurate polarization control and the investigation of 2D polarization-sensitive angular scattering. In this Letter, we introduce the principle behind the MSI approach and then demonstrate the performance of the FITS system with scattering measurements from a two-layer microsphere phantom.
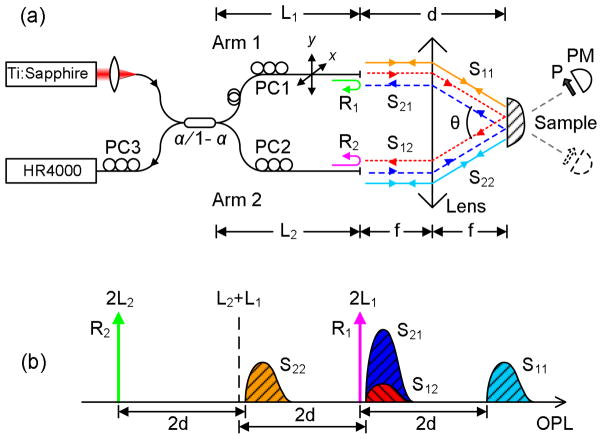
Figure 1(a) shows the FITS system schematic. Light from a Ti:Sapphire laser (Coherent, Inc.: 825nm, Δλ=17nm, 30mW) is coupled into a singlemode fiber coupler (coupling ratio α=0.01%). The two sensing arms are cleaved and their facets are placed in the focal plane of a graded index (GRIN) lens (Newport Corp.: 0.23 pitch, 1.8mm diameter; 4.4mm length) for illumination and collection. The GRIN lens is angled at 8° on the sample side to avoid specular reflection. The majority of source power is coupled into Arm 2, which serves as the illumination fiber. Its output is collimated via the GRIN lens, illuminating the area of interest on the sample. Arm 1 is the low power arm, and serves as the collection fiber that receives the light scattered at angle θ. To maximize the detectable angular range, Arm 2 is positioned toward the edge of the GRIN lens, whereas Arm 1 raster-scans in 2D using a pair of motorized actuators. The polarization of the illumination and collection fields can be tuned independently using polarization controllers (PC1&2) to be linearly polarized along any direction with extinction ratio greater than 20dB, making it possible to measure scattering under any combination of illumination and collection polarization. Signals are detected by a miniature spectrometer (Ocean Optics, Inc.: HR4000).
Fig. 1.
Principle of MSI. (a) Schematic. d – optical pathlength from the fiber ends to the sample; θ – scattering angle; f – focal length; PC1-3 – polarization controllers; P – polarizer; PM – power meter; x & y – scan directions. (b) Optical pathlength of the signals.
The MSI scheme resembles a Michelson or Sagnac interferometer, but its operation relies on coherently mixing both the Michelson and Sagnac components, hence the hybrid mode. Three pairs of signals are generated: 1) Michelson signals R1 and R2, (approx 3.4%) which are the fiber-end reflections and serve as reference signals; 2) Sagnac signals S12 and S21, which are the angular scattering signals and are the signals of interest; 3) backscattering signals S11 and S22, which can also be considered Michelson signals, but are irrelevant since they only represent scattering in the backscattering direction (180°). For interferometric operation, the MSI matches the optical pathlength (OPL) of R1 and S21. This is achieved by setting the OPL of the collection arm L1 to be longer than that of the illumination arm L2 by a specific amount to satisfy a matching condition. Other scattering signals will not be detected due to pathlength mismatch and/or attenuated intensity caused by the unbalanced power splitting.
We first discuss the pathlength matching condition. Table 1 lists the OPL of each signal and Fig. 1(b) illustrates their relative locations assuming L1>L2. The OPLs are solely determined by L1, L2 and the lens-specific parameter d. As a result R1 and S21 can be pathlength matched by tuning the differential of the two arms, L1 − L2. Specifically, S21 (S12) can be placed right next to R1 in the OPL domain to generate interference, as shown in Fig. 1(b). Hence depth-resolved information of S21 (S12) can be acquired using R1 as the reference. The matching condition for a hybrid operation can then be written as
Table 1.
OPL and intensity of MSI signals
| Signal | R1 | R2 | S21 | S12 | S11 | S22 |
|---|---|---|---|---|---|---|
| OPL | 2L1 | 2L2 | L1+L2+2d | L1+L2+2d | 2L1+2d | 2L2+2d |
| Intensity* | αr1 | αr2 | s21 | α2s12 | αs11 | αs22 |
Normalized to source intensity.
| (1) |
where n is the refractive index of the fiber, l1 and l2 are the physical length of the two arms. Signals R2, S11 and S22 will not generate detectable interference in this setup since they are far separated (ΔOPL~2d) from R1 and S21 (S12). This is due to a sufficiently large d (~7.3mm for the GRIN lens) that places these high-frequency interference signals beyond the spectrometer’s detection range (~4mm).
Next we show that a low splitting ratio further attenuates undesirable scattering signals. The primary purpose of the low splitting ratio (α=0.01%) is to attenuate the reference signal to achieve proper power balance with the scattering signal. The value of 0.01% is determined using intensity data from the MZI-based system [8]. Table 1 lists simplified signal intensities, assuming α≪1 and the scattering coefficients and fiber-end reflectivities (all in lower case) satisfy s11, s22, s12, s21≪r1, r2≪1, which are reasonable assumptions for cleaved fibers and scattering of biological samples with small refractive index changes. These intensities show that a small α not only attenuates reference signals, but also effectively eliminate irrelevant signals S11 and S22 by a factor of α, as well as the overlapping signal, S12, by a factor of α2. It is worth noting that the use of a small α is not a requirement for MSI operation since pathlength matching by itself is sufficient to prevent detection of unwanted signals. A small α, however, further isolates the signals of interest by leaving only three signals with substantial strength: sample signal S21, reference signal R1, and non-interferometric background signal R2 which can be frustrated by angle-polishing when necessary.
The symmetry of this system points to the fact that R2 can also serve as the reference signal, provided that L2 > L1. The difference is that using the low-power arm signal R1 as the reference offers superior polarization performance to the use of R2. If R2 were used for reference, the signals S21 and R2 would travel separate paths through Arm 1 and 2 before mixed inside the coupler. The distinct paths would make it impossible to determine or control their polarization states inside the coupler due to disturbance to the fibers. Consequently, there would be no precise control as to which polarization component of the scattering is detected. In the preferred case, where R1 provides reference, its mixing with S21 occurs at the end of Arm 1, prior to propagation through the fiber. Thus, these two signals travel together and fiber disturbance has no effect. The detected polarization component of S21 is determined by the direction of the linearly polarized R1 as it exits Arm 1, a parameter that can be measured and adjusted using a polarizer and a power meter. Similarly the illumination polarization can be adjusted as well. In summary, the MSI scheme allows both the illumination and the collection to be either p- or s-polarized, offering full polarization control and hence the 2D capability.
We demonstrate the capabilities of the MSI-based FITS system by collecting 2D angular scattering from a double-layer silicone phantom with embedded microsphere size standards (Thermo Fisher Scientific, Inc.) with mean diameters of 5.990 ± 0.045 μm and 10.00 ± 0.05 μm, and standard deviations of 1.2% and 0.9%, respectively.
Arm 1 raster scans an area of 1.0×1.8 mm2 (y × x) with a continuous scan (0.35 mm/sec) in x and a step scan (10μm/step) in y. A complete scan currently takes 12 minutes and generates a 2D angular scattering distribution containing 90×170 useful data points, with an angular resolution of 0.212°/step in both directions. At each point of the 2D distribution, the interference spectrum is Fourier-transformed into depth-resolved scattering intensity with a depth resolution of 17.7μm. To demonstrate polarization-sensitive measurements, we use p-polarized illumination and collect both the p- and s- components of the scattered field.
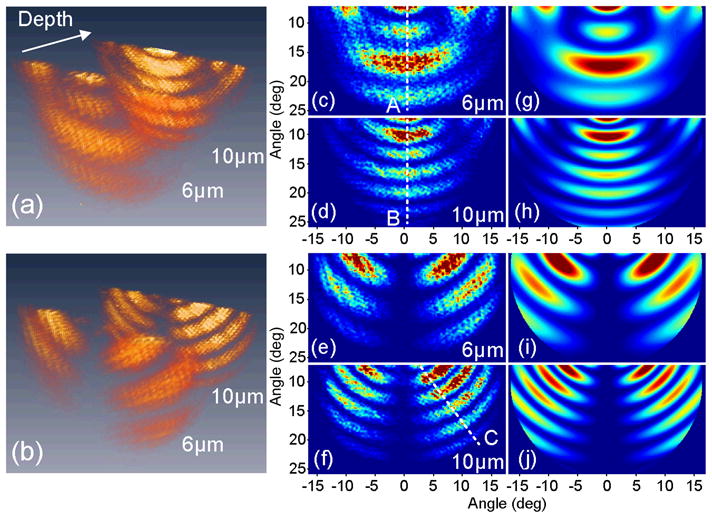
Figure 2(a) and (b) show the depth-resolved 2D angular scattering of the phantom, where the double-layer structure is clearly identified. Figure 2(c–j) shows that the measured distribution for each layer and each polarization are in good agreement with the predictions of Mie theory. The high-frequency fringes seen in the experimental data are likely due to coherent scattering from adjacent microspheres in the phantom. Such information can be potentially useful for estimation of particle density and spacing.
Fig. 2.

Scattering of the double-layer phantom under p-polarized illumination. (a,b) Depth-resolved 2D angular scattering for p- (Media 1) and s-polarized (Media 2) scattering. (c,d) p- and (e,f) s-polarized 2D scattering for 6μm and 10μm layers, respectively. (g,h) and (i,j) corresponding Mie theory simulations. A, B and C are lines along which data fitting is executed.
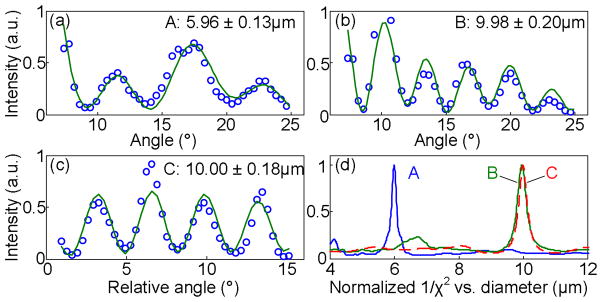
Figure 3 shows fitting examples along lines A, B and C in Fig. 2, producing sub-wavelength sizing accuracy. Data from lines A and B give scattering distributions which could be measured with the traditional 1D a/LCI method. The fitting results for line C demonstrates that accurate sizing can also be obtained using other scattering directions and polarizations. These examples show that a single data acquisition by the FITS system improves fitting accuracy to a few tens of nanometers and reduces fitting errors to less than 200 nm as compared with previous 1D a/LCI systems [8–9], which required multiple scattering measurements to achieve the same accuracy and precision for structural measurements.
Fig. 3.
Mie fitting results along (a) line A, (b) line B, and (c) line C. (d) Normalized 1/χ2 values indicating best fits in diameter.
We have introduced the FITS a/LCI system for polarization-sensitive measurement of 2D angular scattering. The MSI configuration is simple and easy to implement. Compared with previous 1D a/LCI systems, the FITS system can acquire scattering with two more degrees of freedom, i.e. polarization and a second angular direction, both of which are made possible by selecting R1 as the reference signal. Preliminary results demonstrate the system’s potential as a powerful tool for advanced study of light scattering. The 2D data reveals fine details of the scattering patterns and offers versatility in signal analysis. Fitting at different areas of the 2D distribution is likely to provide improved knowledge about scattering samples, and may be particularly useful for analysis of aspherical scatterers.
Acknowledgments
This work is supported by the National Institutes of Health (National Cancer Institute) under Grants R33-CA 109907 and R01CA138594.
References
- 1.Backman V, Gopal V, Kalashnikov M, Badizadegan K, Gurjar R, Wax A, Georgakoudi I, Mueller M, Boone CW, Dasari RR, Feld MS. Measuring cellular structure at submicrometer scale with light scattering spectroscopy. IEEE J Sel Top Quantum Electron. 2001;7 PII S1077-1260X(1001)11252–11259. [Google Scholar]
- 2.Mulvey CS, Curtis AL, Singh SK, Bigio IJ. Elastic scattering spectroscopy as a diagnostic tool for apoptosis in cell cultures. IEEE J Sel Top Quantum Electron. 2007;13:1663–1670. [Google Scholar]
- 3.Arifler D, Pavlova I, Gillenwater A, Richards-Kortum R. Light scattering from collagen fiber networks: Micro-optical properties of normal and neoplastic stroma. Biophys J. 2007;92:3260–3274. doi: 10.1529/biophysj.106.089839. [DOI] [PMC free article] [PubMed] [Google Scholar]
- 4.Wilson JD, Foster TH. Mie theory interpretations of light scattering from intact cells. Opt Lett. 2005;30:2442–2444. doi: 10.1364/ol.30.002442. [DOI] [PubMed] [Google Scholar]
- 5.Smith ZJ, Berger AJ. Integrated Raman- and angular-scattering microscopy. Opt Lett. 2008;33:714–716. doi: 10.1364/ol.33.000714. [DOI] [PubMed] [Google Scholar]
- 6.Brown WJ, Pyhtila JW, Terry NG, Chalut KJ, D’Amico TA, Sporn TA, Obando JV, Wax A. Review and recent development of angle-resolved low-coherence interferometry for detection of precancerous cells in human esophageal epithelium. IEEE J Sel Top Quantum Electron. 2008;14:88–97. [Google Scholar]
- 7.Zhu Y, Terry NG, Woosley JT, Shaheen NJ, Wax A. Design and validation of an angle-resolved low coherence interferometry fiber probe for in vivo clinical measurements of depth-resolved nuclear morphology. J Biomed Opt. doi: 10.1117/1.3520130. in press. [DOI] [PMC free article] [PubMed] [Google Scholar]
- 8.Zhu Y, Terry NG, Wax A. Scanning fiber angle-resolved low coherence interferometry. Opt Lett. 2009;34:3196–3198. doi: 10.1364/OL.34.003196. [DOI] [PMC free article] [PubMed] [Google Scholar]
- 9.Pyhtila JW, Wax A. Polarization effects on scatterer sizing accuracy analyzed with frequency-domain angle-resolved low-coherence interferometry. Appl Opt. 2007;46:1735–1741. doi: 10.1364/ao.46.001735. [DOI] [PubMed] [Google Scholar]


