Abstract
Adverse effects of drugs (AEDs) continue to be a major cause of drug withdrawals both in development and post-marketing. While liver-related AEDs are a major concern for drug safety, there are few in silico models for predicting human liver toxicity for drug candidates. We have applied the Quantitative Structure Activity Relationship (QSAR) approach to model liver AEDs. In this study, we aimed to construct a QSAR model capable of binary classification (active vs. inactive) of drugs for liver AEDs based on chemical structure. To build QSAR models, we have employed an FDA spontaneous reporting database of human liver AEDs (elevations in activity of serum liver enzymes), which contains data on approximately 500 approved drugs. Approximately 200 compounds with wide clinical data coverage, structural similarity and balanced (40/60) active/inactive ratio were selected for modeling and divided into multiple training/test and external validation sets. QSAR models were developed using the k nearest neighbor method and validated using external datasets. Models with high sensitivity (>73%) and specificity (>94%) for prediction of liver AEDs in external validation sets were developed. To test applicability of the models, three chemical databases (World Drug Index, Prestwick Chemical Library, and Biowisdom Liver Intelligence Module) were screened in silico and the validity of predictions was determined, where possible, by comparing model-based classification with assertions in publicly available literature. Validated QSAR models of liver AEDs based on the data from the FDA spontaneous reporting system can be employed as sensitive and specific predictors of AEDs in pre-clinical screening of drug candidates for potential hepatotoxicity in humans.
Introduction
Human adverse effects of drugs (AEDs) cost upwards of $3.6 billion each year and constitute one of the top ten causes of death in the United States (1). Drug safety is a serious concern for pharmaceutical companies, regulators and the general public and novel approaches continue to be sought to facilitate the development of safe and efficacious medicines (2). In order to accelerate the drug approval process, the FDA has reduced the time for reviewing of most drugs from 27 months in 1993 to 14 months in 2001; however, drug withdrawal rates more than doubled (from 1.56% to 5.35%) in the same period (1). Despite rigorous animal testing and human screening in clinical trials, serious AEDs are still frequent either in late-stage clinical trials or post-marketing of the drug (3).
One of the most common reasons for drug withdrawal is evidence of liver AEDs, which can be caused by many mechanisms and although relatively rare, can be fatal. Current approaches for identification of the drug’s potential to be hepatotoxic are not without limitations. It is difficult to predict both which individuals are susceptible to liver damage, and which drugs may cause liver AEDs. In vitro testing and multi-species in vivo animal testing have been shown to be poorly predictive of human liver AEDs (4; 5). There are currently no pre-clinical tests that identify potential human hepatotoxicants with both high sensitivity and specificity (4; 6).
With the limitations inherent in both in vitro and in vivo testing, in silico methods have been evaluated for prediction of AEDs. In silico screening and prioritization of compounds has been widely used for many years in the pharmaceutical industry to evaluate candidate compounds for efficacy, metabolism, and “general toxicity” (7). For example, Quantitative Structure Activity Relationship (QSAR) modeling relates known activities and chemical structural properties to form models that can predict the target activities of yet untested compounds. However, human toxicity data is often difficult to obtain; much of it is proprietary (particularly pre-marketing data), and reports of post-marketing adverse events are difficult to procure. In addition, systems approaches based on mathematical modeling using the kinetics of biochemical pathways involved in liver homeostasis, coupled with in vitro measurements to quantify drug-induced perturbations are being evaluated as part of an integrative framework to enhance the predictivity of in vitro methods (8).
AED reporting is an involved process whereby information is conveyed to the FDA about a patient’s reaction to a drug, with the FDA following up on each entry. While AEDs are believed to be widely underreported, an effort to collect this information is underway (9) through FDA’s Adverse Effects Reporting System [http://www.fda.gov/Drugs/GuidanceComplianceRegulatoryInformation/Surveillance/AdverseDrugEffects/default.htm]. For example, elevated levels of liver enzymes in blood samples are frequently regarded by clinicians as signs of liver damage and, if other pathological states can be excluded, are attributed to drug-induced toxicity (10). The FDA has compiled a Human Liver Adverse Effects Database (HLAED) using Coding Symbols for a Thesaurus of Adverse Reaction Terms to identify reports in the FDA’s Spontaneous Reporting System database associated with liver toxicity endpoints (11). The public version of HLAED contains information on about 500 compounds with physician-reported cases of drug treatment-associated elevations in activity of one or several liver enzymes. A larger database of 3,100 unique pharmaceutical compounds and 9,685 adverse effect endpoints, not available to the public yet, has been used recently by the FDA to develop QSAR models for prediction of liver and kidney injury (9; 12).
Here, we have aimed to develop QSAR models predictive of human liver AEDs for a broad range of compounds in a public version of HLAED that are likely to operate via a plethora of biological mechanisms. We show that not only could we develop models with high sensitivity and specificity, but also that the analysis of chemical descriptors used in modeling yielded important information about the chemical features responsible for liver AEDs.
Experimental Procedures
Data source
Drug names, structures and activities were obtained from the HLAED [http://www.fda.gov/AboutFDA/CentersOffices/CDER/ucm092203.htm]. The database contains approximately 500 compounds with five serum enzyme markers of liver toxicity: alkaline phosphatase (ALP), alanine aminotransferase (ALT), aspartate aminotransferase (AST), lactate dehydrogenase (LDH), and gamma-glutamyl transpeptidase (GGT). In addition, a “composite” liver endpoint was created by the database curators based on the data from all five liver enzyme endpoints. The database classifies drugs as active (i.e., hepato-toxic in humans) or inactive (i.e., non-hepatotoxic in humans) for each of the 6 endpoints based on the number of AED reports relative to the number of “shipping units” (11). For the purposes of this work, the data set was curated as follows. First, compounds with marginal and “NA” scores were discarded for each endpoint. Second, we selected three endpoints with the largest number of “active” compounds for modeling – ALT, AST, and a “composite” score. Third, since the database has a biased distribution of active and inactive compounds (~1:4 active/inactive ratio for each endpoint), we used a (dis)similarity search to exclude a considerable fraction of inactive compounds from the dataset to balance the active/inactive ratio for modeling purposes. To this end, we calculated the Molecular ACCess System (MACCS) structural keys for all compounds in the dataset using the MOE software (Chemical Computing Group, Montreal, Canada). All active compounds were used as a probe subset and the Tanimoto coefficients (13) between each inactive compound and the probe subset were calculated based on their MACCS keys. In this step, structurally dissimilar inactive compounds (Tanimoto coefficient >0.7) were removed from further consideration to achieve a more balanced dataset with active/inactive ratio of approximately 40/60 for each endpoint. Following the filtering detailed above, of the 490 compounds in the HLAED, up to 210 were used for each endpoint. The curated version of the dataset can be found in Supplemental Table 1.
Chemical Descriptors
Two software packages were used to compute chemical descriptors. The MolConnZ software (eduSoft LC, Ashland, VA) was used to compute a wide range of topological indices of molecular structures (14–17). Overall, MolConnZ (eduSoft LC, Ashland, VA) produces over 400 different descriptors. Those with zero value or zero variance were removed. The remaining descriptors were range-scaled. In addition, molecular descriptors were computed using Dragon (v.5.4, Talete SRL, Milano, Italy) software. DRAGON descriptors are classified into 0D, 1D, 2D, and 3D descriptors. The version 5.4 of the Dragon software (Talete srl, Milan, Italy) afforded 1664 descriptors total, covering a wide variety of types. For example, its 0D descriptors contain constitutional descriptors (18); 1D descriptors include functional group counts and atom-centered fragments (19); 2D descriptors include topological descriptors, connectivity indices, information indices and eigenvalue-based indices (20). It should be pointed out that there are many novel descriptor families among 3D descriptors, such as RDF descriptors (21), 3D-MoRSE descriptors (22), WHIM and GETAWAY descriptors (23) and geometrical descriptors (24). All descriptors were cleaned up by eliminating the constant variables and near-constant variables using the built-in function of Dragon. The pairwise correlations for all descriptors were examined and one of the two descriptors with the correlation coefficient R2 of 0.95 of higher was excluded.
Our modelling work (see below) showed that MolconnZ descriptors produced poor models for the dataset considered herein (data not shown); therefore, all models reported in this paper were developed using Dragon descriptors.
QSAR Modeling
To ensure the development of statistically significant and externally predictive QSAR models we have relied on the model development and validation workflow (reviewed in (25)). The workflow is described schematically in Figure 1; and the individual components of the workflow are described below.
Figure 1.
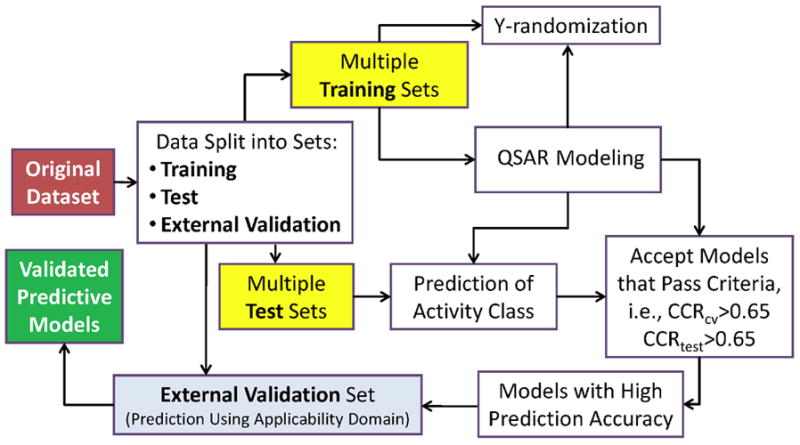
Predictive QSAR modeling workflow.
Dataset division into training, test, and external validation sets
Since it is critical to demonstrate that QSAR models have high prediction accuracy for external validation datasets as opposed to commonly used cross-validation, a subset of the compounds in the original set was excluded randomly (once for each endpoint) and used as the external validation set. The remaining compounds were employed as a modeling set, which was subdivided into chemically diverse multiple training/test sets using the Sphere Exclusion program as detailed previously (26). For the latter training/test sets, the number of compounds included in the test set was gradually increased to obtain the largest possible test set for which accurate predictions could be obtained from models developed for the corresponding smallest possible training set. The Sphere Exclusion algorithm can maximize the diversity of the training/test sets in the descriptor space used for modeling. Due to stochastic nature of the algorithm, the composition of training and test sets is different for different original dataset divisions.
Modeling algorithm
The variable selection k nearest neighbor (kNN) QSAR method (27;28) was used for model development. Briefly, the kNN-QSAR algorithm generates both an optimum k value and an optimal nvar subset of descriptors that afford a QSAR model with the highest training set model accuracy as estimated by the q2 value. The variable selection procedure employs stochastic sampling of the original descriptor space to arrive at models with the highest q2 value; therefore multiple models are developed to increase the efficiency of sampling the descriptor space.
Because the datasets were unbalanced, the statistical significance of models was characterized with correct classification rate (CCR) defined as CCR = 0.5(TP / P + TN / N ) , where P and N are the number of active and inactive compounds in the dataset, TP and TN are the number of known active compounds predicted to be active (true positives) and the number of inactive compounds predicted to be inactive (true negatives), respectively (29). CCR for the training set was calculated using cross-validation (CCRCV), and CCRtest was estimated for the test sets as defined by the formula above for CCR. Models were considered acceptable if both CCRCV and CCRtest were larger than the arbitrary cutoff values (0.65 was used as a default cutoff in this study). Models that did not meet these cutoff criteria were discarded. This approach enables the development of an ensemble of models that satisfies both training and test set accuracy criteria; in our practice the use of such ensemble ensures the highest prediction accuracy for the external dataset, as demonstrated in our recent studies (30). Additional details of this approach are described elsewhere (26). We shall stress that in our approach we do not seek to develop the best QSAR model since our experience suggests that models with the highest training set accuracy do not afford the highest predictive accuracy of the test sets (26). Instead, we rely on the consensus of all models whose training/test set accuracies exceed predefined accuracy thresholds for both training and test sets.
Model applicability domain
Since all QSAR models in kNN QSAR procedure were developed by interpolating activities of the nearest neighbor compounds only in the relevant training sets, a special applicability domain (i.e., similarity threshold) was introduced to avoid making predictions for compounds that differ substantially from the training set molecules (25). Formally, a QSAR model can predict the target property for any compound for which chemical descriptors can be calculated. However, since the training set models are developed in kNN QSAR modeling by interpolating activities of the nearest neighbor compounds, a special applicability domain (31) should be introduced to avoid making predictions for compounds that differ substantially from the training set molecules (32).
In order to measure similarity, each compound could be represented by a point in the M-dimensional descriptor space (where M is the total number of descriptors in the descriptor pharmacophore) with the coordinates Xi1, Xi2, ..., XiM, where Xis are the values of individual descriptors. The molecular similarity between any two molecules is characterized by the Euclidean distance between their representative points. The Euclidean distance di,j between two points i and j (which correspond to compounds i and j) in M-dimensional space can be calculated as follows:
| [1] |
Compounds with the smallest distance between them have the highest similarity. The distribution of distances (pairwise similarities) of compounds in our training set is computed to produce an applicability domain threshold, DT, calculated as follows:
| [2] |
Here, ȳ is the average Euclidean distance of the k nearest neighbors of each compound within the training set, σ is the standard deviation of these Euclidean distances, and Z is an arbitrary parameter to control the significance level. Based on previous studies, we set the default value of this parameter as 0.5, which formally places the boundary for which compounds will be predicted at one-half of the standard deviation (assuming a Boltzmann distribution of distances between each compound and its k nearest neighbors in the training set). Thus, if the distance of the external compound from at least one of its nearest neighbors in the training set exceeds this threshold, the prediction is considered unreliable. The additional details of this approach are described elsewhere (25; 33).
Internal validation
Y-randomization (randomization of response) is a widely used approach to establish the model robustness (34). It consists of rebuilding the models using randomized activities of the modeling set and subsequent assessment of the model statistics. It is expected that models obtained for the modeling set with randomized activities should have significantly lower predictivity for the external validation set than the models built using modeling set with real activities, or the total number of acceptable models based on the randomized modeling set satisfying the same cutoff criterion (CCRCV and CCRtest) is much less than that based on real modeling set.
To evaluate the statistical significance of QSAR models quantitatively, we have employed a standard hypothesis testing approach (35). Specifically, the robustness of the QSAR models is examined by comparing these models to those derived from datasets with randomized activity using Z score statistics. Z score is calculated as follows: . In this equation, is the mean CCRCV value of the datasets with randomized activity values, is the CCRCV of the original dataset with actual (not shuffled) activity values, and σ is the standard deviation from of the distribution of CCRCV values of the random models. The Z score serves as a measure of the uniqueness of models built with actual (original) data as opposed to those generated with the randomized activity data. Models with Z scores exceeding 3 are regarded as statistically significant. This test was applied to all data divisions considered in this study.
Results
QSAR modeling of the FDA Human Liver Adverse Events Database
HLAED contains 490 pharmaceuticals, which are classified at each of the liver toxicity endpoints as active, marginal, inactive, or not available. In order to maximize the number of the compounds accessible for modeling and to correct the uneven distribution bias, we used only three endpoints (ALT, AST and composite) with the highest number of actives, and applied a chemical similarity search method to remove inactive compounds that were structurally dissimilar to active (see Experimental Procedures for details). As a result (Table 1), 205 inactive compounds were excluded from the final composite dataset, leaving 76 active and 114 inactive compounds, which represents ca. 40%/60% ratio between actives and inactives in the final database. Similarly, for the AST endpoint dataset, 84 active and 126 inactive compounds were included in the final dataset. For the ALT dataset, 75 active and 113 inactive compounds were included in the final dataset. The rationale for eliminating structurally dissimilar inactives, rather than randomly removing inactive compounds, is that models are expected to be more robust since it is more difficult to differentiate between structurally similar active and inactive compounds.
Table 1.
Summary of Human Liver Adverse Events Database (HLAED) activity data
| Classification | Originala Composite | Modelingb Composite | Original AST | Modeling AST | Original ALT | Modeling ALT |
|---|---|---|---|---|---|---|
| Activec | 76 | 76 | 84 | 84 | 75 | 75 |
| Marginald | 2 | 0 | 16 | 0 | 18 | 0 |
| Inactivee | 319 | 114 | 301 | 126 | 310 | 113 |
| NAf | 93 | 0 | 89 | 0 | 87 | 0 |
| Total | 490 | 190 | 490 | 210 | 490 | 188 |
Compounds represented in HLAED
Compounds used for modeling (see Methods for selection criteria)
Compounds classified as associated with AEDs during five years of marketing
Compounds deemed marginally active
Compounds not associated with AEDs during five years of marketing
Not available, compounds which may have had one or more AED reports during their first five years of marketing
Predictive accuracy of QSAR models shall be confirmed with external data not used for model development (25; 36); thus, external validation sets were randomly selected from each modeling dataset: 37 compounds from the Composite dataset (19 active and 18 inactive compounds), 42 compounds from the AST dataset (16 active and 26 inactive), and 36 compounds from the ALT dataset (9 active and 27 inactive). The remaining compounds (153 for Composite, 168 for AST, and 152 for ALT endpoint) were used for modeling, with multiple training and test sets generated from each. Average number of compounds in training/test sets was 123/60, 145/57 and 112/58 for Composite, AST and ALT endpoint models, respectively (see Supplemental Table 1 for compound assignments in each model). Variable selection kNN QSAR models were developed for each training set, and the corresponding test set was used to assess the predictive power of each model generated. As discussed in the Methods section, our variable selection kNN QSAR approach results in multiple training set models but not every model is expected to be externally predictive. Cutoff values for leave-one-out (LOO) cross validation CCR (CCRCV) and CCR of test set (CCRtest) were both 0.65. Statistical significance of model predictions was assessed as detailed in Experimental Procedures/QSAR Modeling section.
The total number of models that passed these criteria for each endpoint was 1431 (out of 5980 total), 1977 (5460), and 121 (5980) for Composite, AST and ALT endpoints, respectively. Average CCRCV values were 0.83, 0.84 and 0.79 for Composite, AST and ALT endpoint models, respectively. Average test set accuracy CCRtest values were 0.65, 0.66, and 0.73 for Composite, AST and ALT endpoint models, respectively.
Previous studies have shown that the most accurate external dataset predictions are obtained using a consensus approach, i.e., when predictions for each external compound from individual models are averaged (31). Consensus predictions for the external datasets for each endpoint are shown in Table 2. While the sensitivity, specificity and CCR of the consensus predictions were high for the Composite and AST endpoint models, similar metrics for the ALT endpoint were less impressive.
Table 2.
Accuracy of prediction of external test sets using kNN.
| (A) Composite liver enzyme score | Consensus Prediction | |
|---|---|---|
| Database Actives | Database Inactives | |
| Predicted Actives | 14 | 5 |
| Predicted Inactives | 1 | 17 |
| Sensitivity | 73.7% | |
| Specificity | 94.4% | |
| Overall Predictive Power* | 84.1% | |
| CCR** | 0.85 | |
| (B) AST activity | Consensus Prediction | |
| Database Actives | Database Inactives | |
| Predicted Actives | 14 | 2 |
| Predicted Inactives | 1 | 25 |
| Sensitivity | 87.5% | |
| Specificity | 96.2% | |
| Overall Predictive Power* | 91.85% | |
| CCR** | 0.93 | |
| (C) ALT activity | Consensus Prediction | |
| Database Actives | Database Inactives | |
| Predicted Actives | 6 | 4 |
| Predicted Inactives | 3 | 23 |
| Sensitivity | 60% | |
| Specificity | 88.5% | |
| Overall Predictive Power* | 74.2% | |
| CCR** | 0.76 | |
The average between sensitivity and specificity.
Correct Classification Rate (see Methods).
In order to ensure the accuracy of external dataset predictions, applicability domains of each model were calculated. The applicability domain decreases the number of compounds for which predictions are made, but increases the overall reliability of the predictions by eliminating compounds outside of the applicability domain; the accuracy of the external prediction is typically increased as well. No compounds in the external datasets for Composite, AST or ALT models were found to be outside of the applicability domain.
A y-randomization test was performed for each model wherein activities of training set models were randomized. The Z-scores for ALT, AST, and Composite models were 4.14, 5.86 and 3.65, respectively, indicating the high statistical significance of models built with actual data. Thus, these models may be reliably applied to the external databases of drugs and chemicals, taking the applicability domain into account. Since the modeling approach based on Composite endpoint featured high sensitivity and specificity and we reasoned that it may be reflecting liver AEDs as a consensus, rather than a specific serum enzyme that may not be exclusive for liver injury, it was used for further analysis and in silico screening of large external drug databases. This part of the study, while not intended to represent the “external validation” of the model, is necessary to better understand the utility of the model for screening large chemical sets whereby the predictions, if obtained, may be independently verified either through the focused literature search or, ultimately, in the experimental studies.
Application of QSAR HLAED Models to World Drug Index (WDI) Database
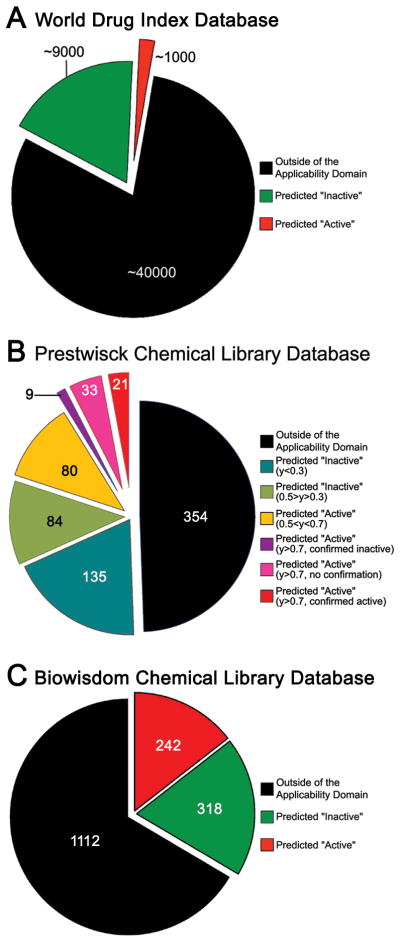
WDI is a database of over 50,000 chemical compounds which includes, among others, most of the small molecule pharmaceuticals currently marketed worldwide. Most approved drugs are presumed to have little or no liver toxicity; thus, it is expected that there should be a relatively small number of compounds in WDI that may be potentially hepatotoxic. We tested both the coverage (i.e., the fraction of the database within the model applicability domain) and predictive ability of our QSAR HLAED models based on Composite endpoint by screening WDI database (Figure 2A). Approximately 40,000 compounds in WDI were outside of the applicability domain for our composite endpoint model, thus no reliable predictions could be made for this subset. Of the remaining ~10,000 compounds, 9,000 were predicted by the model as inactive, and 1,000 were predicted as potentially hepatotoxic. Since WDI is poorly annotated and due to a large number of compounds, it was not possible at this time to perform a literature search to determine whether model-based predictions of liver AEDs can be substantiated. However, we did identify evidence of hepatotoxicity for several compounds in this subset of WDI (see Discussion).
Figure 2.
Results of screening compounds in World Drug Index (A), Prestwick Chemical Library (B), and BiowisdomR Liver Intelligence Module (C) databases.
Application of QSAR HLAED Models to Prestwick Chemical Library (PCL) Database
PCL is a database of 900+ small molecule pharmaceuticals (Prestwick Chemical, Illkirch, France; http://www.prestwickchemical.com/index.php?pa=26). All of the compounds in the database are marketed drugs and it may be assumed that most of these agents have little to no known adverse drug reactions in humans. We screened the PCL using the Composite endpoint model (Figure 2B). Of the 878 organic compounds in PCL, 162 were found to be overlapping with the modeling set and were removed (See Supplemental tables 2 and 3). Of the remaining 716 agents, 354 were outside of the applicability domain. Of the remaining 362 compounds, 219 were predicted as inactive, and 143 were flagged to be potentially hepatotoxic. Since we use a consensus model prediction approach, a final active/inactive prediction for a compound is assigned based on a fraction of all models classifying it as active or inactive (0.5 threshold, i.e., the annotation was based on that by the majority of models). If different thresholds (e.g., 0.3, 0.5, and 0.7) for consensus predictions of compounds as active are applied, 362 compounds can be further subdivided as shown in Figure 2B. While about 62% of compounds predicted as inactive pass a relatively stringent threshold of <0.3 for consensus prediction, 44% of those predicted as active had a strong consensus stringency of >0.7. These 63 compounds were used for web-based search of the publicly available sources (PubMed, PubChem, drug inserts, etc.) for information related to their potential liver AEDs. Through this effort we were able to confirm the existence of reported liver AEDs for 21 out of 63 compounds predicted as active (33%), no data was found on 33 agents, and 9 drugs had at least one report explicitly reporting no liver toxicity (See Supplemental Table 2 for references). It should be noted, however, that model’s predictions should be interpreted with caution since there is not enough information at this time to unequivocally substantiate or refute the classification. Nevertheless, with this cautionary note in mind, these results indicate that our models may be employed to flag compounds that may result in an adverse event for more in-depth testing.
Application of QSAR HLAED Models to BiowisdomR Liver Intelligence Module Database
The BiowisdomR Liver Intelligence Module [http://www.biowisdom.com/content/liver-intelligence-module] database consisted of 1,822 compounds at the time of analysis. The database contains literature-based (i.e., information curated through text mining of more than 19 million data sources) associations between each compound and up to 18 specific sub-categories of liver-related toxicity phenotypes both in animals and humans. The data is expressed in the form of the number of reports linking a compound and an endpoint. First, we removed 150 compounds, which were found to be overlapping with our modeling set (See Supplemental Table 3). Next, we screened the remaining 1,672 compounds using the Composite endpoint model and found that 1,112 compounds were outside of the applicability domain, 318 were predicted to be inactive, and 242 were predicted to be active (Figure 2C). Since this database contains data of potential value for interpreting the mode of action for liver toxicity, we calculated the mean±SD number of links for compounds predicted as active or inactive. Interestingly, the “apoptosis” category of literature-based citations was significantly different between the two groups with twice as many links reported for inactive, then active, compounds (data not shown, p<0.05 by Kruskall-Wallis test).
Application of QSAR HLAED Models to Structurally Similar Toxic/Non-Toxic Compounds
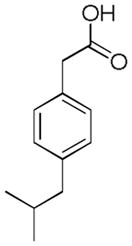
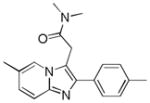
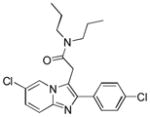
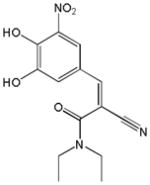
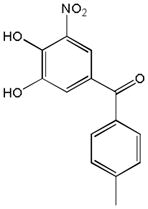
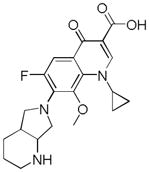
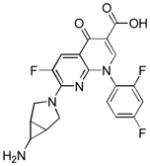
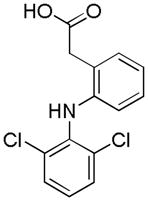
There are a number of pairs of structurally similar drugs that show a dramatic difference in their ability to cause liver toxicity. To determine whether our models can differentiate between very structurally similar compounds, a special external test set of 10 drugs (5 pairs) was explored (Table 3). This specialized external dataset was screened using the Composite endpoint model. The outcome of modeling for structurally similar compounds is equivocal suggesting important limitations of our approach.
Table 3.
Predictions for specialized external test set.
| Name | Ibuprofen | Ibufenac | Zolpidem | Alpidem | Entacapone | Tolcapone | Moxifloxacin | Trovafloxacin | Diclofenac | Bromfenac |
|---|---|---|---|---|---|---|---|---|---|---|
| Structure | 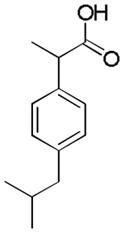 |
 |
 |
 |
 |
 |
 |
 |
 |
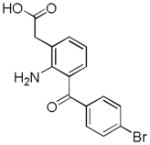 |
| Experimental Activity* | Inactive | Active | Inactive | Active | Inactive | Active | Inactive | Active | Inactive | Active |
| Predicted Activity | Active | Not Covered | Not Covered | Not Covered | Active | Active | Inactive | Not Covered | Active | Active |
“Experimental activity” descriptor refers to the relative toxicity of the compounds in human population. It should be noted that while some of the “inactive” compounds have been reported to elicit adverse drug reactions, the number of the reports, and the fact that such toxicity was observed in long-term treatment cases, lead us to classify these as generally innocuous.
Discussion
Our work shows that even a limited database on drugs with reported incidence of human liver AEDs can be used to produce highly predictive (sensitivity >73%, and specificity >94% for the external dataset) QSAR models. This result underscores the importance of mining data that may be available at the regulatory agencies for potential signatures that can aid in predicting human toxicity. Since the predictive power of the currently available in vitro and in vivo tests, including pre-marketing clinical trials in small human cohorts, is limited, additional computational tools may provide added value to decision making for both drug developers and the regulators.
While the data analyzed here contained six related clinical endpoints indicative of the potential liver damage, only three (ALT, AST and Composite score) had relatively broad coverage among 490 drugs in the database. This is not surprising since ALT and AST are routine clinical chemistry biomarkers widely used to screen for drug toxicity. It is surprising, however, that models built for ALT were not as sensitive or specific as those built for AST or Composite endpoints. While ALT is known to show high sensitivity and is considered as moderately specific biomarker of liver damage, ALT levels have been known to be elevated due to other factors as well. AST activity is also known to fluctuate throughout the day and increase with exercise. It has been suggested that a broad range of biomarkers should be considered instead of a single biomarker (37). It is possible that the Composite liver endpoint model is successful because the data is derived from several biomarkers.
A model predictive of human liver AEDs could be useful in early stage screening of pharmaceutical compounds and could potentially reduce attrition rates, risk of adverse health effects and overall costs of drug development. Thus, we tested our models on “real life” databases of drugs and chemicals to assess the coverage (e.g., applicability domain), performance, and the outcome. The most comprehensive one, World Drug Index, exposed the limitation of our current models (i.e., limited coverage). Nearly 80% of the compounds were outside of the applicability domain of our model and this limitation may be remedied by adding more compounds to the model, a task that requires data release by the pharmaceutical companies and/or the FDA. We predicted about 10% of the ~10,000 chemicals that could be modeled to be potentially hepatotoxic. While poor annotation of the WDI and a large number of compounds predicted as active make it impractical to manually confirm the predictions, there were several well known hepatotoxicants predicted correctly. Isoniazid is known to cause cholestasis and hepatic necrosis (38) and it was predicted to be active by both AST and Composite models. Lamotrigine is known to cause infrequent, potentially immune related hepatotoxicity, and was also predicted to be active by the Composite model. Mercaptopurine has been associated with idiosyncratic hepatitis and cholestatic liver injury, and was predicted to be active by both AST and Composite models (39).
In the Prestwick Chemical Library dataset, as much as 33% of the 63 compounds were predicted as active with high confidence. We have manually curated publicly available biomedical literature and found that most of these have reports indicative of liver toxicity, while only 9% had no reports of toxicity yet had at least one literature citation indicative of the lack of hepatotoxicity. Even though this type of analysis is difficult to interpret with certainty due to potentially varying quality of the studies reporting toxicity, or lack thereof (e.g., differences in experimental design, randomization, use of appropriate controls, potential for conflicts of interests in funding, etc.), it provides additional support to the utility of QSAR models developed. In addition, we have determined that certain toxicity mechanisms, as curated by BiowisdomR, are most frequently reported for the compounds predicted as active. This dataset contains putative assertional meta-data from publicly accessible information on >6,000 liver pathologies, physiological processes, or clinical chemistry liver biomarkers. The “apoptosis” category was significantly under-represented in compounds predicted as active by our models. It is possible that chemicals predicted as hepatotoxic would exert their action by causing necrosis, not apoptosis.
To explore if simple chemical determinants, rather than complex QSAR models, could discriminate “active” from “inactive” compounds, we have performed a chemical fragment-based analysis. Specifically, we calculated 2D fragment descriptors, as detailed in (40), for each compound and considered whether difference exists in the fragment distribution within actives and inactive classes. This analysis showed that no single descriptor is predictive. For example, if only one fragment descriptor was used to develop a model based on the same modelling set mentioned above, the highest CCR of the prediction result of the same external compounds is 0.28, as compared to CCR of 0.85 for the QSAR model developed in this study.
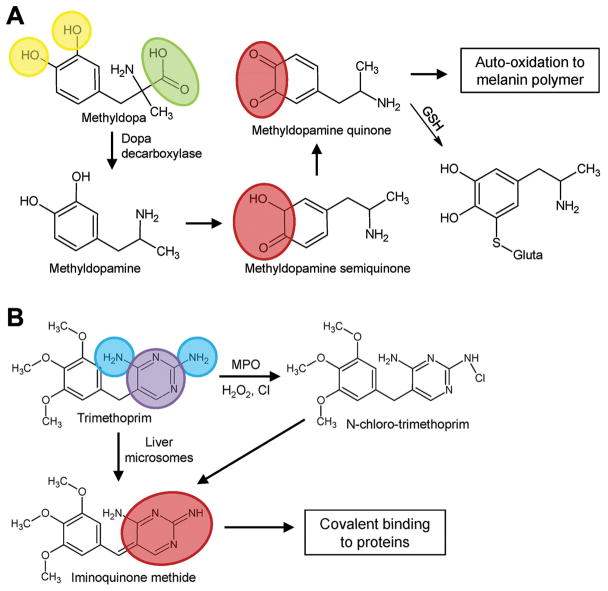
To attempt further mechanistic exploration of the modeling outcomes, we also mapped structural descriptors onto compounds predicted to be active and observed that several descriptors that were frequently used in statistically significant models are associated with the metabolism and activation of the compounds (Figure 3). One of the most frequently used descriptors in our models quantifies the number of hydroxyl groups attached to an aromatic ring. One example of a compound predicted as active is methyldopa (Figure 3A). Methyldopa has been found to cause hepatitis in humans, presumably via protein binding and immune reaction (41). Immune reactions may be triggered by haptens formed by drug molecules binding to liver proteins, or by redox imbalance (42). Methyldopa contains two aromatic hydroxyl groups which have been shown to form methyldopa semiquinone and methyldopa quinone (43). The metabolism of aromatic hydroxyl groups to semiquinones or quinones is known to promote oxidative stress in hepatocytes (44), as well as result in formation of reactive electrophile metabolites that may form covalent bonds with cellular proteins (45). Interestingly, the formation of protein-bound cytotoxic quinone electrophiles can also occur through cytochrome P450-mediated one-electron oxidation of the phenolic hydroxyl group, yielding phenoxy radical which may be further converted to an unstable hemiketal followed by spontaneous ring opening. This mechanism was shown to be of relevance for a number of known toxicants, including aryl ethers (46), para-substituted phenols (47), and thiazolidinediones (48).
Figure 3.
Chemical descriptors used frequently for prediction of compounds as active. (A) For methyldopa, descriptors nArOH (yellow, number of aromatic hydroxyls) and nRCOOH (green, number of aliphatic carboxylic acids) are shown. (B) For trimethoprim, descriptors nPyrimidines (purple, number of pyrimidines) and nArNH2 (blue, number of aromatic amines) are shown. Chemical moieties involved in toxicity are highlighted in red.
Two other chemical descriptors were found to be frequently used in our models, one related to pyrimidines, and the other related to aromatic amines. Trimethoprim, an antibacterial drug, contains an aminopyrimidine moiety, which consists of a pyramidine and two aromatic amines (Figure 3B). Trimethoprim was predicted to be active and is known to cause hepatotoxicity. Trimethoprim may exert toxicity by the activation of the aminopyrimidine moiety to an iminoquinone, which may cause oxidative stress in hepatocytes, or bind to cellular proteins, possibly explaining hypersensitivity and resultant liver damage (49).
It should be noted, however, that the limited accuracy of our models in predicting relatively structurally similar compounds is the challenge which suggests that in some cases chemical mechanisms alone may not account for the toxic potential. For example, ibuprofen is a commonly used over-the-counter analgesic drug generally considered safe with regards to the liver. Ibufenac differs structurally from ibuprofen by a single methyl group, but is known to cause hepatotoxicity in humans. It was suggested that current in silico methodologies may be limited not only by their limited coverage of chemical space, but also due to lack of understanding of the complexities of human risk factors and disease pathways (50). Perhaps in these cases the differential toxicity may arise from metabolic transformations, or the complex disease pathways or other risk factors dependent on the genetic polymorphisms or environmental conditions. Thus, inclusion of the relevant toxicity pathway-based biological data together with chemical descriptors may improve predictive ability and coverage of the models, an approach that was shown to be successful (33) in predicting carcinogenicity.
In addition, we acknowledge the fact that spontaneous reporting of adverse drug events has many important limitations, some of which have been addressed by the FDA during the compilation of the HLAED. While it is difficult to estimate how many individuals are exposed to a drug, the FDA has attempted to correct for this by using shipping units to calculate the report index for the HLAED. It is also possible that the reports available may be incomplete or inaccurate, and due to the voluntary nature of reporting, it can be assumed that adverse events may be underreported. Another limitation of HLAED is that it contains data from the United States only. Different countries fall under separate regulatory agencies, and reporting procedures may vary from country to country, making it difficult to compare or compile data between countries (51). Despite these limitations, HLAED does provide important human liver AED data, information that enables research.
In conclusion, this study shows that a limited database of human liver AED information can be used to create QSAR models with high sensitivity and specificity for validation in external datasets. This conclusion is in agreement with the recent reports on a much larger version of the same database available to the FDA scientists (9). We applied these models to in silico screening of several large databases of drugs and concluded that while the coverage of our models is a limitation, the approach yields results that stand up to validation with literature search. Furthermore, we conclude that our model may be predictive for compounds which cause hepatotoxicity via an oxidative stress mechanism demonstrating that chemical structure may be linked to a particular biological mechanism of toxicity. QSAR models of human AEDs may serve as important tools that may augment in vitro and in vivo drug testing methods which by themselves may not be adequate for prediction of AEDs (4; 5). Our models may be useful to prioritize compounds for pre-clinical screening and may reduce attrition rates associated with clinical and post-marketing liver AEDs.
Supplementary Material
Acknowledgments
We would like to thank Dr. Paul Watkins (UNC) for consultations and Biowisdom Ltd. (Cambridge, UK) for providing access to their datasets. Financial support for these studies was provided, in part, by the National Institutes of Health (R21-GM076059, T32-GM067533, and T32-ES07126) and US EPA (RD83382501). The research described in this article has not been subjected to each agency's peer review and policy review and therefore does not necessarily reflect their views and no official endorsement should be inferred.
References
- 1.Fontanarosa PB, Rennie D, DeAngelis CD. Postmarketing surveillance--lack of vigilance, lack of trust. J Am Med Assoc. 2004;292:2647–2650. doi: 10.1001/jama.292.21.2647. [DOI] [PubMed] [Google Scholar]
- 2.Watkins PB, Bloom J, Hunt C. Biomarkers of acute idiosyncratic hepatocellular injury (AIHI) within clinical trials. Institute of Medicine, National Academies of Sciences; Washington, DC: 2008. [Google Scholar]
- 3.Shah RR. Can pharmacogenetics help rescue drugs withdrawn from the market? Pharmacogenomics. 2006;7:889–908. doi: 10.2217/14622416.7.6.889. [DOI] [PubMed] [Google Scholar]
- 4.Olson H, Betton G, Robinson D, Thomas K, Monro A, Kolaja G, Lilly P, Sanders J, Sipes G, Bracken W, Dorato M, Van Deun K, Smith P, Berger B, Heller A. Concordance of the toxicity of pharmaceuticals in humans and in animals. Regul Toxicol Pharmacol. 2000;32:56–67. doi: 10.1006/rtph.2000.1399. [DOI] [PubMed] [Google Scholar]
- 5.Xu JJ, Henstock PV, Dunn MC, Smith AR, Chabot JR, de Graaf D. Cellular imaging predictions of clinical drug-induced liver injury. Toxicol Sci. 2008;105:97–105. doi: 10.1093/toxsci/kfn109. [DOI] [PubMed] [Google Scholar]
- 6.Abboud G, Kaplowitz N. Drug-induced liver injury. Drug Saf. 2007;30:277–294. doi: 10.2165/00002018-200730040-00001. [DOI] [PubMed] [Google Scholar]
- 7.Tang W. Drug metabolite profiling and elucidation of drug-induced hepatotoxicity. Expert Opin Drug Metab Toxicol. 2007;3:407–420. doi: 10.1517/17425255.3.3.407. [DOI] [PubMed] [Google Scholar]
- 8.Subramanian K, Raghavan S, Rajan BA, Das S, Bajpai DJ, Kumar R, Narasimha MK, Nalini R, Radhakrishnan R, Raghunathan S. A systems biology based integrative framework to enhance the predictivity of in vitro methods for drug-induced liver injury. Expert Opin Drug Saf. 2008;7:647–662. doi: 10.1517/14740330802501211. [DOI] [PubMed] [Google Scholar]
- 9.Ursem CJ, Kruhlak NL, Contrera JF, Maclaughlin PM, Benz RD, Matthews EJ. Identification of structure-activity relationships for adverse effects of pharmaceuticals in humans. Part A: use of FDA post-market reports to create a database of hepatobiliary and urinary tract toxicities. Regul Toxicol Pharmacol. 2009;54:1–22. doi: 10.1016/j.yrtph.2008.12.009. [DOI] [PubMed] [Google Scholar]
- 10.Jaeschke H, Gores GJ, Cederbaum AI, Hinson JA, Pessayre D, Lemasters JJ. Mechanisms of hepatotoxicity. Toxicol Sci. 2002;65:166–176. doi: 10.1093/toxsci/65.2.166. [DOI] [PubMed] [Google Scholar]
- 11.Matthews EJ, Kruhlak NL, Weaver JL, Benz RD, Contrera JF. Assessment of the health effects of chemicals in humans: II. Construction of an adverse effects database for QSAR modeling. Curr Drug Discov Technol. 2004;1:243–254. doi: 10.2174/1570163043334794. [DOI] [PubMed] [Google Scholar]
- 12.Matthews EJ, Ursem CJ, Kruhlak NL, Benz RD, Sabate DA, Yang C, Klopman G, Contrera JF. Identification of structure-activity relationships for adverse effects of pharmaceuticals in humans: Part B. Use of (Q)SAR systems for early detection of drug-induced hepatobiliary and urinary tract toxicities. Regul Toxicol Pharmacol. 2009;54:23–42. doi: 10.1016/j.yrtph.2009.01.009. [DOI] [PubMed] [Google Scholar]
- 13.Willett P. Similarity-based virtual screening using 2D fingerprints. Drug Discov Today. 2006;11:1046–1053. doi: 10.1016/j.drudis.2006.10.005. [DOI] [PubMed] [Google Scholar]
- 14.Hall LH, Mohney B, Kier LB. The Electrotopological State: An Atom Index for QSAR. Quantitative Structure-Activity Relationships. 1991;10:43–51. [Google Scholar]
- 15.Kier LB. Inclusion of Symmetry As A Shape Attribute in Kappa-Index Analysis. Quantitative Structure-Activity Relationships. 1987;6:8–12. [Google Scholar]
- 16.Kier LB, Hall LH. A Differential Molecular Connectivity Index. Quantitative Structure-Activity Relationships. 1991;10:134–140. [Google Scholar]
- 17.Kier LB. Indexes of molecular shape from chemical graphs. Med Res Rev. 1987;7:417–440. doi: 10.1002/med.2610070404. [DOI] [PubMed] [Google Scholar]
- 18.Todeschini R, Consonni V. Molecular Descriptors for Chemoinformatics. Wiley-VCH; 2009. [Google Scholar]
- 19.Viswanadhan VN, Ghose AK, Revankar GR, Robins RK. Atomic physicochemical parameters for three dimensional structure directed quantitative structure-activity relationships. 4 Additional parameters for hydrophobic and dispersive interactions and their application for an automated superposition of certain naturally occurring nucleoside antibiotics. J Chem Inf Comput Sci. 1989;29:163–172. [Google Scholar]
- 20.Balaban AT, Ciubotariu D, Medeleanu M. Topological indices and real number vertex invariants based on graph eigenvalues or eigenvectors. J Chem Inf Comput Sci. 1991;31:517–523. [Google Scholar]
- 21.Hemmer MC, Steinhauer V, Gasteiger J. The Prediction of the 3D Structure of Organic Molecules from Their Infrared Spectra. Vibrat Spectroscopy. 1999;19:151–164. [Google Scholar]
- 22.Schuur JH, Selzer P, Gasteiger J. The Coding of the Three-Dimensional Structure of Molecules by Molecular Transforms and Its Application to Structure-Spectra Correlations and Studies of Biological Activity. J Chem Inf Comput Sci. 1996;36:334–344. [Google Scholar]
- 23.Consonni V, Todeschini R, Pavan M. Structure/Response Correlations and Similarity/Diversity Analysis by GETAWAY Descriptors. 1 Theory of the Novel 3D Molecular Descriptors. J Chem Inf Comput Sci. 2002;42:682–692. doi: 10.1021/ci015504a. [DOI] [PubMed] [Google Scholar]
- 24.Randic M. On characterization of three-dimensional structures. Int J Quantum Chem Quantum Biol Symp. 1988;15:201–208. [Google Scholar]
- 25.Tropsha A, Golbraikh A. Predictive QSAR modeling workflow, model applicability domains, and virtual screening. Curr Pharm Des. 2007;13:3494–3504. doi: 10.2174/138161207782794257. [DOI] [PubMed] [Google Scholar]
- 26.Golbraikh A, Shen M, Xiao Z, Xiao YD, Lee KH, Tropsha A. Rational selection of training and test sets for the development of validated QSAR models. J Comput Aided Mol Des. 2003;17:241–253. doi: 10.1023/a:1025386326946. [DOI] [PubMed] [Google Scholar]
- 27.Zheng W, Tropsha A. Novel variable selection quantitative structure--property relationship approach based on the k-nearest-neighbor principle. J Chem Inf Comput Sci. 2000;40:185–194. doi: 10.1021/ci980033m. [DOI] [PubMed] [Google Scholar]
- 28.Shen M, Xiao Y, Golbraikh A, Gombar VK, Tropsha A. Development and validation of k-nearest-neighbor QSPR models of metabolic stability of drug candidates. J Med Chem. 2003;46:3013–3020. doi: 10.1021/jm020491t. [DOI] [PubMed] [Google Scholar]
- 29.de Cerqueira LP, Golbraikh A, Oloff S, Xiao Y, Tropsha A. Combinatorial QSAR modeling of P-glycoprotein substrates. J Chem Inf Model. 2006;46:1245–1254. doi: 10.1021/ci0504317. [DOI] [PubMed] [Google Scholar]
- 30.Zhu H, Tropsha A, Fourches D, Varnek A, Papa E, Gramatica P, Oberg T, Dao P, Cherkasov A, Tetko IV. Combinatorial QSAR modeling of chemical toxicants tested against Tetrahymena pyriformis. J Chem Inf Model. 2008;48:766–784. doi: 10.1021/ci700443v. [DOI] [PubMed] [Google Scholar]
- 31.Tropsha A, Gramatica P, Gombar VK. The Importance of Being Earnest: Validation is the Absolute Essential for Successful Application and Interpretation of QSPR Models. Quant Struct Act Relat Comb Sci. 2003;22:69–77. [Google Scholar]
- 32.Zvinavashe E, Murk AJ, Rietjens IM. Promises and pitfalls of quantitative structure-activity relationship approaches for predicting metabolism and toxicity. Chem Res Toxicol. 2008;21:2229–2236. doi: 10.1021/tx800252e. [DOI] [PubMed] [Google Scholar]
- 33.Zhu H, Rusyn I, Richard A, Tropsha A. Use of cell viability assay data improves the prediction accuracy of conventional quantitative structure-activity relationship models of animal carcinogenicity. Environ Health Perspect. 2008;116:506–513. doi: 10.1289/ehp.10573. [DOI] [PMC free article] [PubMed] [Google Scholar]
- 34.Rucker C, Rucker G, Meringer M. y-Randomization and its variants in QSPR/QSAR. J Chem Inf Model. 2007;47:2345–2357. doi: 10.1021/ci700157b. [DOI] [PubMed] [Google Scholar]
- 35.Gilbert N. Statistics. W.B. Saunders, Co; Philadelphia, PA: 1976. [Google Scholar]
- 36.Golbraikh A, Tropsha A. Predictive QSAR modeling based on diversity sampling of experimental datasets for the training and test set selection. J Comput Aided Mol Des. 2002;16:357–369. doi: 10.1023/a:1020869118689. [DOI] [PubMed] [Google Scholar]
- 37.Ozer J, Ratner M, Shaw M, Bailey W, Schomaker S. The current state of serum biomarkers of hepatotoxicity. Toxicology. 2008;245:194–205. doi: 10.1016/j.tox.2007.11.021. [DOI] [PubMed] [Google Scholar]
- 38.Tostmann A, Boeree MJ, Aarnoutse RE, de Lange WC, van der Ven AJ, Dekhuijzen R. Antituberculosis drug-induced hepatotoxicity: concise up-to-date review. J Gastroenterol Hepatol. 2008;23:192–202. doi: 10.1111/j.1440-1746.2007.05207.x. [DOI] [PubMed] [Google Scholar]
- 39.Gisbert JP, Gonzalez-Lama Y, Mate J. Thiopurine-induced liver injury in patients with inflammatory bowel disease: a systematic review. Am J Gastroenterol. 2007;102:1518–1527. doi: 10.1111/j.1572-0241.2007.01187.x. [DOI] [PubMed] [Google Scholar]
- 40.Varnek A, Fourches D, Hoonakker F, Solov'ev VP. Substructural fragments: an universal language to encode reactions, molecular and supramolecular structures. J Comput Aided Mol Des. 2005;19:693–703. doi: 10.1007/s10822-005-9008-0. [DOI] [PubMed] [Google Scholar]
- 41.Zimmerman H. Drug Induced Hepatic Disease. In: Plaa G, Hewitt WR, editors. Toxicology of the Liver. 1998. pp. 3–60. [Google Scholar]
- 42.Lavergne SN, Park BK, Naisbitt DJ. The roles of drug metabolism in the pathogenesis of T-cell-mediated drug hypersensitivity. Curr Opin Allergy Clin Immunol. 2008;8:299–307. doi: 10.1097/ACI.0b013e3283079c64. [DOI] [PubMed] [Google Scholar]
- 43.Dybing E, Nelson SD, Mitchell JR, Sasame HA, Gillette JR. Oxidation of alpha-methyldopa and other catechols by cytochrome P-450-generated superoxide anion: possible mechanism of methyldopa hepatitis. Mol Pharmacol. 1976;12:911–920. [PubMed] [Google Scholar]
- 44.Bolton JL, Trush MA, Penning TM, Dryhurst G, Monks TJ. Role of quinones in toxicology. Chem Res Toxicol. 2000;13:135–160. doi: 10.1021/tx9902082. [DOI] [PubMed] [Google Scholar]
- 45.Zhou S, Chan E, Duan W, Huang M, Chen YZ. Drug bioactivation, covalent binding to target proteins and toxicity relevance. Drug Metab Rev. 2005;37:41–213. doi: 10.1081/dmr-200028812. [DOI] [PubMed] [Google Scholar]
- 46.Ohe T, Mashino T, Hirobe M. Novel metabolic pathway of arylethers by cytochrome P450: cleavage of the oxygen-aromatic ring bond accompanying ipso-substitution by the oxygen atom of the active species in cytochrome P450 models and cytochrome P450. Arch Biochem Biophys. 1994;310:402–409. doi: 10.1006/abbi.1994.1185. [DOI] [PubMed] [Google Scholar]
- 47.Ohe T, Mashino T, Hirobe M. Substituent elimination from p-substituted phenols by cytochrome P450. ipso-Substitution by the oxygen atom of the active species. Drug Metab Dispos. 1997;25:116–122. [PubMed] [Google Scholar]
- 48.Kassahun K, Pearson PG, Tang W, McIntosh I, Leung K, Elmore C, Dean D, Wang R, Doss G, Baillie TA. Studies on the metabolism of troglitazone to reactive intermediates in vitro and in vivo. Evidence for novel biotransformation pathways involving quinone methide formation and thiazolidinedione ring scission. Chem Res Toxicol. 2001;14:62–70. doi: 10.1021/tx000180q. [DOI] [PubMed] [Google Scholar]
- 49.Guyton KZ, Thompson JA, Kensler TW. Role of quinone methide in the in vitro toxicity of the skin tumor promoter butylated hydroxytoluene hydroperoxide. Chem Res Toxicol. 1993;6:731–738. doi: 10.1021/tx00035a020. [DOI] [PubMed] [Google Scholar]
- 50.Johnson DE, Rodgers AD. Computational toxicology: heading toward more relevance in drug discovery and development. Curr Opin Drug Discov Devel. 2006;9:29–37. [PubMed] [Google Scholar]
- 51.Hauben M, Bate A. Decision support methods for the detection of adverse events in post-marketing data. Drug Discov Today. 2009;14:343–357. doi: 10.1016/j.drudis.2008.12.012. [DOI] [PubMed] [Google Scholar]
Associated Data
This section collects any data citations, data availability statements, or supplementary materials included in this article.


